
Health and Performance Monitoring Enhancements in vSAN 8 U2

As modern data centers grow in sophistication and size, basic monitoring and troubleshooting can become a challenge. The inherent complexity of an environment can sometimes make even the highly experienced administrator uncertain as to what the cause of an identified issue may be, and how best to resolve it. Fortunately, our engineering and product design teams here at VMware are constantly focused on looking at ways to help present the most helpful information to the administrator in a meaningful, and actionable way.
vSAN 8 U2 introduces a few new enhancements that help with these day-to-day activities that administrators may face. Let's look at a few of these improvements, and how they can help you to better identify and resolve issues in your environment.
Top Contributor Enhancements
First introduced in vSAN 7 U2, the "Top Contributors" view provided an easy way to identify the VMs that contribute to the highest demand on the resources provided by the cluster. While identifying the top contributors can be a part of performance troubleshooting processes, it can also be valuable in understanding correlations of workloads, such as multi-tiered applications that depend on each other to process and serve data to their consumers.
vSAN 8 U2 improves this view with new functionality that helps provide even better insight into resource utilization across the cluster. This new functionality includes:
- Top contributors by time range. When using the Top Contributors view at the cluster level, it can now stack rank the top contributors for a desired time range, instead of a single point in time. One can still view the top contributors for a single point in time by toggling the slider button, as shown in Figure 1.
- Transposed performance metrics. Critical performance metrics will be overlayed with the same metrics for the other top contributing VMs. This is extremely helpful in learning if there are any correlations in workload behavior.
- Stack-ranked VMs adjacent to performance metrics. This provides a quick and easy way to identify the behavior of one VM versus another, and the host(s) that the respective top contributing VMs reside on.
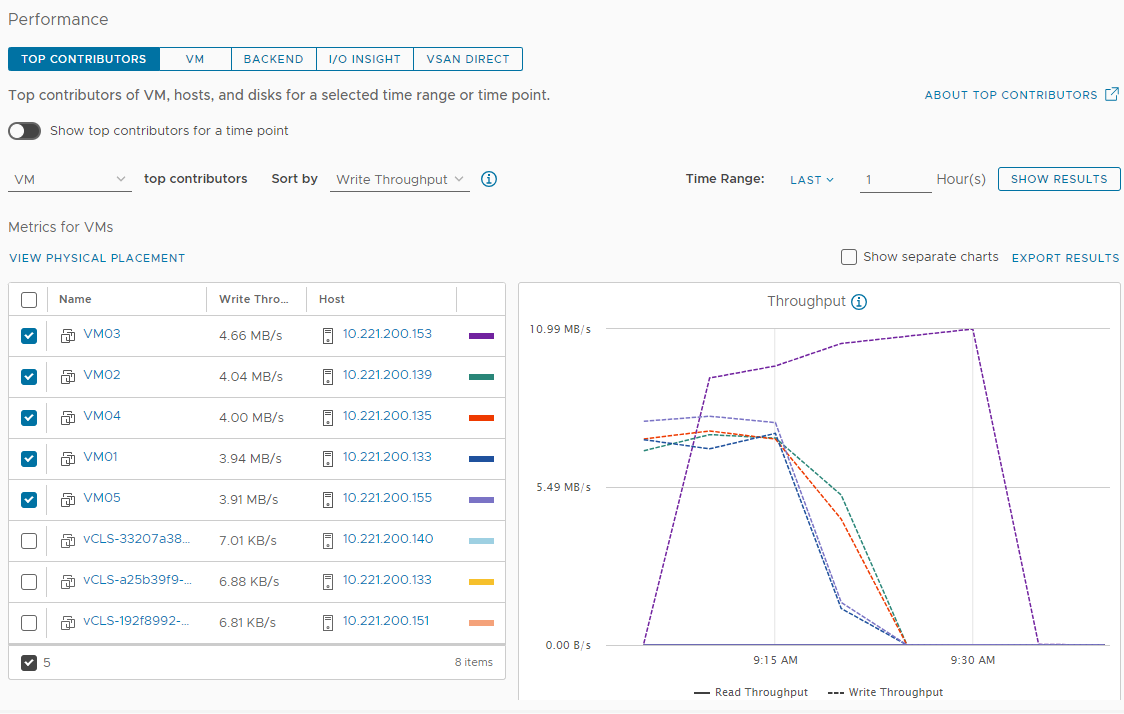
Figure 1. Top Contributors View highlighting VMs consuming the most resources within a given time period.
The top contributors can be VMs, disks, or hosts, and can monitor IOPS, throughput and latency. What's interesting is how these views can help answer some more sophisticated questions. For example, choosing the "Host (backend)" view can help provide answers to questions like "How are TRIM/UNMAP operations impacting VM activity on a given host?" Or perhaps you would like to know which specific storage devices in hosts across a cluster are demonstrating the highest amount of latency. The "Disk" view can be used to learn if there is a disproportionate amount of latency coming from one of the devices versus the other devices in the hosts that make up the cluster.
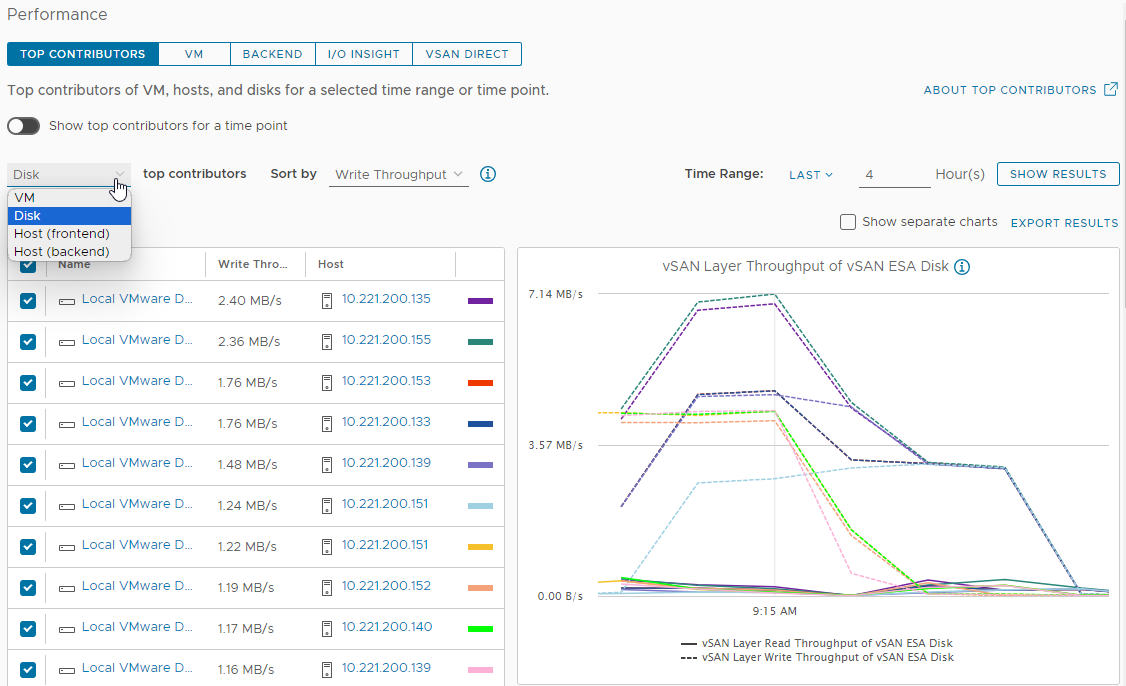
Figure 2. Top Contributors View highlighting storage devices that are being used the most for a given time period.
This new view is easy to navigate and will help administrators determine utilization “hot spots” where the usage of some host resources are being disproportionally consumed in comparison to other host resources across the cluster.
Endurance Tracking for NVMe Devices
VMware recently introduced support of lower endurance "Read Intensive" flash devices for the Express Storage Architecture (ESA) in vSAN 8 U1 and later. This opens up all new opportunities for vSAN ESA hosts to use higher capacity NVMe storage devices at more affordable prices. But with the support of lower endurance devices comes the question, "Can the rate of wear of a NAND flash device be monitored in vCenter Server?"
With vSAN 8 U2, the answer is yes! Thanks to ongoing efforts across the industry to improve standards for NVMe-based NAND flash devices, vCenter Server can now reliably use the Self-Monitoring, Analysis, and Reporting Technology (S.M.A.R.T. or SMART) to check for and alert against any NVMe storage device that is nearing its expected number of device writes. There are two new alarm definitions in vCenter Server, as shown in Figure 3. One will trigger a "warning" alarm at 90% of the estimated endurance, or life of the device, while the other will trigger a "critical" alarm when the estimated endurance of the device has been exceeded.
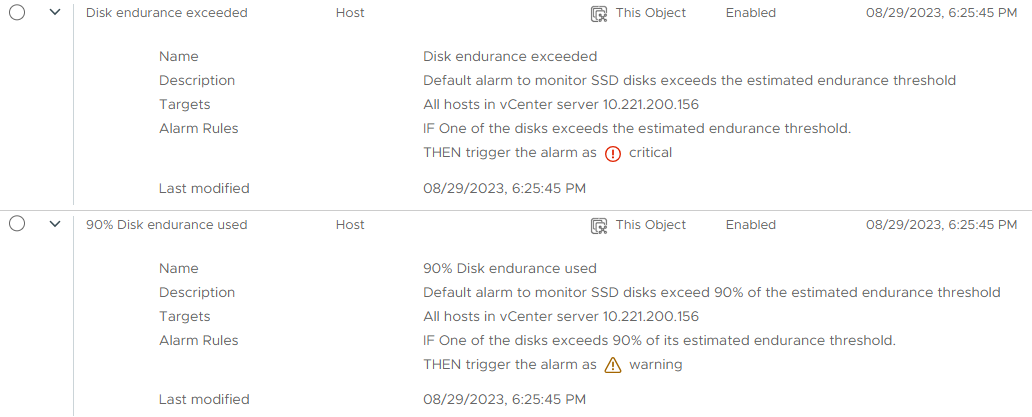
Figure 3. New disk endurance alarm definitions for NVMe storage devices in vCenter Server.
The associated SMART data is queried every 12 hours, which is sufficient for the purpose of tracking the overall wear of a device. The improved reliability of SMART data only applies to NVMe-based storage devices, but with the industry moving away from legacy SATA and SAS interfaces, this is an exciting advance for administrators who wish to accurately monitor the health and longevity of NVMe-based flash devices in their vSAN clusters.
Skyline Health Remediation Enhancements
The Skyline Health Scoring, Diagnostics, and Remediation capability introduced in vSAN 8 U1 marked a dramatic improvement in the ability to properly prioritize, diagnose, and remediate issues identified in a vSAN cluster. vSAN 8 U2 improves this capability by adding some subtle, but essential capabilities.
First, the "Recommendations" provided in a triggered health finding will now be based on the version of vCenter Server used, the version of the vSAN hosts in the cluster, and even the topology used so that the recommendations for remediation can be tailored to match the specific environment. With the improved "Recommendations" in a triggered health finding, we can now provide more specific information if the issue is not addressed, or ignored. This is because vSAN will have a better understanding of how the cluster will behave if a subsequent issue occurs. And lastly, we've enhanced the displayed steps for resolving an identified finding. Most triggered findings will have a preferred, or default recommendation as well as an alternative method to remediate. We've provided better information for triggered health findings that will help you resolve any outstanding issues more deliberately and clearly.
Summary
Since vSAN is a fully integrated component of the hypervisor, it has a truly unique ability to provide end-to-end monitoring of the entire virtualization stack. The enhancements made to vSAN’s performance monitoring capabilities in vSAN 8 U2, as well as new logic built into Skyline Health for vSAN make this latest release showcase this integration even further.