
A High-Performance Computing Application in Finance with Virtual GPUs on VMware vSphere
Introduction - the Business Application
Enterprises use high performance computing (HPC) applications such as Monte-Carlo simulation for the analysis of data using differing scenarios. This approach is used with portfolios of financial instruments for example, to determine the effects and sensitivities of different market conditions on instrument pricing over periods of time. The Monte- Carlo analysis using multiple scenarios gives the trading desk more inputs for projecting how well a financial position will perform under varying conditions in the market. This applies to pricing trades and calculating risk factors – a core set of applications in finance. The key financial term used for these factors in quantitative analysis work is the "Greeks", where the critical quantities being calculated are named "Delta", "Gamma", etc. A separate example of Monte-Carlo simulation is seen in insurance companies where actuaries use this form of analysis to calculate risk. A financial adviser may use Monte-Carlo simulation to determine the long-term market effects on a customer’s portfolio of investments, as another example.
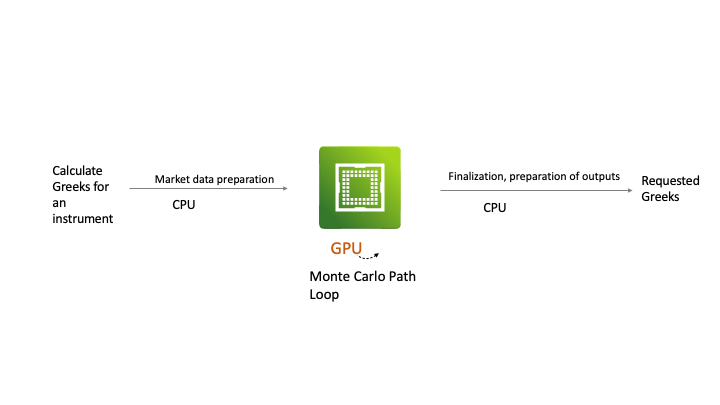
Figure 1: An Example Monte Carlo simulation workload with one GPU executing parts of it
Applications in this HPC space are compute intensive and often require acceleration technology such as GPUs to handle the mathematical algorithms that are part of their calculations. As you can see above, the application we worked on here interleaves CPU-intensive work (to prepare and finalize the data) with its GPU-intensive processing, causing performance analysis of it to deal with a mixture of the two. Parts of the example application in this work were custom-built to use the CUDA APIs to access the GPU. This custom code includes partial differential equations and linear algebra executing at high scale – both of which map well into GPU functionality. The main goal of the business users and architects of this application is to maximize throughput while making the best use of the compute acceleration resources available in their HPC servers.
The application works under a business Service Level Agreement (SLA) for the end users – hence the increased need for acceleration to get the work done in time. These application examples are executed as large batch jobs, such as calculating the end-of-day risk for each trading desk - that must adhere to a strict SLA.
In this article, we describe the infrastructure considerations on VMware vSphere, particularly relating to the use of multiple NVIDIA A100 GPUs on a server. The GPUs were used in an HPC end-user testing scenario using the application as described below.
High Performance Computing – a Brief Overview

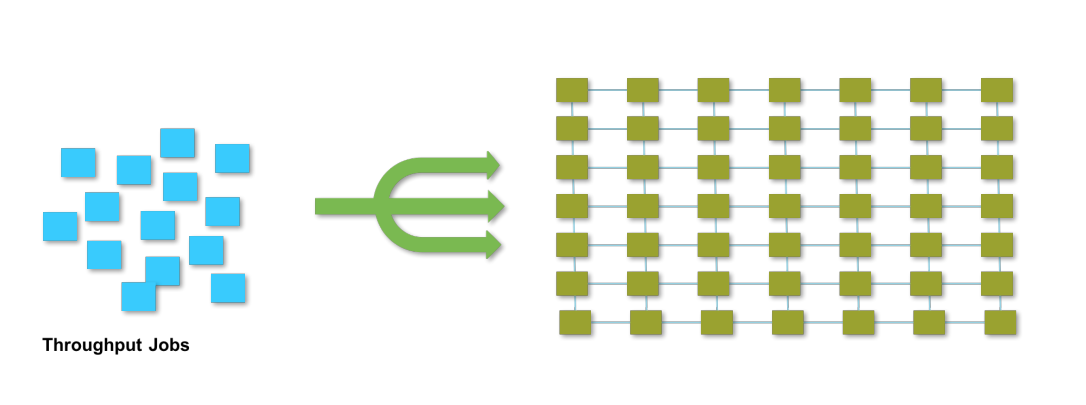
Figure 2: The Throughput Workload Type in High Performance Computing
To understand HPC applications better, we separate them into two broad categories, as detailed in the VMware HPC Application Reference Architecture document For more technical details on deploying HPC applications on vSphere, please consult that document.
Figure 2 shows the “Throughput” form of HPC applications, where each application task, represented in the blue boxes, is executed independently of every other task and does not need to communicate with its neighbors. This type is often referred to as exhibiting “embarrassingly parallel” behavior and it is the type of HPC application we will be focused on in this article. We see that multiple tasks or processes from the left hand side can operate independently in parallel on the compute cores/streaming multiprocessors from a GPU as represented on the right hand side in green.
In contrast to the throughput workloads above, a second type of HPC application is generally categorized as a “Message Passing Interface” (MPI) application. In MPI, the individual tasks/processes that are executed in parallel do need to communicate their data to each other at intervals during their execution, either within one server or across servers over the network. This is a more complex form of HPC application. One example of this is the distributed form of machine learning model training, where multiple servers cooperate and distributed processes exchange gradient data and other information about the model that is being trained. The Horovod framework for distributed training is one example of this style and it uses many of the MPI designs.

Figure 3: The Message-Passing Interface (MPI) workload type in HPC
This MPI type of workload often requires high-speed networking between the nodes. We will not go into this MPI workload type further in this article.
A Virtualized HPC Throughput Application in Testing
We worked in partnership with a VMware customer on testing of their HPC analytics application in VMs on vSphere 7 over several months. The application is a throughput-type one that uses a mix of CPU-intensive and GPU-intensive parts in its processes. It executes a Monte-Carlo simulation that runs for several hours before completion. Before this project began, the application used the Volta V100 class of GPUs on bare metal servers.
The goal of the current work is to improve the overall application performance, largely measured by workload throughput, so that more business processing work could be done in less time. An upgrade was planned for the hardware infrastructure underlying the application - particularly moving from the V100 class of GPUs to the newer, more powerful A100 class of GPU. A decision was made to purchase new server hardware with multiple NVIDIA A100 GPUs in each server. In the test setup, there were four A100 GPUs per host server, where the servers chosen were Dell PowerEdge 750 XA. These servers have 2 TB of RAM and 2 CPU sockets with 32 cores per socket.
During the lifetime of the analytics application, many custom-built processes that use the NVIDIA Compute Unified Device Architecture (CUDA) API are started and then stopped after they have completed their work. CUDA is a standard set of APIs, originally designed and implemented by NVIDIA, to allow developers to use the power of GPUs. The number of concurrent CUDA processes run in parallel on each GPU can be varied by the end-user and it is set at application startup time. Each GPU was expected to handle between ten and twenty CUDA processes concurrently and these sets of processes are started and stopped very frequently during the lifetime of the application. The original V100-based implementation handled 10 concurrent processes per GPU, so it was expected that the A100 would handle more than that – potentially double that number.
The CUDA processes are scheduled onto a GPU by of a layer of software from NVIDIA called MPS or “multi-process service”. MPS schedules those CUDA processes onto the set of available GPUs in parallel, providing performance benefits through optimization of the context switching between them. Because of this process parallelism, where each CUDA process could be active in the GPU at the same time, the application can be a very high consumer of the GPU overall. At certain points in the application lifetime, the GPU is at 95% utilization. The CUDA processes involved here did not require to communicate with each other, either within one server or across servers. So there was no need for high-speed networking in the infrastructure. Over the lifetime of the application, a significant portion of time is spent in the CPU, doing data preparation work. For certain data input types, only 5-10% of the total time was spent in the GPU, but that section of code clearly required the benefits of acceleration.
Technical Infrastructure Software Supporting the Application
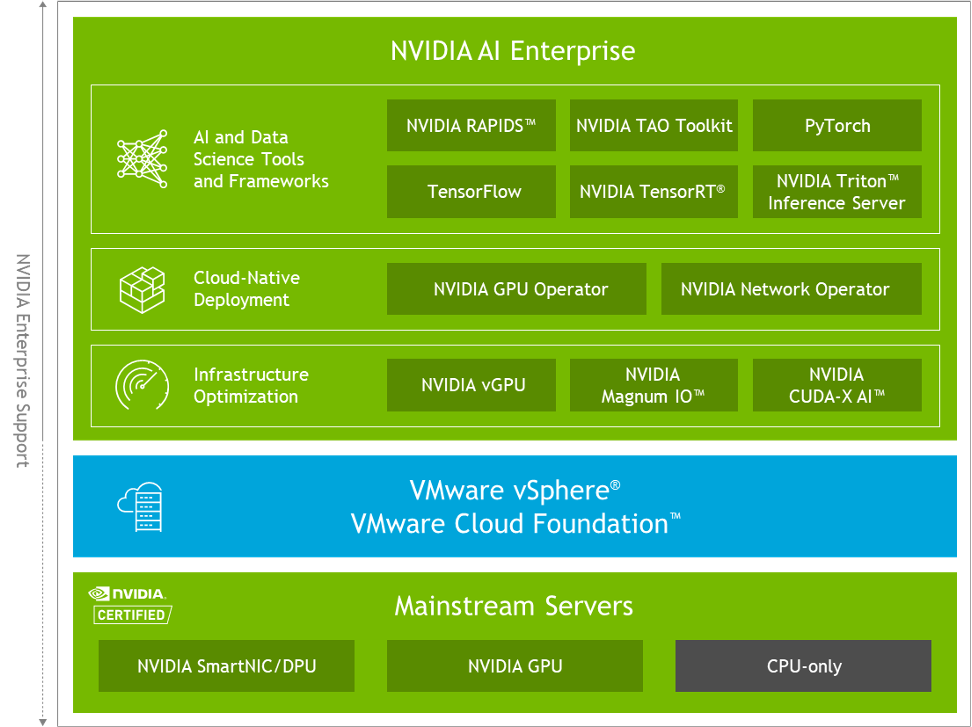
Figure 4: The NVIDIA and VMware AI-Ready Enterprise Platform
Components of the NVIDIA AI Enterprise suite of software, shown above, were used in the test deployment that was deployed on VMware vSphere 7.0.3 as part of the VMware Cloud Foundation portfolio. The NVIDIA AI Enterprise suite provides the host vGPU driver (the NVIDIA vGPU Manager) and the guest OS NVIDIA vGPU driver that would enable each VM to access one or more virtualized GPUs. NVIDIA AI Enterprise suite also contains other higher-level platforms, such as NVIDIA Triton Inference Server and NVIDIA TensorRT, for the data scientist/analyst to use. The NVIDIA AI Enterprise suite is supported on vSphere 7.0.3 and later versions of vSphere by NVIDIA and is certified on VMware vSphere and on VMware Cloud Foundation.
The NVIDIA host vGPU driver from the AI Enterprise suite was installed using the “esxcli software vib install -v <filename>” method. The matching guest operating system NVIDIA vGPU driver was installed in the test VMs using the standard NVIDIA driver.run file that is supplied as part of the suite. RedHat Linux was used as the guest OS in the VM. The guest OS vGPU driver was not run within a container in this testing, although that containerized form of driver installation is an allowed deployment method, particularly for cloud-native or Kubernetes environments. An NVIDIA Licensing Server was run separately in a management VM to supply the correct NVIDIA licenses to the guest operating system vGPU driver. Although the vGPU driver software allows a physical GPU to be shared by two or more VMs, this was not the goal of the initial testing. Sharing a physical GPU across multiple VMs using NVIDIA Multi-Instance GPU (MIG) was pursued in a separate, later phase of testing that is outside the scope of our discussion here.
For this application testing, two VM-based scenarios were deployed using the analytics application with varying numbers of parallel CUDA processes, under MPS: -
(a) A single large VM occupying most of the resources of the physical host server with all four physical GPUs presented as a vGPU profile to that VM;
(b) A set of four smaller sized VMs with 1 physical GPU presented as a vGPU profile to each VM.
The VMs used VMware vSAN as the basis for their storage and they were attached to a 10 GigE network using the standard VMXnet3 drivers. The input data for tests was loaded onto the file system for each VM based on the vSAN storage.
Initial Test Findings
The initial test was intended to understand the application performance with a single, large VM with 128 vCPUs, with most of the physical RAM on the Dell R750XA server assigned to it, and all 4 GPUs fully assigned to this one VM. A 5% portion of the physical server’s RAM was set aside for VMware vSphere's use and therefore not used by the resident VM.
The four full GPUs were presented to the large VM using a vGPU profile for each onethat fully occupied the GPU framebuffer memory in time-sliced mode. The vGPU profile used is named "grid-a100d_80c", signifying the full 80 GB of memory on the A100 GPU and "c" indicating "compute-intensive".
Since this test was done on vSphere 7.0.3, the maximum limit was four for a set of multiple vGPU profiles per VM. That limit moves up to 8 vGPUs per VM (representing 8 physical GPUs) with vSphere 8. The single VM effectively occupied the server and all 4 GPUs on that server, through having its four vGPU profiles. No other VM was run on the server during testing.
Testing was done on vSphere 7.0.3f so as to be compliant with VMware Cloud Foundation 4.4, which is a current standard at the customer site. The single large VM occupied 95% of the main memory on the server.
Because the Dell R750XA server hardware has two sockets with 32 cores per socket and hyper-threading was enabled, the number of vCPUs on the VM was set to 128 to match the hyperthread count. The cores-per-socket value for the VM settings was configured to 64, calculated by dividing the number of hyperthreads by the CPU socket count.
Since there are two NUMA nodes on this server, and the large 128 vCPU VM would span both NUMA nodes, we set the vSphere Advanced Configuration settings on the VM as follows: -
sched.node0.affinity = 0
sched.node1.affinity = 1
These VM-level advanced settings, along with the cores-per-socket setting (64), ensured that the NUMA physical topology in the hardware was passed through to the VM correctly. It is important for the correct operation of the guest OS vGPU driver that the topology understanding is reported accurately in the VM's guest OS.
Using the following command at the vSphere ESXi console level
esxcli hardware pci list
we were able to see the hardware-level NUMA node identity for each GPU, seen on the last line below. On this particular server, two GPUs were associated with NUMA node 0 and two GPUs were associated with NUMA node 1 at the hardware level. Here is a snippet of the output of the above command for one of the GPU devices (data has been deleted for brevity):
0000:17:00.0

   Address: 0000:17:00.0

   Segment: 0x0000

   Bus: 0x17

   Slot: 0x00

   Function: 0x0

   VMkernel Name: vmgfx3

   Vendor Name: NVIDIA Corporation

   Device Name: NVIDIA A100-PCIE-80GB

   NUMA Node: 0
When the guest OS vGPU driver was installed into the VM, we were able to see that the pair of GPUs in each NUMA node were assigned correctly to their NUMA home node as seen by the VM’s operating system. This is seen in the file located in the guest operating system at
/var/run/nvidia-topologyd/VirtualTopology.xml
No NVLink or NVswitch connections were used in this test, as there was no need for inter-GPU or inter-process communication between the CUDA processes.
The results from this single, large VM test showed that significant throughput overhead was incurred by the application, so it was decided to reduce the size of this monolithic VM and scale out the workload across a set of smaller-sized VMs. Through profiling, it was clear that the application code makes intensive use of the CUDA API calls named cudaMalloc(), cudaMemcpy() and cudaDeviceSynchronize() respectively. The performance effects of using these calls very heavily, along with certain CUDA process-level scheduling concerns were mitigated by deploying more, smaller-sized VMs on the same server.
A Scale-Out Test with Four VMs
In the second test setup, four smaller VMs, each with 16 vCPUs were deployed on the same host server. This scale-out test, including splitting the workload equally across the VMs, was possible because this application exhibits the HPC throughput design discussed earlier. What that means is that each individual within the CUDA processes that constitute the application can run on its own chunk of input data independently of every other – and the processes do not need to communicate with each other to synchronize on the data. This provides an ideal situation for breaking up a monolithic single application running in a large VM into separate smaller VMs that contain subsets of the application processes. However, it may not suit every HPC application.
Four VMs were used on the same test server host and those VMs were sized carefully to fit within the physical and NUMA boundaries of the server hardware. The amount of RAM assigned to each VM was adjusted to one quarter of the size given to the single, monolithic VM. The number of VMs could be expanded to eight even smaller VMs if needed, over time, but this initial phase of testing did not pursue that option.
Each of the four VMs on the test server was assigned a single virtual GPU (vGPU) of its own in the vSphere Client UI with a vGPU profile named “grid_a100d-80c”. This was done using the vSphere Client’s “Add PCIe Device” functionality. The effect of the system administrator assigning that vGPU profile to a VM is that the full memory and compute power of one A100 GPU device is entirely available to that one VM. Each VM therefore had a captive GPU of its own.
There was no sharing of the GPUs across multiple VMs here. Sharing physical GPUs across VMs on a single host server is a feature that is supported using different vGPU profiles. In the testing, there were four VMs on the same physical server that earlier held the single large VM. No NVLink or NVswitch hardware connections between GPUs were used in this test, as was also the case with the single large VM testing.

Figure 5: Performance comparison of 1 Large VM versus 4 Smaller VMs
As the application was executed across the four VM setup, the system outperformed the single-VM deployment of the application by double-digit percentages as measured in throughput terms. These numbers differed across the different datasets provided as input, but they were very encouraging for the virtualization platform. Some reasons for that improvement in the application’s throughput are outlined below. At the time of this writing, further tests are being executed using vGPUs and Multi-instance GPU support on even more VMs, to look for further potential gains.
Application Performance Observations
When analyzing multiple test results from the various types of setup above, a number of reasons were found for the performance differences between the single VM case and the four smaller VMs running in separate tests on the same server.
1. CUDA Process scheduling and scaling across the GPUs was found to be optimal at 8 or fewer processes per GPU. At that point, a plateau was evident in the performance graphs. This is an area that is under technical investigation at the time of this writing.
2. Intensive use of the cudaMalloc (for memory allocation) and cudaMemcpy API calls for very small quantities of memory caused the memory subsystem to be under considerable pressure. By dividing the workload into four parts, that pressure was mitigated. The application logic may be re-worked over time in this area.
3. In general, a collection of smaller VMs give better performance and mobility than a single large one does for this type of application and many other virtualized applications. However, not all application datasets can be split into four or more separate and independent units to be run in separate VMs in this way.
In the longer term, the application will move onto VMware vSphere 8 in order to exploit the latest vGPU driver software from NVIDIA and the ongoing improvements made to vGPU support on vSphere.
Conclusions
vSphere is a very capable and high-performing platform for deploying compute-intensive, high-performance applications such as Monte-Carlo Simulation applications, as used in the financial industry and in many other industries. Scaling out using multiple VMs can give significant performance benefits where highly parallel independent processing is present in applications. vSphere reduces your costs by giving you more efficient management and utilization of your infrastructure – and allows you to gain performance at the same time, as seen in this tested throughput-type HPC application.