
Applications
Accelerating Oracle Instance / Crash Recovery using PMEM – An Investigation
This blog addresses the instance or crash recovery aspect of Oracle database and investigates if Persistent Memory can help with speeding up the Oracle crash recovery process.

‘It is a capital mistake to theorize before one has data. Insensibly one begins to twist facts to suit theories, instead of theories to suit facts.’ – Sherlock Holmes Quote (A Scandal in Bohemia).
Tryst with Redis (Re-architecting an Application to Leverage PMEM)
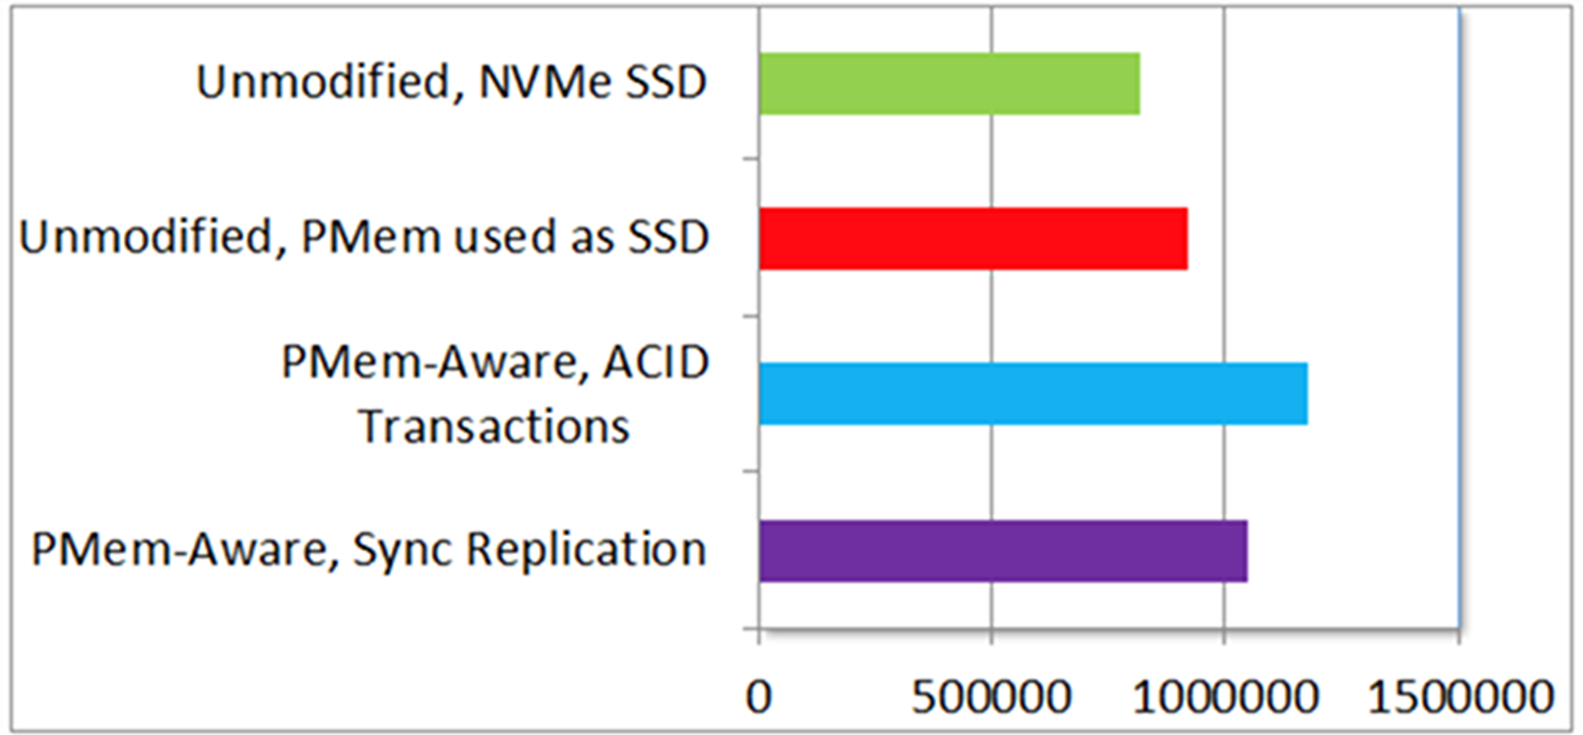
To illustrate the benefits of byte-addressable persistent memory, we took a popular open source application Redis and modified it to take full advantage of persistent memory.
Redis, by default, only commits key-value transactions to memory. Persistence across reboot (e.g., due to power loss) is provided by periodically writing transaction logs to storage. By default, transaction log is written to storage every second. Therefore, Redis can lose a second’s worth of transactions in the default configuration.
Initially, we experimented by storing Redis transaction logs in persistent memory. That provided noticeable but marginal (around 12%) improvement in performance. Then, we decided to modify Redis to take full advantage of byteaddressable persistent memory by placing the entire key-value database in persistent memory. We call the modified version PMem-aware Redis. We added very low-overhead journaling to make Redis transactions on persistent memory crash consistent. With these changes, we got around 45% improvement in transaction throughput.
In addition, PMem-aware Redis can recover from crash almost instantaneously because the database is already in persistent memory and need to be read from disk. For comparison, unmodified Redis using NVMe SSD can take minutes to recover after crash, even for modest (around 1 GB) database sizes. Finally, since persistent memory is local to a host, we experimented with replicating Redis transactions to a standby host. Even with replication, PMemaware Redis performed around 28% better than unmodified Redis using a fast and host-local NVMe SSD without any replication.
More details on this can be found in the article ‘Persistent Memory Initiative’ and white paper ‘Persistent Memory Performance on vSphere 6.7 Performance Study’ .
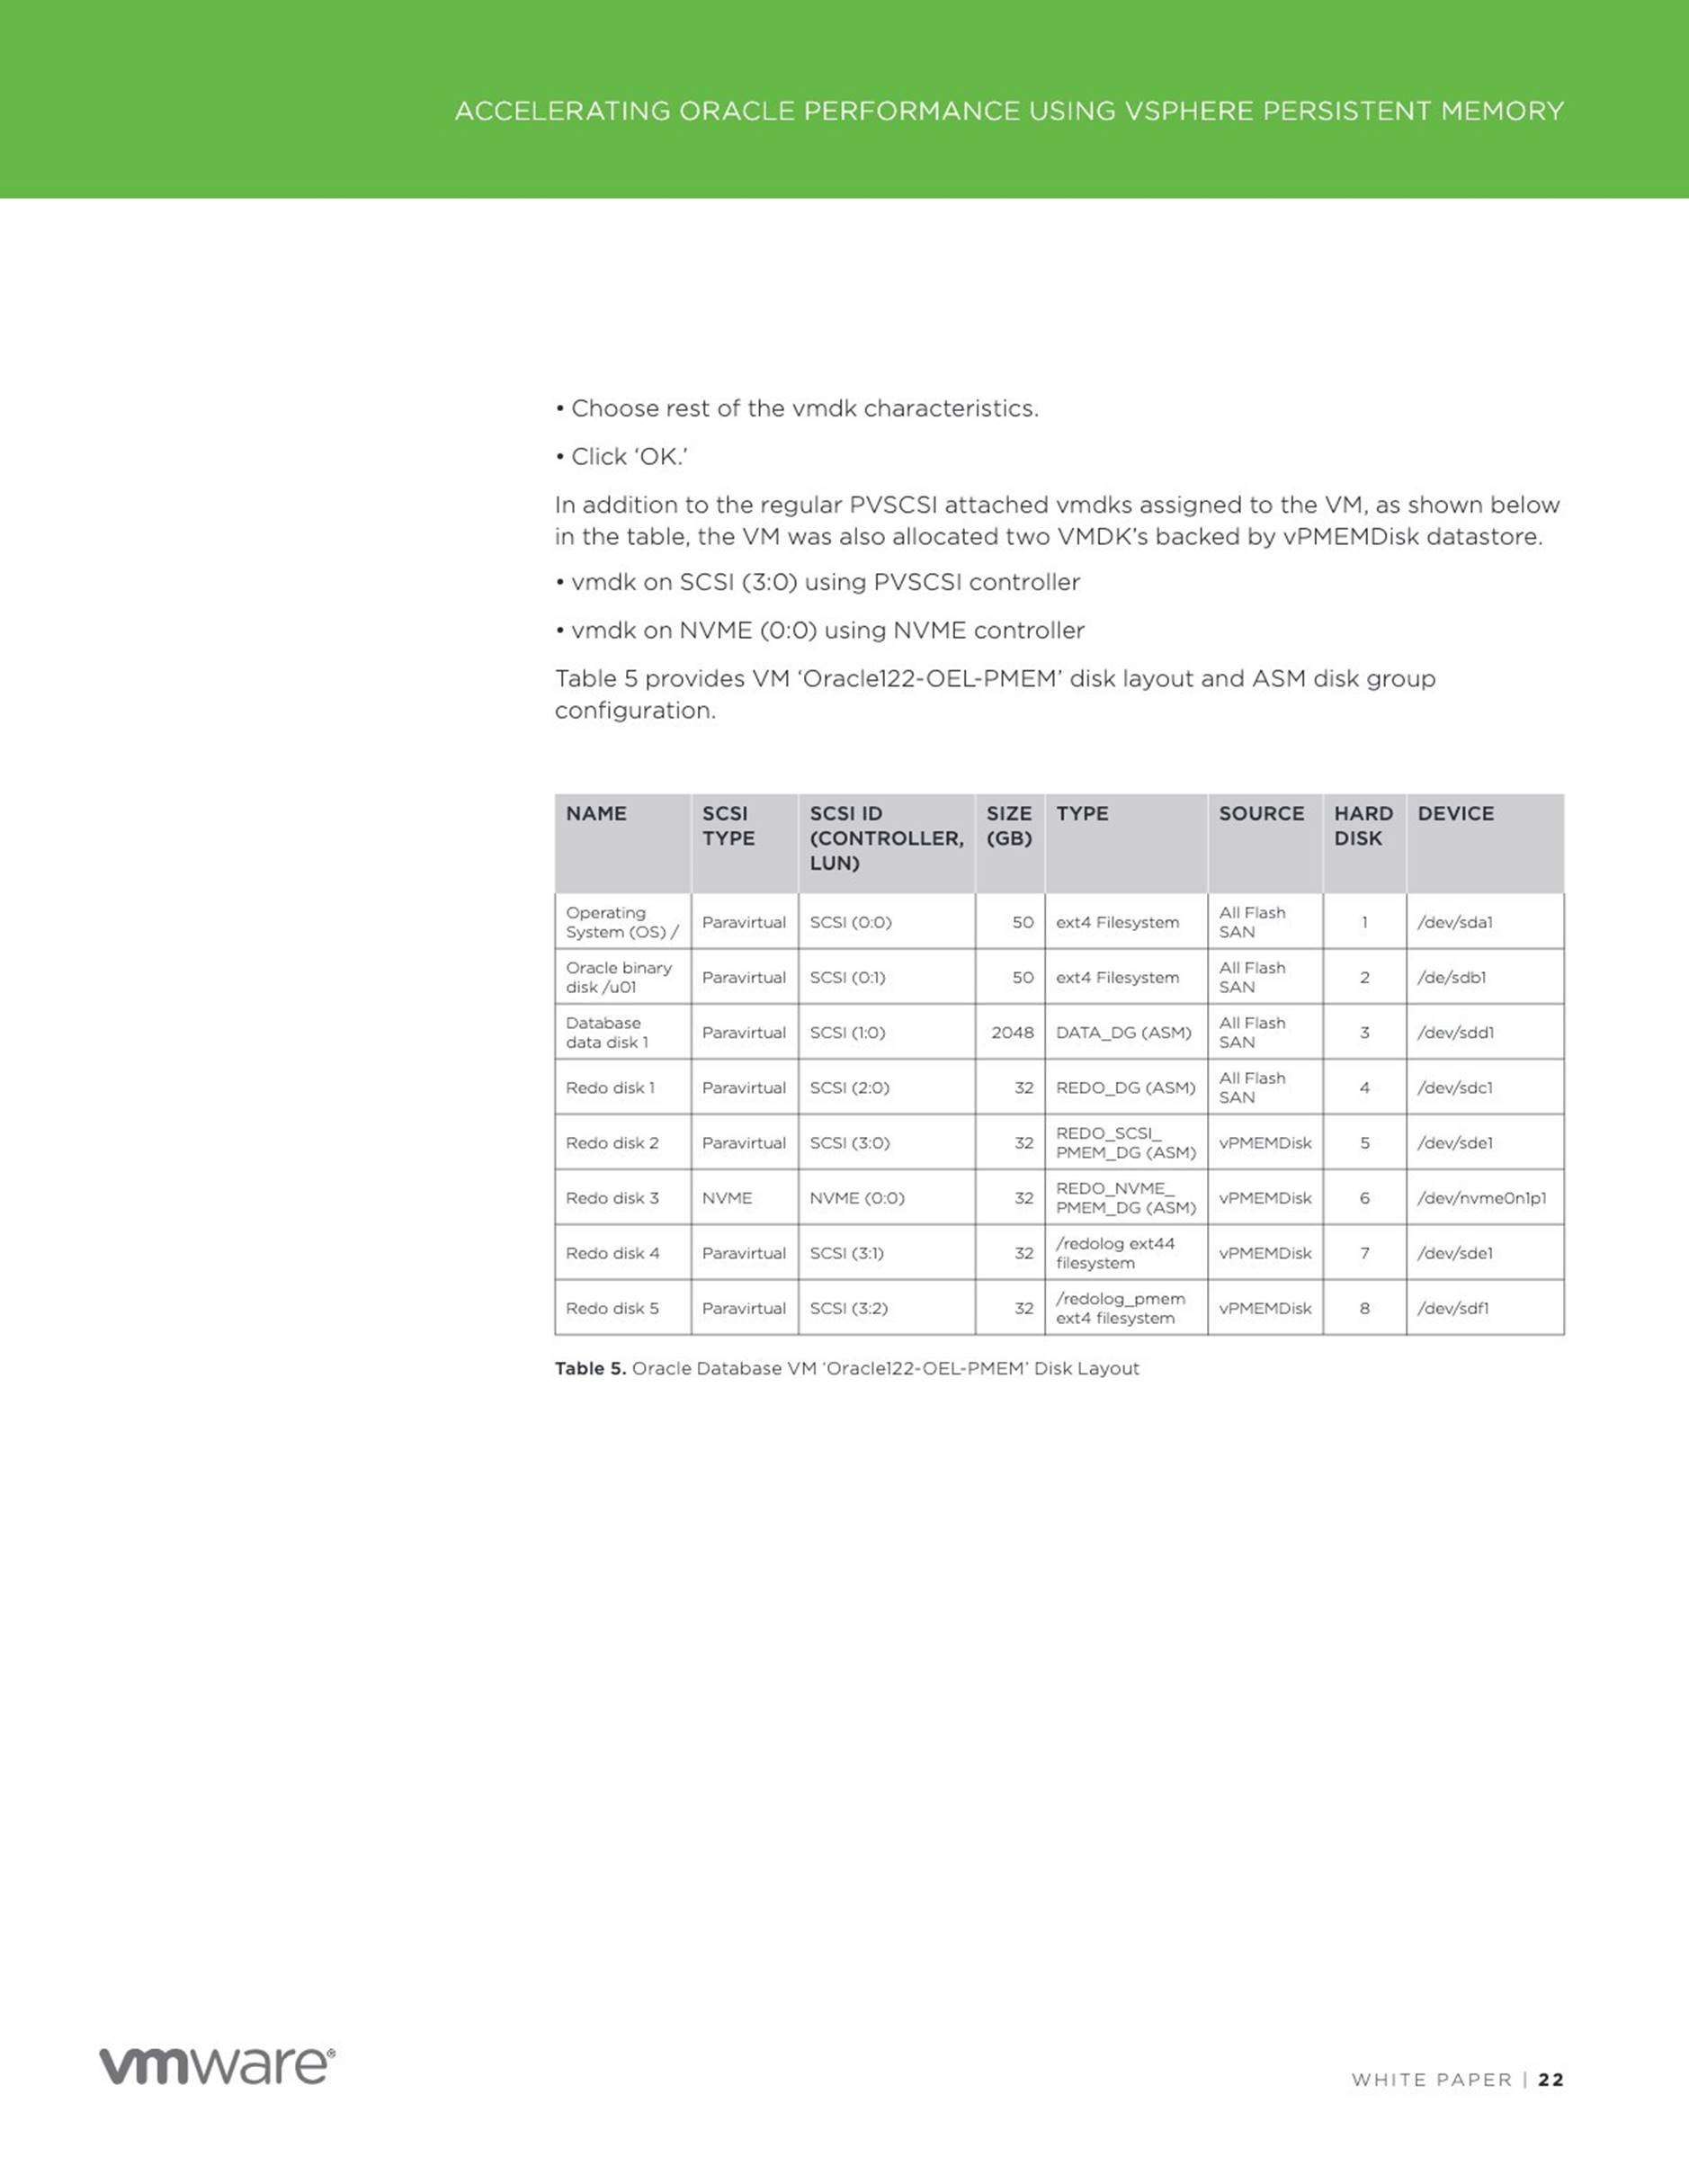
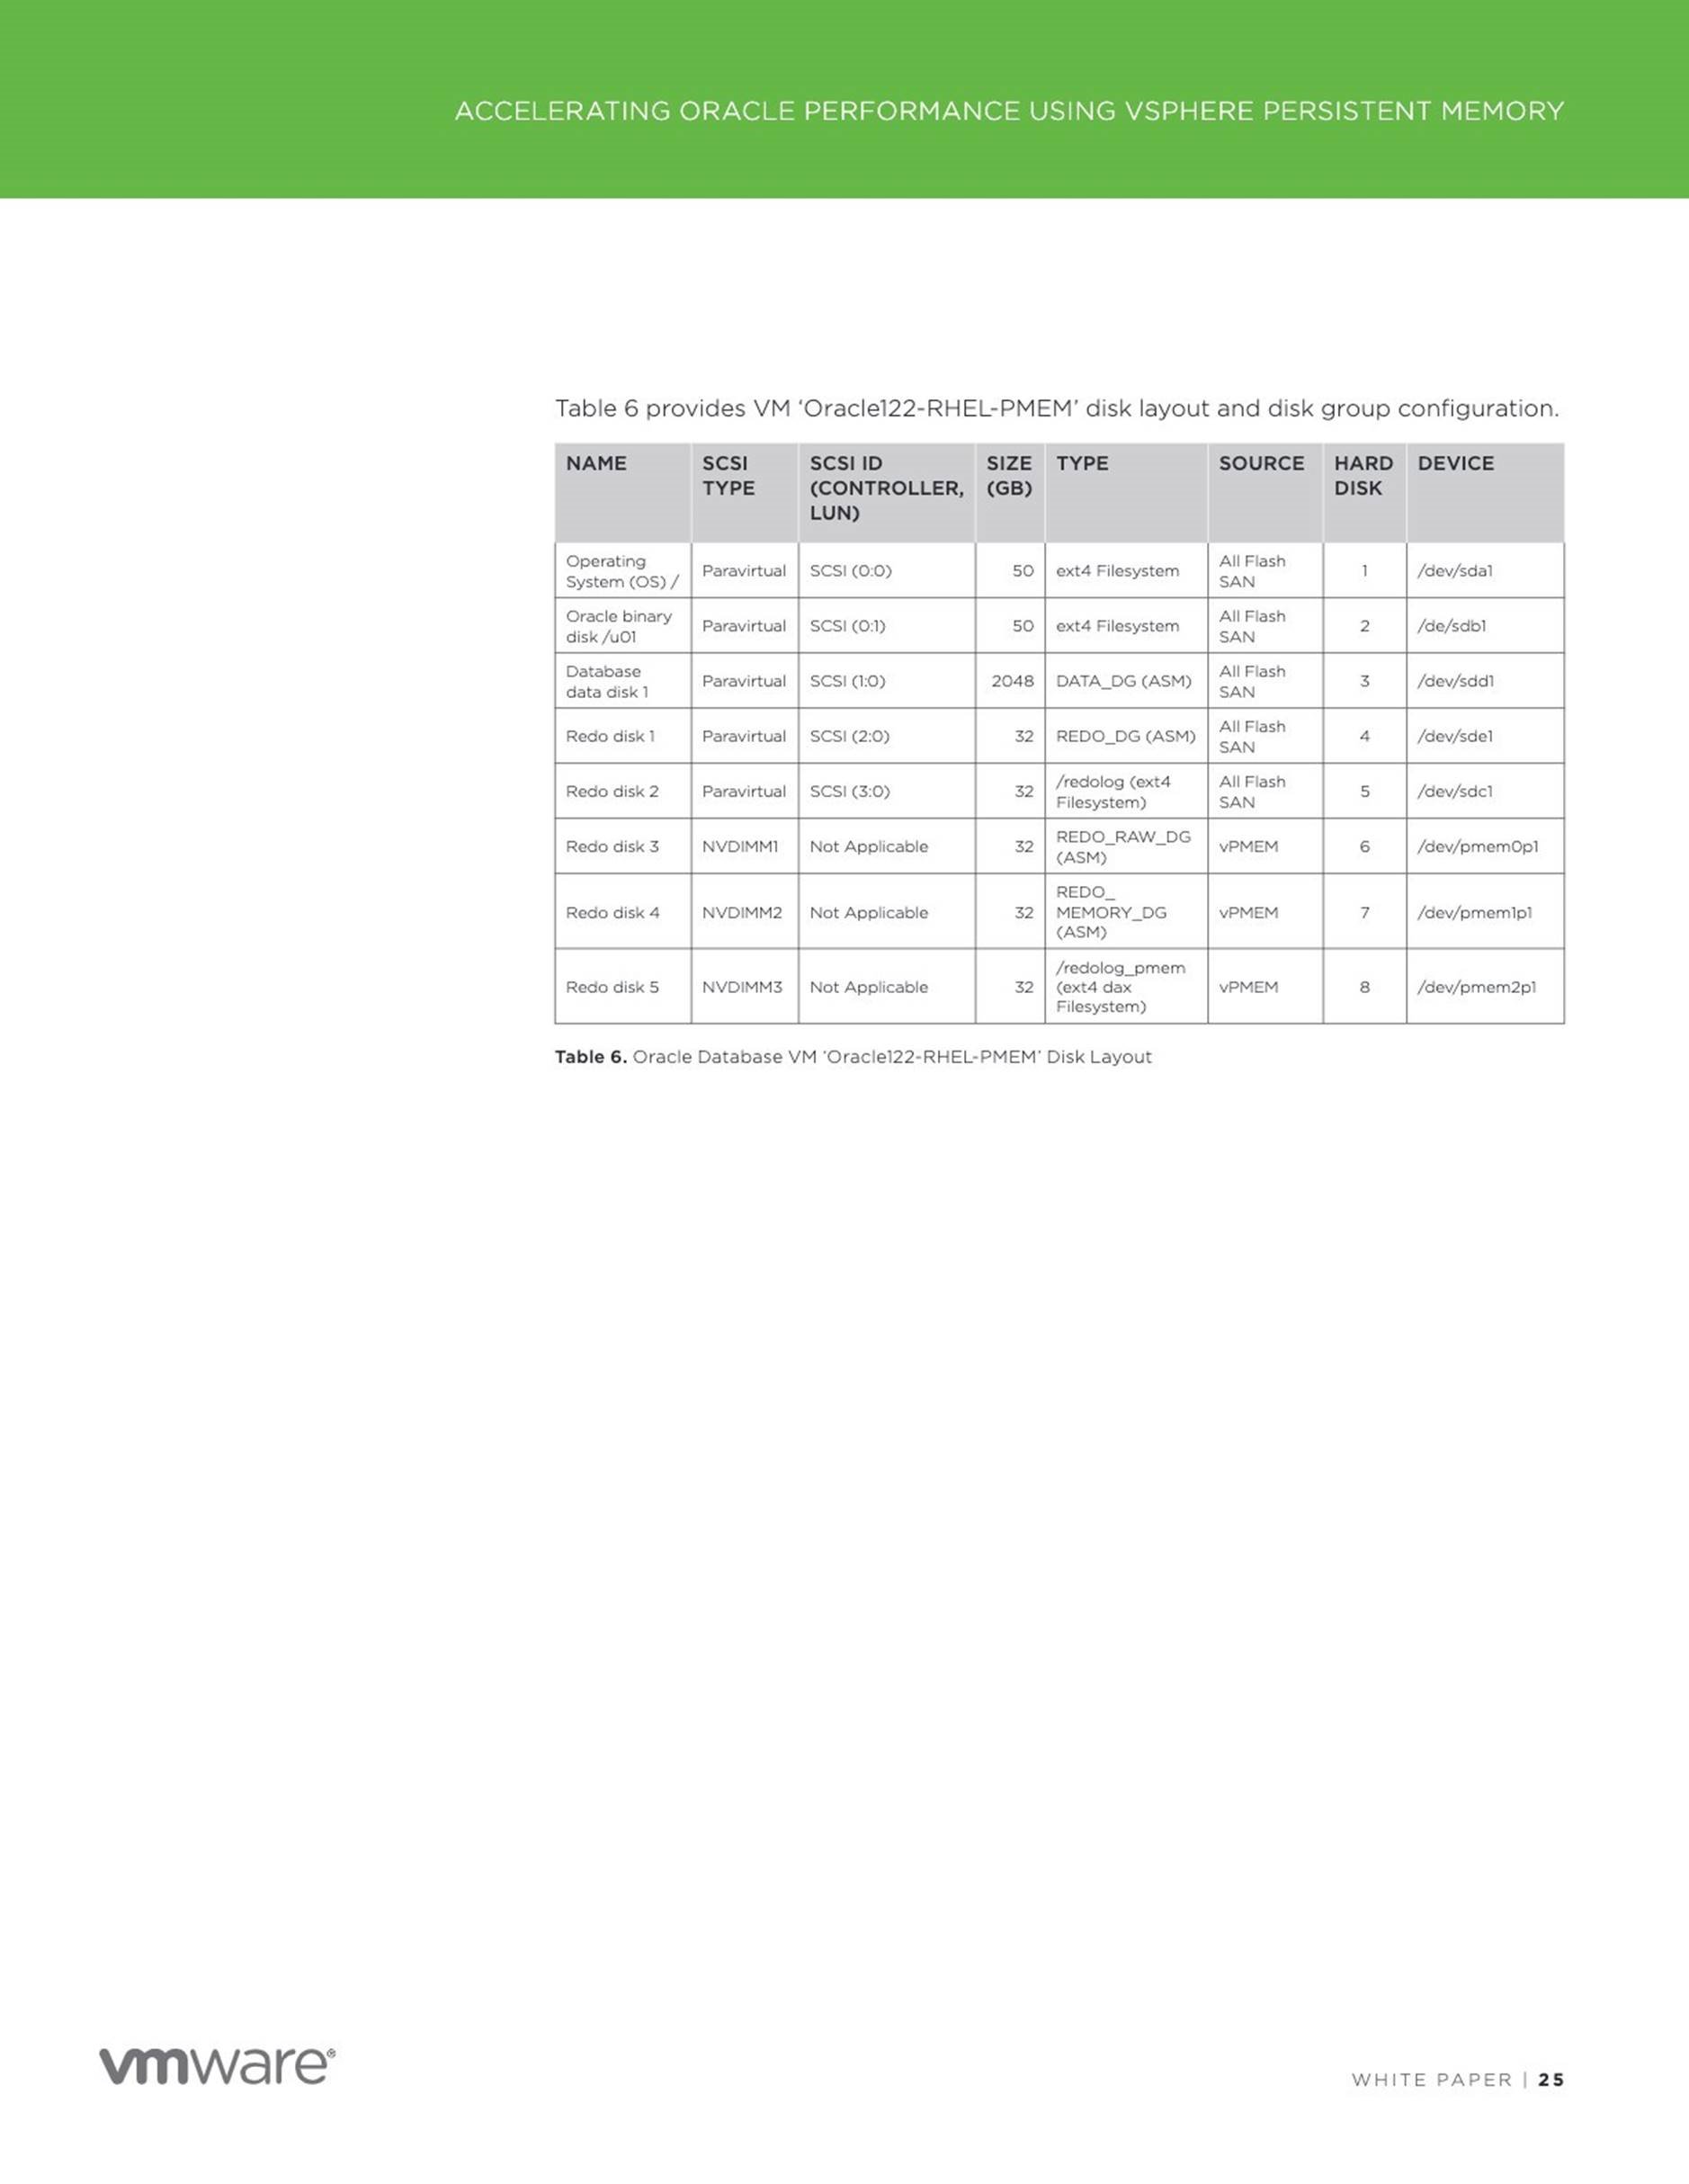
Oracle VM setup
As mentioned above, this blog will investigate if Persistent Memory can help with speeding up the crash recovery process of an Oracle database.
The Oracle VM ‘Oracle122-RHEL-PMEM-udev’ has 6 vCPUS with vRAM 32GB.
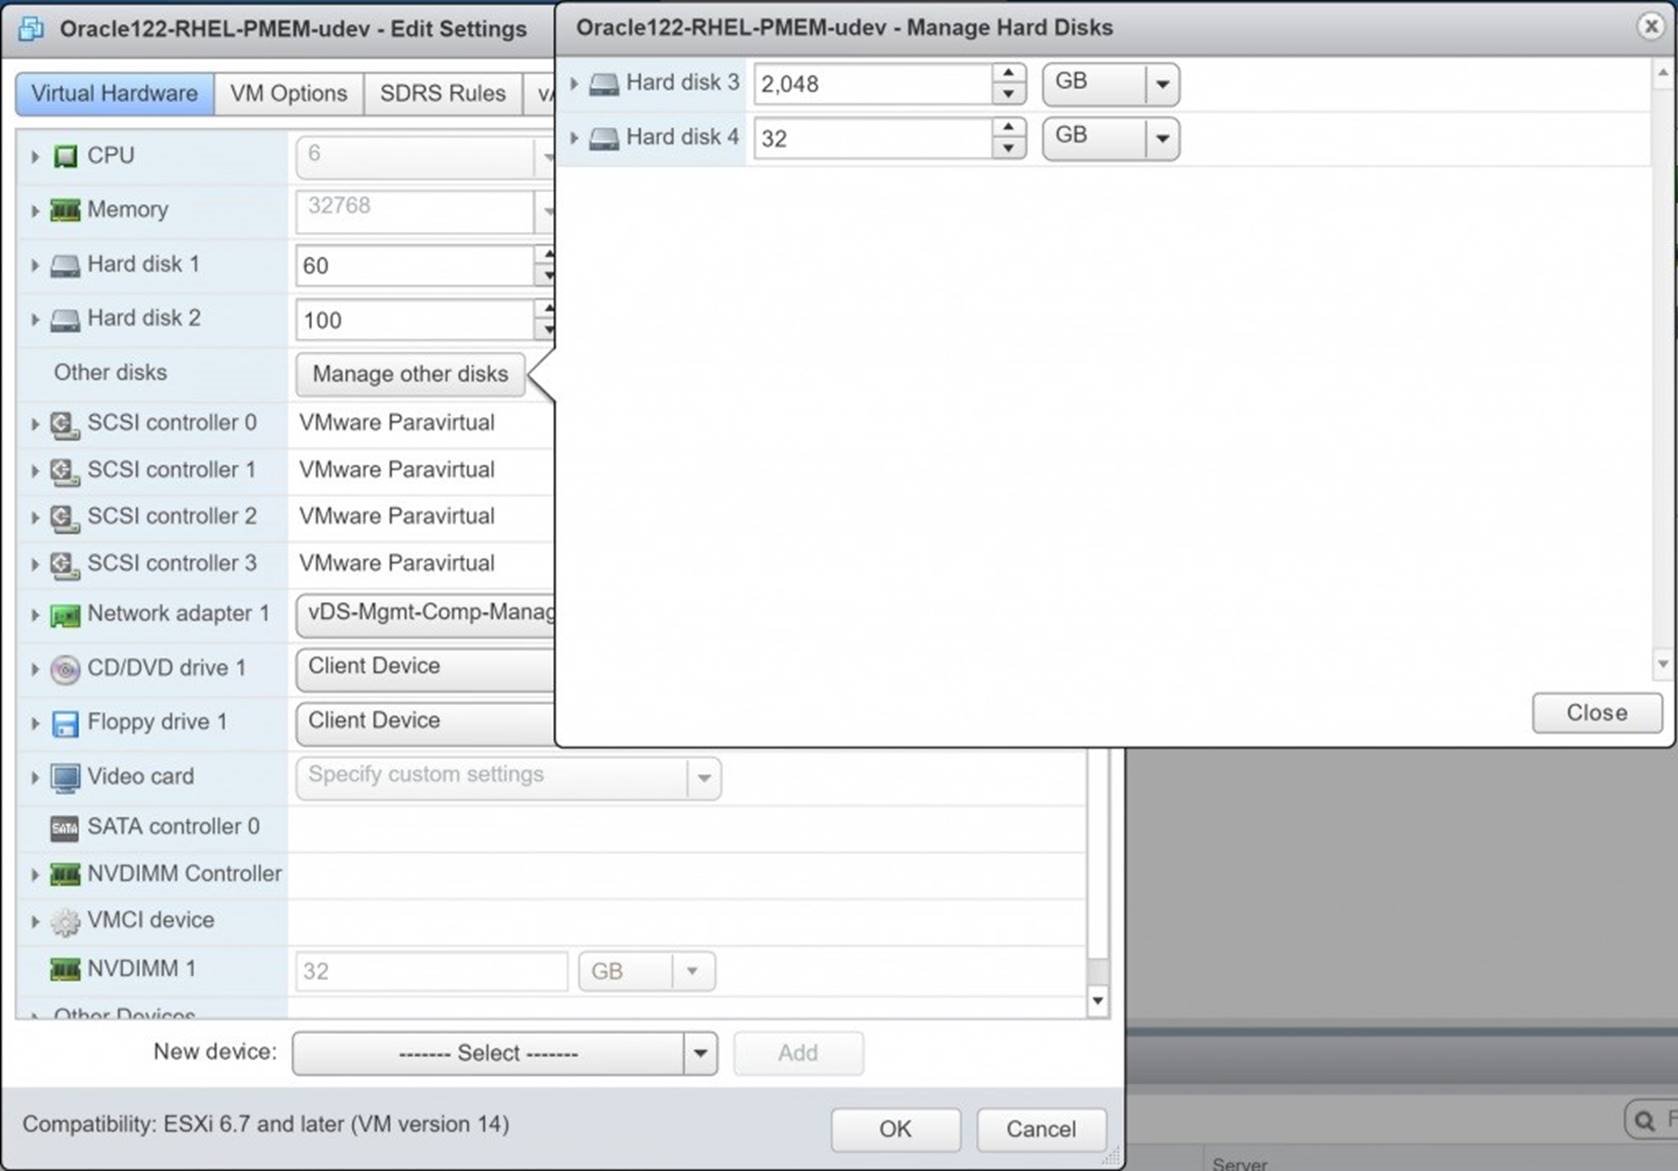
The 4 hard disks attached to the VM are as below –
![]() Hard Disk 1 – 60G – OS
Hard Disk 1 – 60G – OS
Hard Disk 2 – 100G – Oracle + Grid Infrastructure binaries
Hard Disk 3 – 2TB – Oracle Database datafiles
Hard Disk 4 – 32GB – Oracle Redo logs
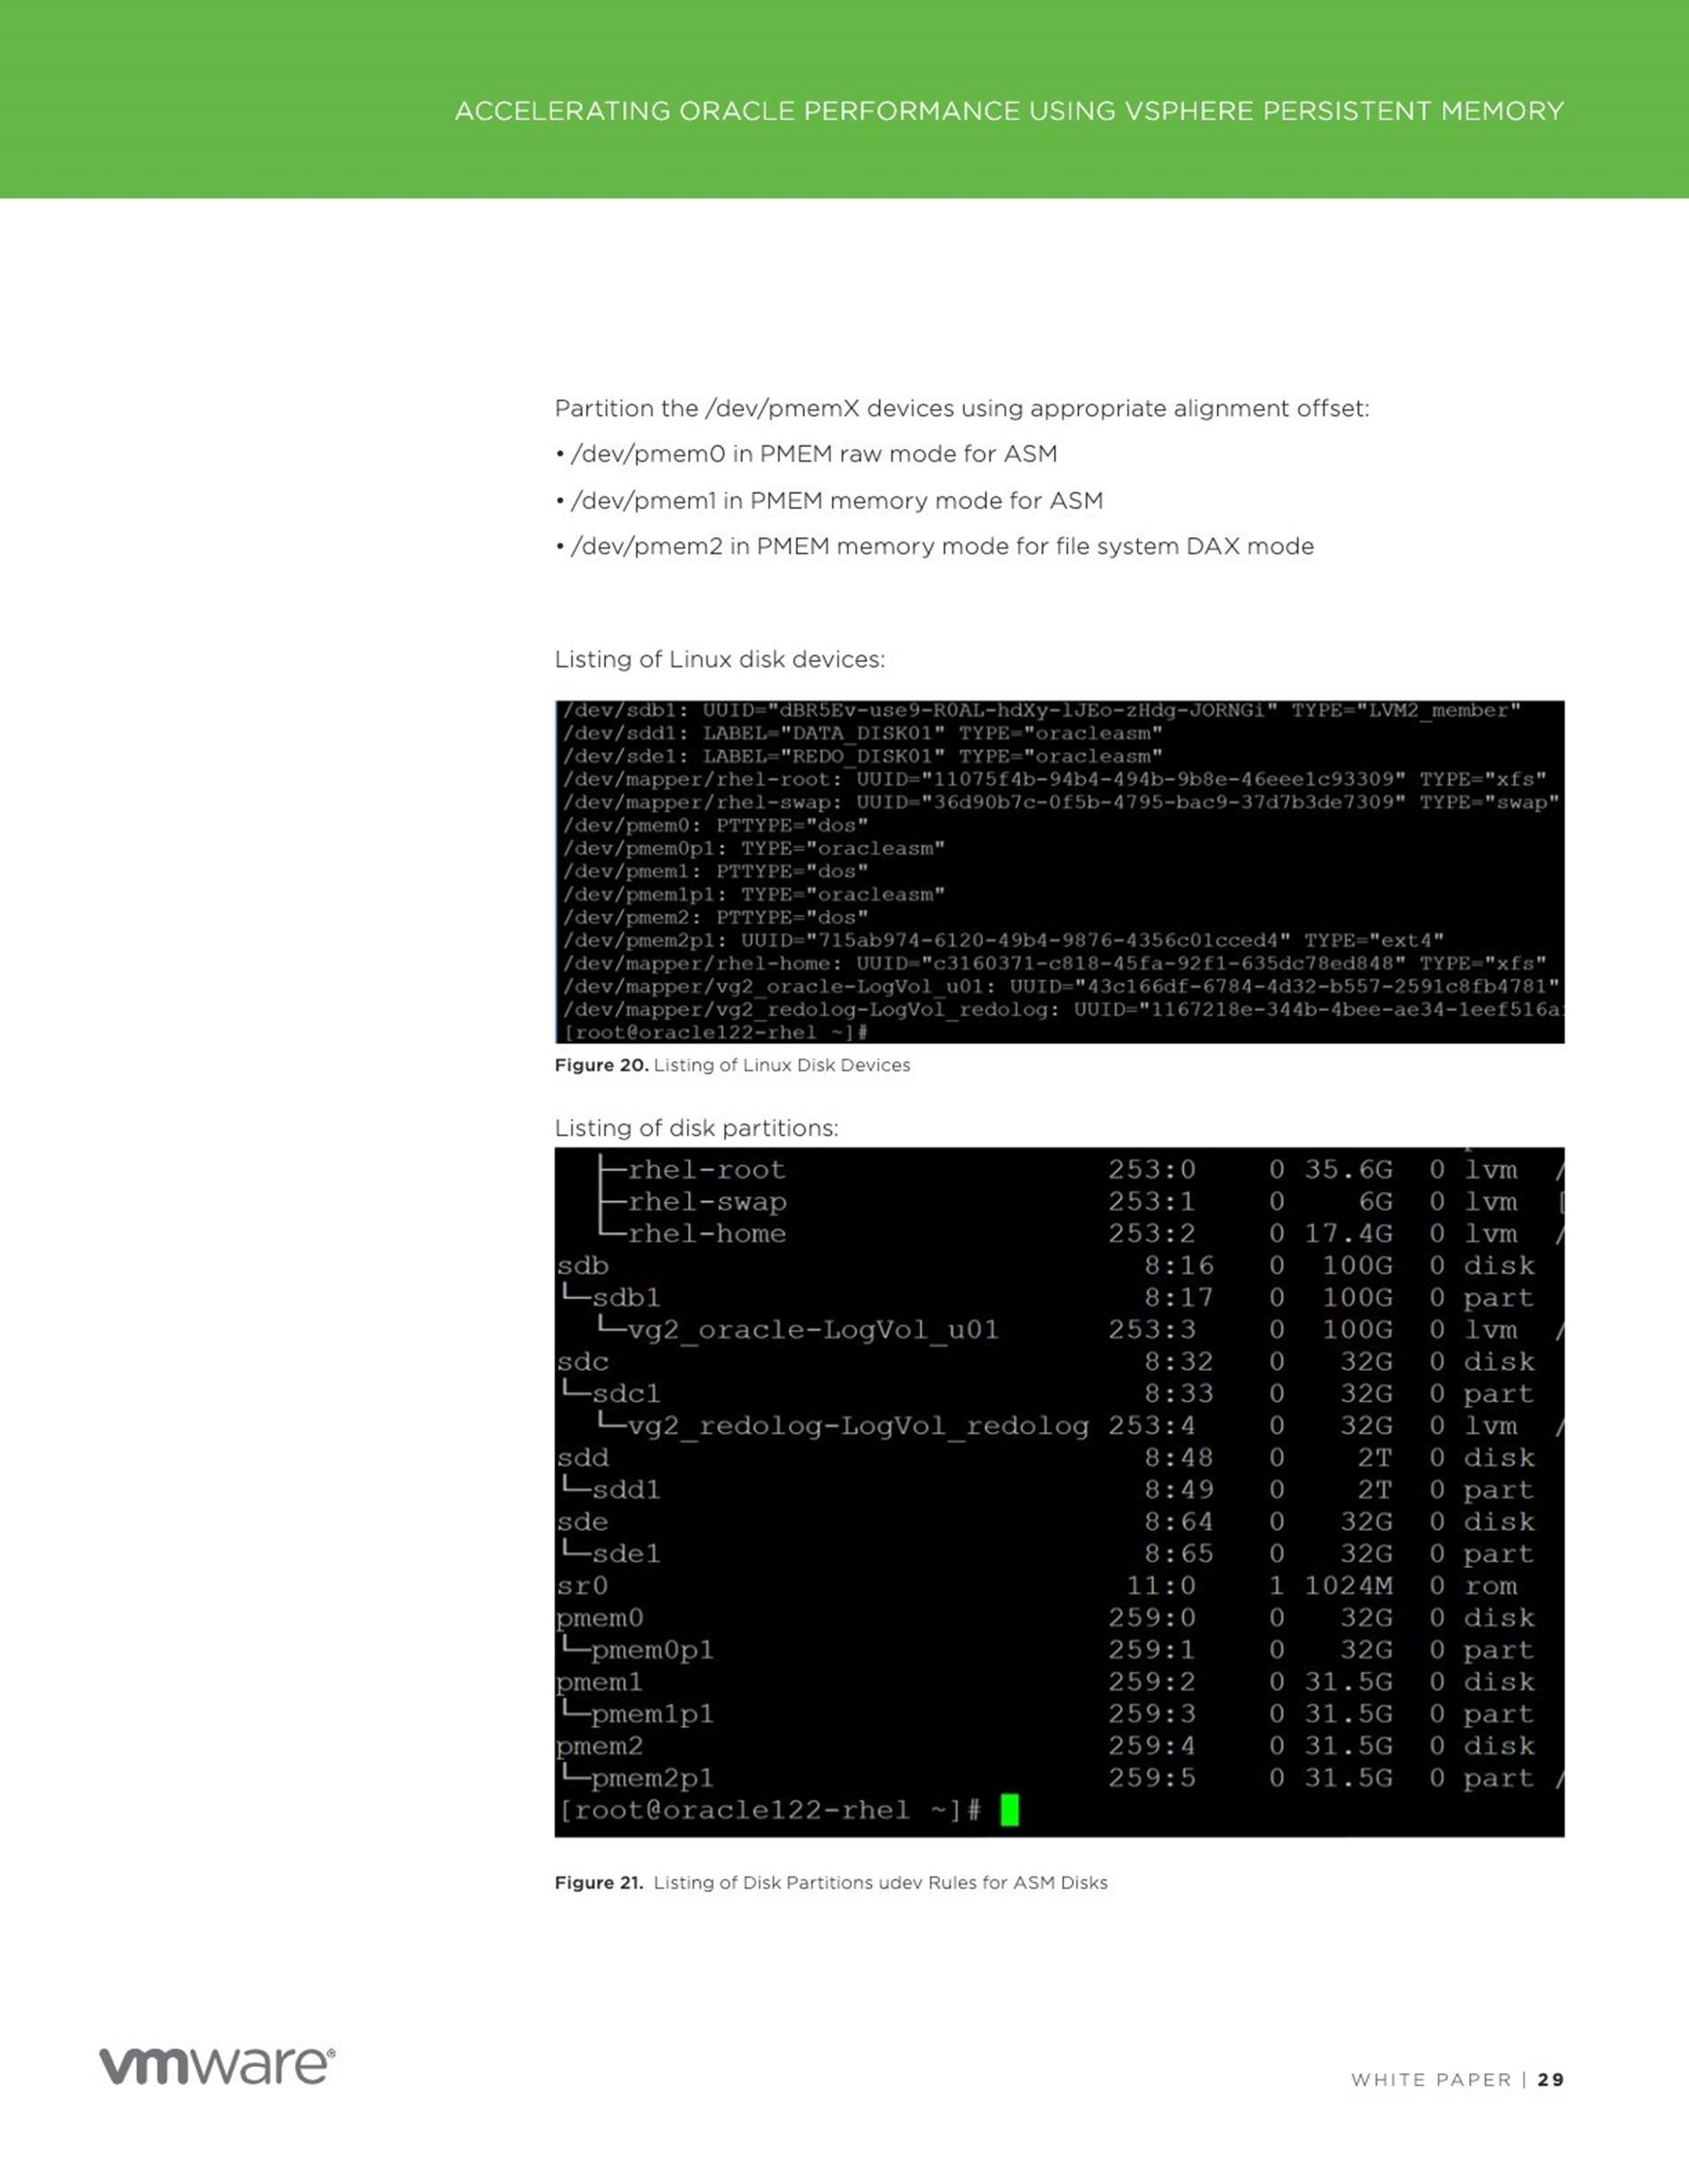
Below is the operating system view of the vmdk’s –
[root@oracle122-rhel ~]# fdisk -lu
Disk /dev/sdb: 107.4 GB, 107374182400 bytes, 209715200 sectors
Units = sectors of 1 * 512 = 512 bytes
Sector size (logical/physical): 512 bytes / 512 bytes
I/O size (minimum/optimal): 512 bytes / 512 bytes
Disk label type: dos
Disk identifier: 0x7783b7a1
Device Boot Start End Blocks Id System
/dev/sdb1 2048 209715199 104856576 83 Linux
Disk /dev/sdc: 2199.0 GB, 2199023255552 bytes, 4294967296 sectors
Units = sectors of 1 * 512 = 512 bytes
Sector size (logical/physical): 512 bytes / 512 bytes
I/O size (minimum/optimal): 512 bytes / 512 bytes
Disk label type: dos
Disk identifier: 0x7d28e830
Device Boot Start End Blocks Id System
/dev/sdc1 2048 4294967294 2147482623+ 83 Linux
Disk /dev/sdd: 34.4 GB, 34359738368 bytes, 67108864 sectors
Units = sectors of 1 * 512 = 512 bytes
Sector size (logical/physical): 512 bytes / 512 bytes
I/O size (minimum/optimal): 512 bytes / 512 bytes
Disk label type: dos
Disk identifier: 0x952fca2a
Device Boot Start End Blocks Id System
/dev/sdd1 2048 67108863 33553408 83 Linux
Disk /dev/sda: 64.4 GB, 64424509440 bytes, 125829120 sectors
Units = sectors of 1 * 512 = 512 bytes
Sector size (logical/physical): 512 bytes / 512 bytes
I/O size (minimum/optimal): 512 bytes / 512 bytes
Disk label type: dos
Disk identifier: 0x0004908d
Device Boot Start End Blocks Id System
/dev/sda1 * 2048 2099199 1048576 83 Linux
/dev/sda2 2099200 125829119 61864960 8e Linux LVM
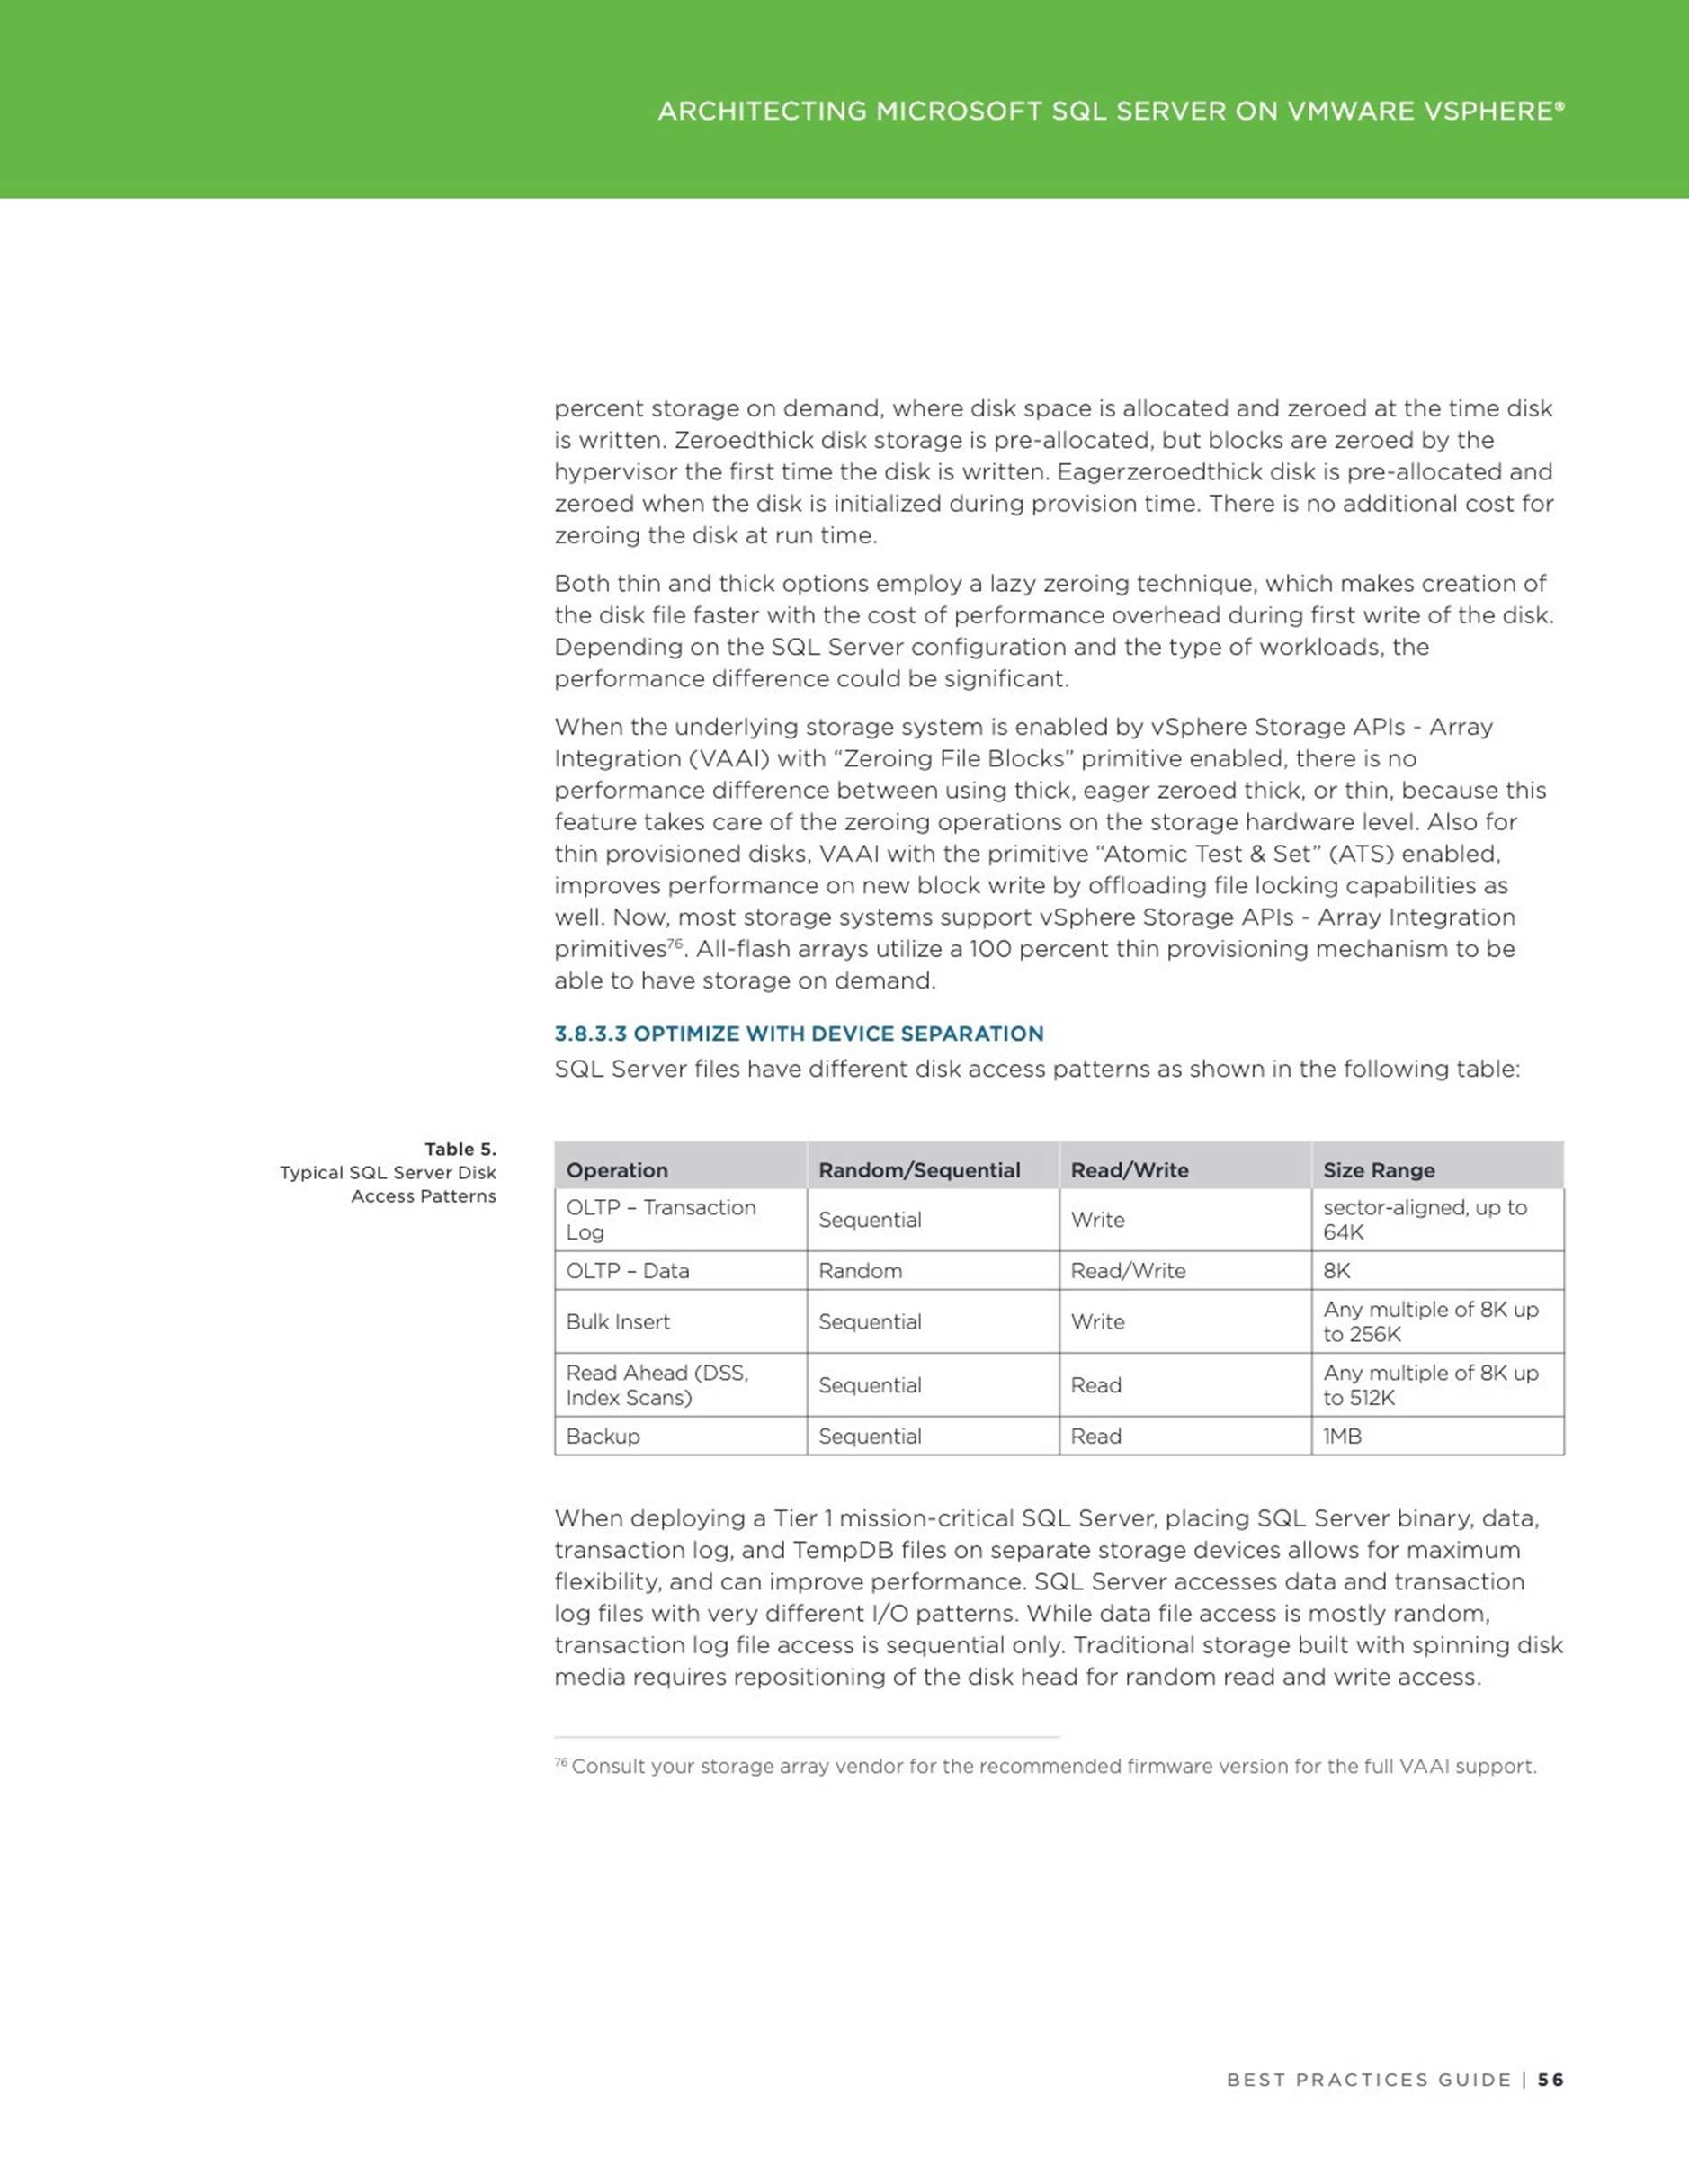
….
[root@oracle122-rhel ~]#
Components and Granules in the SGA
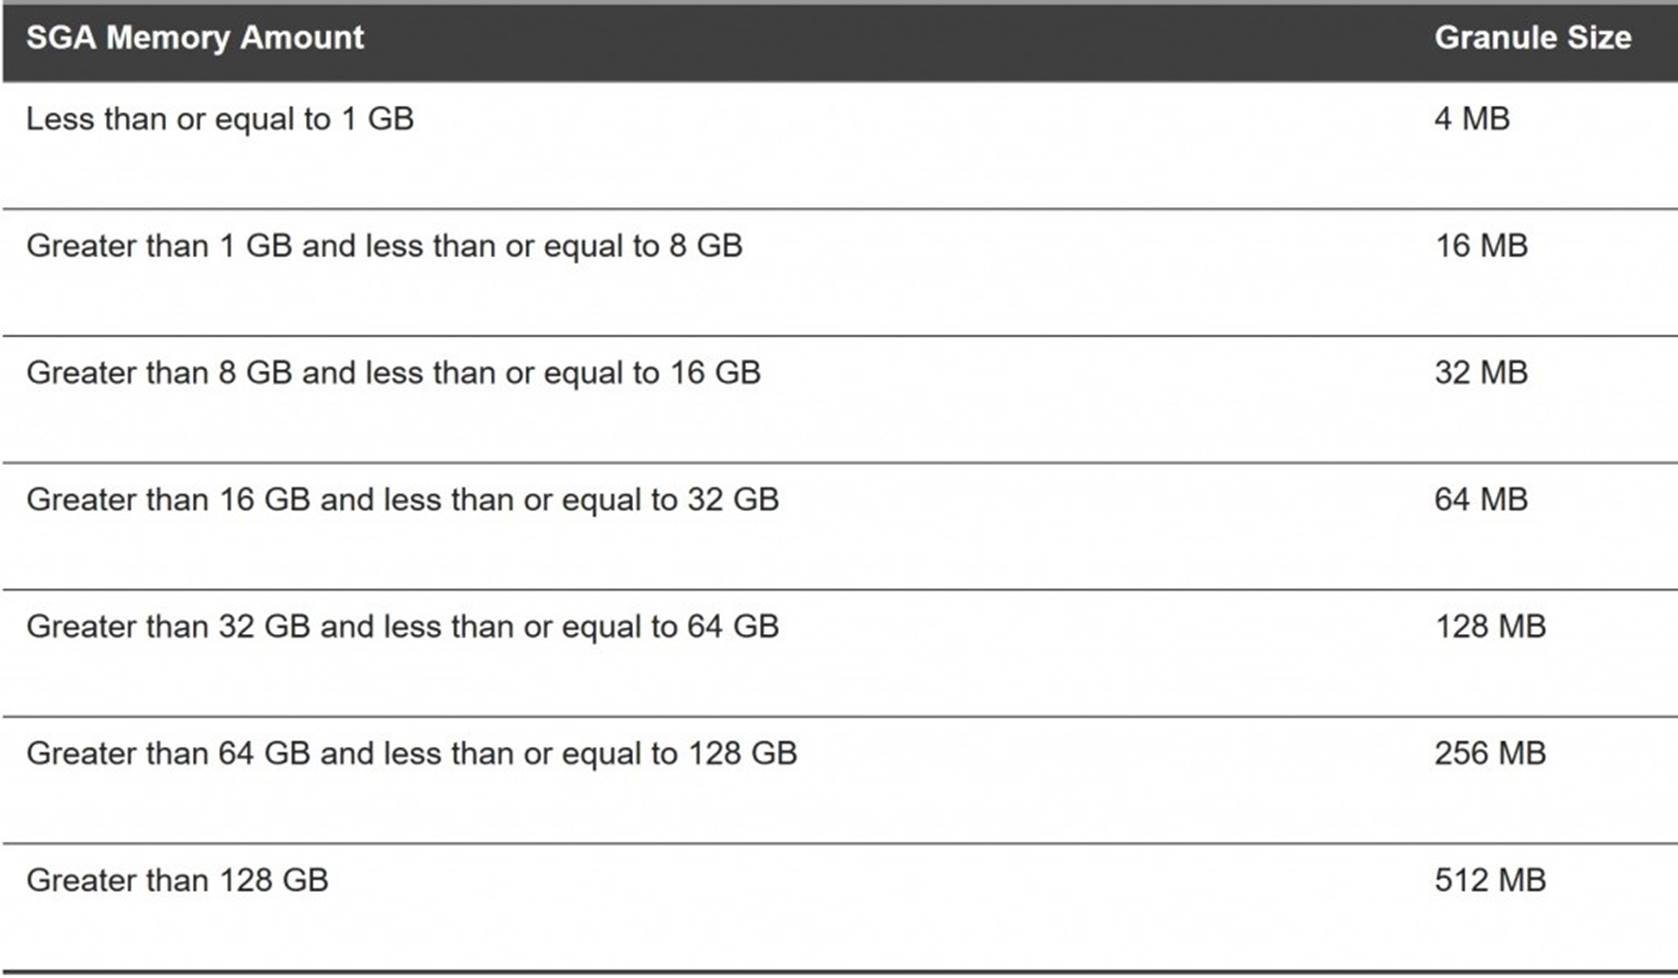
All SGA components allocate and deallocate space in units of granules. Oracle
Database tracks SGA memory use in internal numbers of granules for each SGA component.
The granule size is determined by the amount of SGA memory requested when the instance starts. Specifically, the granule size is based on the value of the SGA_MAX_SIZE initialization parameter.
The table below shows the SGA granule size.
Oracle Memory Management
The memory structures that must be managed are the system global area (SGA) and the instance program global area (instance PGA).
The 2 main memory management methods are :
![]() Automatic Memory Management (AMM) manage the SGA memory and instance PGA memory completely automatically. You designate only the total memory size to be used by the instance, and Oracle Database dynamically exchanges memory between the SGA and the instance PGA as needed to meet processing demands. This capability is referred to as automatic memory management. With this memory management method, the database also dynamically tunes the sizes of the individual SGA components and the sizes of the individual PGAs
Automatic Memory Management (AMM) manage the SGA memory and instance PGA memory completely automatically. You designate only the total memory size to be used by the instance, and Oracle Database dynamically exchanges memory between the SGA and the instance PGA as needed to meet processing demands. This capability is referred to as automatic memory management. With this memory management method, the database also dynamically tunes the sizes of the individual SGA components and the sizes of the individual PGAs
![]() Manual Memory Management – These methods are
Manual Memory Management – These methods are
Automatic shared memory management – for the SGA
Manual shared memory management – for the SGA
Automatic PGA memory management – for the instance PGA
Manual PGA memory management – for the instance PGA
To use the MEMORY_TARGET or MEMORY_MAX_TARGET feature, the /dev/shm mount point should be equal in size or larger than the value of MEMORY_TARGET or MEMORY_MAX_TARGET, whichever is larger.
For Automatic Memory Management (AMM) , the initialization parameters memory_target and memory_max_size are set to 16G.
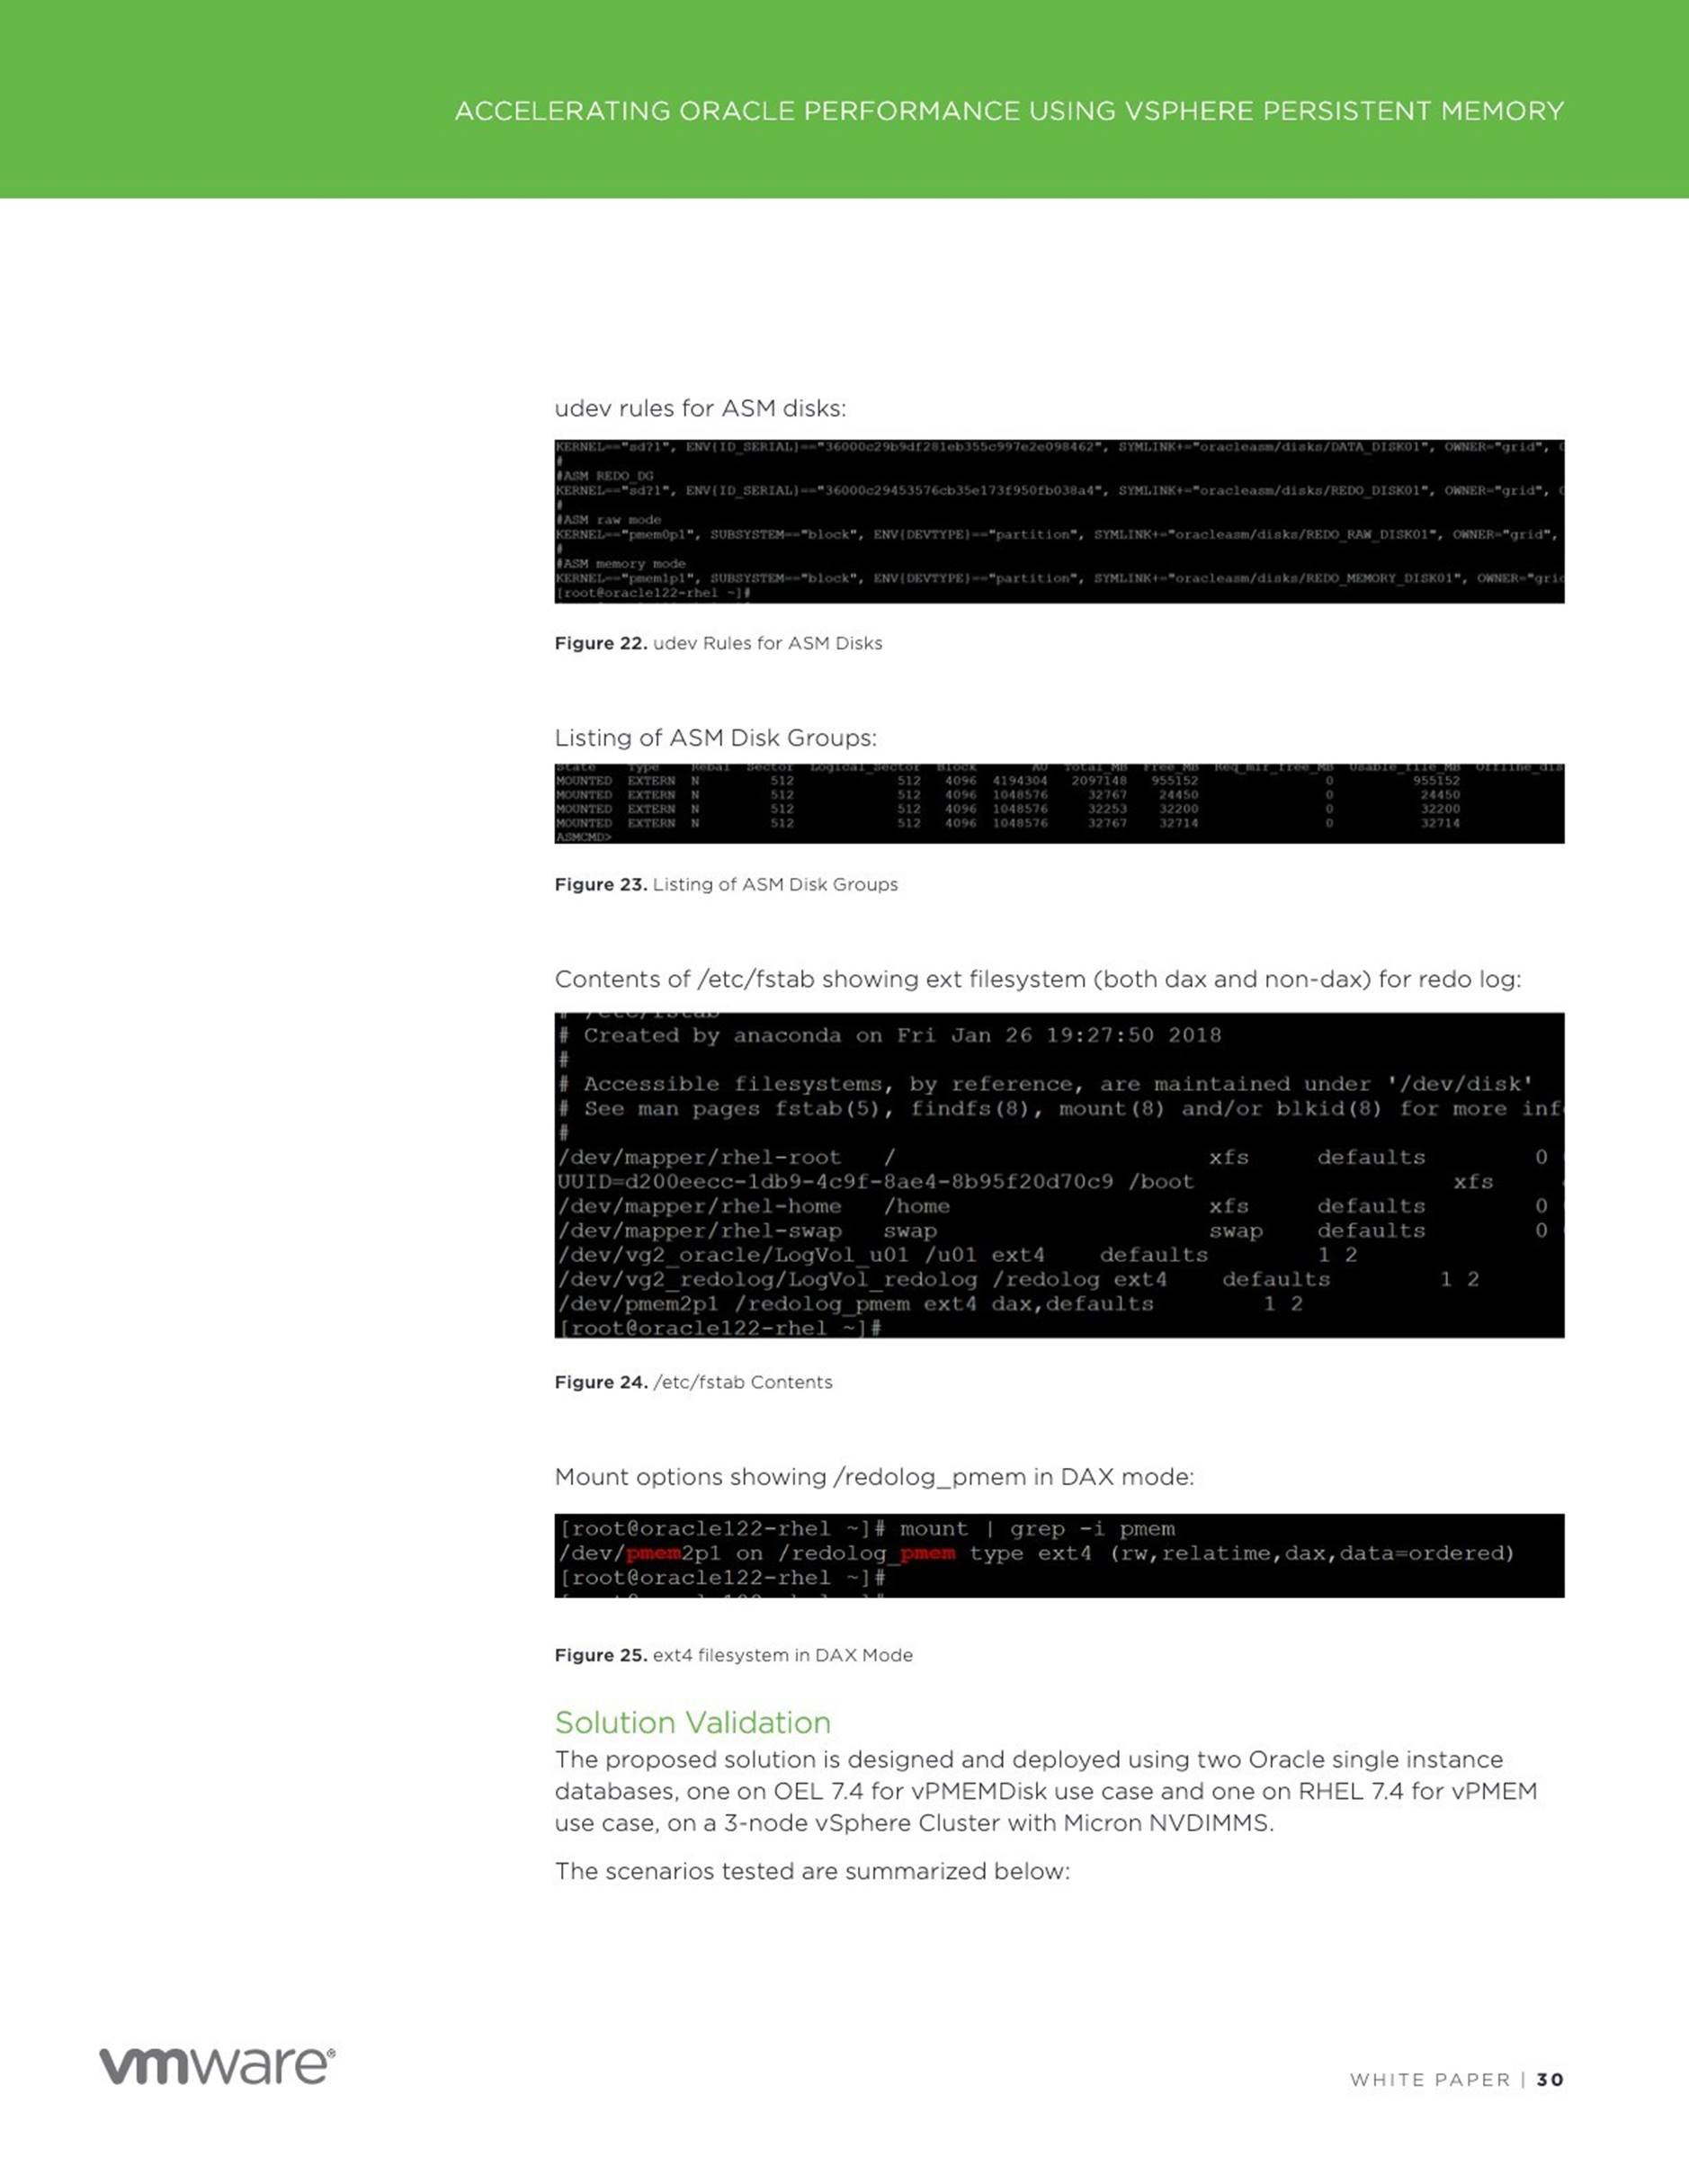
Contents of the /etc/fstab which shows the /dev/shm mount point –
oracle@oracle122-rhel:DBPROD:/home/oracle> cat /etc/fstab
#
# /etc/fstab
# Created by anaconda on Fri Jan 26 19:27:50 2018
#
# Accessible filesystems, by reference, are maintained under ‘/dev/disk’
# See man pages fstab(5), findfs(8), mount(8) and/or blkid(8) for more info
#
/dev/mapper/rhel-root / xfs defaults 0 0
UUID=d200eecc-1db9-4c9f-8ae4-8b95f20d70c9 /boot xfs defaults 0 0
/dev/mapper/rhel-home /home xfs defaults 0 0
/dev/mapper/rhel-swap swap swap defaults 0 0
/dev/vg2_oracle/LogVol_u01 /u01 ext4 defaults 1 2
#/dev/pmem1 /redolog ext4 dax,defaults 1 2 #/dev/pmem2 /redolog_dax ext4 dax,defaults 1 2
shmfs /dev/shm tmpfs size=24g 0 oracle@oracle122-rhel:DBPROD:/home/oracle>
Test Scenario and Steps
We have 2 Test scenarios –
![]() Oracle Crash Recovery using AMM Memory Management without
Oracle Crash Recovery using AMM Memory Management without
Persistent Memory
Oracle Crash Recovery using AMM Memory Management with Persistent
Memory
The Test steps are to –
![]() Run a SLOB workload , which is an Oracle I/O workload generation tool kit, against the database for 5 minutes
Run a SLOB workload , which is an Oracle I/O workload generation tool kit, against the database for 5 minutes
Within 3 minutes into the load, shutdown the database via a ‘shutdown abort’ command, mimicking an abnormal database failure or a database crash
![]() Restarting the database will result in a crash recovery of the database thread and the recovery time would be recorded for each of the above test scenarios
Restarting the database will result in a crash recovery of the database thread and the recovery time would be recorded for each of the above test scenarios
![]() Compare the recovery time for each of the above scenario
Compare the recovery time for each of the above scenario
Oracle Crash Recovery using AMM Memory Management without
Persistent Memory
Output of /proc/meminfo to show the VM memory total :
oracle@oracle122-rhel:DBPROD:/home/oracle> cat /proc/meminfo
MemTotal: 32781052 kB MemFree: 19212424 kB
MemAvailable: 20514972 kB
Buffers: 108464 kB
Cached: 12110000 kB
SwapCached: 0 kB
Active: 11939808 kB
Inactive: 1126292 kB
Active(anon): 11539540 kB Inactive(anon): 65204 kB
Active(file): 400268 kB
Inactive(file): 1061088 kB
Unevictable: 0 kB
Mlocked: 0 kB
SwapTotal: 6291452 kB
SwapFree: 6291452 kB
Dirty: 100 kB
Writeback: 0 kB
AnonPages: 847652 kB
Mapped: 1327056 kB
Shmem: 10757112 kB
Slab: 123280 kB
SReclaimable: 65332 kB
SUnreclaim: 57948 kB
KernelStack: 8000 kB
PageTables: 94676 kB
NFS_Unstable: 0 kB
Bounce: 0 kB
WritebackTmp: 0 kB
CommitLimit: 22681976 kB
Committed_AS: 12997260 kB
VmallocTotal: 34359738367 kB
VmallocUsed: 33760788 kB
VmallocChunk: 34325131260 kB
HardwareCorrupted: 0 kB
AnonHugePages: 0 kB
CmaTotal: 0 kB
CmaFree: 0 kB
HugePages_Total: 0
HugePages_Free: 0
HugePages_Rsvd: 0
HugePages_Surp: 0
Hugepagesize: 2048 kB
DirectMap4k: 173952 kB
DirectMap2M: 5068800 kB DirectMap1G: 30408704 kB oracle@oracle122-rhel:DBPROD:/home/oracle>
output of df command to show /dev/shm filesystem size
oracle@oracle122-rhel:DBPROD:/home/oracle> df -h
Filesystem Size Used Avail Use% Mounted on /dev/mapper/rhel-root 36G 2.3G 34G 7% / devtmpfs 16G 0 16G 0% /dev tmpfs 24G 11G 14G 43% /dev/shm tmpfs 16G 9.0M 16G 1% /run tmpfs 16G 0 16G 0% /sys/fs/cgroup
/dev/sda1 1014M 223M 792M 22% /boot
/dev/mapper/rhel-home 18G 4.0G 14G 23% /home
/dev/mapper/vg2_oracle-LogVol_u01 99G 31G 64G 33% /u01 tmpfs 3.2G 0 3.2G 0% /run/user/501 tmpfs 3.2G 0 3.2G 0% /run/user/0 oracle@oracle122-rhel:DBPROD:/home/oracle>
List the contents of the /dev/shm file system. As we can see from the above
Granules table, the SGA & PGA for database was set to 16GB and hence the SGA granule size is 32MB.
The ASM instance memory footprint is close to 32MB and hence the granule size is MB for the ASM instance.
oracle@oracle122-rhel:DBPROD:/home/oracle> ls -l /dev/shm
total 10747904
-rw——- 1 grid oinstall 4194304 Nov 23 08:39 ora_+ASM_32769_0
-rw——- 1 grid oinstall 4194304 Nov 22 18:52 ora_+ASM_32769_1 -rw——- 1 grid oinstall 4194304 Nov 22 18:52 ora_+ASM_32769_2 …..
-rw——- 1 grid oinstall 4194304 Nov 23 08:39 ora_+ASM_65536_114 -rw——- 1 grid oinstall 4194304 Nov 22 18:52 ora_+ASM_65536_115
….
-rw——- 1 grid oinstall 0 Nov 22 18:52 ora_+ASM_65536_157
-rw——- 1 grid oinstall 0 Nov 22 18:52 ora_+ASM_65536_158
-rw——- 1 grid oinstall 0 Nov 22 18:52 ora_+ASM_65536_159
-rw——- 1 grid oinstall 4194304 Nov 22 18:52 ora_+ASM_65536_16
-rw——- 1 grid oinstall 0 Nov 22 18:52 ora_+ASM_65536_160
-rw——- 1 grid oinstall 0 Nov 22 18:52 ora_+ASM_65536_161 -rw——- 1 grid oinstall 0 Nov 22 18:52 ora_+ASM_65536_162
…
-rw——- 1 oracle asmadmin 33554432 Nov 23 08:33 ora_DBPROD_294916_50
-rw——- 1 oracle asmadmin 0 Nov 23 08:32 ora_DBPROD_294916_500
-rw——- 1 oracle asmadmin 0 Nov 23 08:32 ora_DBPROD_294916_501
-rw——- 1 oracle asmadmin 0 Nov 23 08:32 ora_DBPROD_294916_502 -rw——- 1 oracle asmadmin 0 Nov 23 08:32 ora_DBPROD_294916_503
…..
-rw——- 1 oracle asmadmin 33554432 Nov 23 08:33 ora_DBPROD_294916_56
….
-rw——- 1 oracle asmadmin 33554432 Nov 23 08:33 ora_DBPROD_294916_59 oracle@oracle122-rhel:DBPROD:/home/oracle>
Start the SLOB workload against the Oracle database using command
‘/u01/software/SLOB/SLOB/runit.sh -s 1 -t 100’
oracle@oracle122-rhel:DBPROD:/home/oracle>
/u01/software/SLOB/SLOB/runit.sh -s 1 -t 100
Before AWR
SQL*Plus: Release 12.2.0.1.0 Production on Fri Nov 23 08:49:06 2018
Copyright (c) 1982, 2016, Oracle. All rights reserved.
SQL> Connected.
SQL>
PL/SQL procedure successfully completed.
SQL> Disconnected from Oracle Database 12c Enterprise Edition Release
12.2.0.1.0 – 64bit Production
SLOB started with 1 users
/u01/software/SLOB/SLOB/runit.sh: line 2: !/bin/bash: No such file or directory
NOTIFY : 2018.11.23-08:49:08 : For security purposes all file and directory creation and deletions
NOTIFY : 2018.11.23-08:49:08 : performed by
/u01/software/SLOB/SLOB/runit.sh are logged in:
/u01/software/SLOB/SLOB/.file_operations_audit_trail.out.
NOTIFY : 2018.11.23-08:49:08 : SLOB TEMPDIR is
/tmp/.SLOB.2018.11.23.084908. SLOB will delete this directory at the end of this execution.
NOTIFY : 2018.11.23-08:49:08 : Sourcing in slob.conf
NOTIFY : 2018.11.23-08:49:08 : Performing initial slob.conf sanity check…
NOTIFY : 2018.11.23-08:49:08 :
NOTIFY : 2018.11.23-08:49:08 : All SLOB sessions will connect to
DBPROD_PMEM_RHEL_PDB1 via SQL*Net.
NOTIFY : 2018.11.23-08:49:08 : Connecting to the instance to validate slob.conf->SCALE setting.
UPDATE_PCT: 100
SCAN_PCT: 0
RUN_TIME: 300
WORK_LOOP: 0
SCALE: 28G (3670016 blocks)
WORK_UNIT: 64
REDO_STRESS: HEAVY
HOT_SCHEMA_FREQUENCY: 0
HOTSPOT_MB: 8
HOTSPOT_OFFSET_MB: 16
HOTSPOT_FREQUENCY: 3
THINK_TM_FREQUENCY: 0
THINK_TM_MIN: .1
THINK_TM_MAX: .5
DATABASE_STATISTICS_TYPE: awr
SYSDBA_PASSWD: “vmware123”
DBA_PRIV_USER: “sys”
ADMIN_SQLNET_SERVICE: “DBPROD_PMEM_RHEL_PDB1”
SQLNET_SERVICE_BASE: “DBPROD_PMEM_RHEL_PDB1”
SQLNET_SERVICE_MAX: “”
EXTERNAL_SCRIPT: “”
THREADS_PER_SCHEMA: 100 (-t option)
Note: runit.sh will use the following connect strings as per slob.conf settings:
Admin Connect String: “sys/vmware123@DBPROD_PMEM_RHEL_PDB1 as sysdba”
NOTIFY : 2018.11.23-08:49:09 : Clearing temporary SLOB output files from previous SLOB testing.
NOTIFY : 2018.11.23-08:49:09 : Testing admin connectivity to the instance to validate slob.conf settings.
NOTIFY : 2018.11.23-08:49:09 : Testing connectivity. Command: “sqlplus -L sys/vmware123@DBPROD_PMEM_RHEL_PDB1 as sysdba”.
NOTIFY : 2018.11.23-08:49:09 : Next, testing 1 user (non-admin) connections…
NOTIFY : 2018.11.23-08:49:09 : Testing connectivity. Command: “sqlplus -L
user1/user1@DBPROD_PMEM_RHEL_PDB1”.
NOTIFY : 2018.11.23-08:49:09 : Performing redo log switch.
NOTIFY : 2018.11.23-08:49:09 : Redo log switch complete. Setting up trigger mechanism.
NOTIFY : 2018.11.23-08:49:19 : Running iostat, vmstat and mpstat on current host–in background.
NOTIFY : 2018.11.23-08:49:19 : Connecting 100 (THREADS_PER_SCHEMA) session(s) to 1 schema(s) …
NOTIFY : 2018.11.23-08:49:22 :
NOTIFY : 2018.11.23-08:49:22 : Executing awr “before snap” procedure.
Command: “sqlplus -S -L sys/vmware123@DBPROD_PMEM_RHEL_PDB1 as sysdba”.
NOTIFY : 2018.11.23-08:49:23 : Before awr snap ID is 1218
NOTIFY : 2018.11.23-08:49:23 :
NOTIFY : 2018.11.23-08:49:23 : Test has been triggered. Processes are executing.
NOTIFY : 2018.11.23-08:49:23 : List of monitored sqlplus PIDs written to /tmp/.SLOB.2018.11.23.084908/8583.f_wait_pids.out.
NOTIFY : 2018.11.23-08:49:34 : Waiting for 287 seconds before monitoring running processes (for exit).
^C oracle@oracle122-rhel:DBPROD:/home/oracle>
Run ‘shutdown abort’ against database to simulate a crash at 3 minutes into the load.
oracle@oracle122-rhel:DBPROD:/home/oracle> date
Fri Nov 23 08:52:21 PST 2018
oracle@oracle122-rhel:DBPROD:/home/oracle> ./stop_db_abort SQL*Plus: Release 12.2.0.1.0 Production on Fri Nov 23 08:52:27 2018
Copyright (c) 1982, 2016, Oracle. All rights reserved.
SQL> Connected.
SQL> ORACLE instance shut down.
SQL> Disconnected from Oracle Database 12c Enterprise Edition Release
12.2.0.1.0 – 64bit Production oracle@oracle122-rhel:DBPROD:/home/oracle>
Restart the Oracle database which prompts Oracle to perform crash recovery of the thread.
Observe the database alert log file to see the crash recovery progress.
oracle@oracle122rhel:DBPROD:/u01/admin/DBPROD/diag/rdbms/dbprod/DBPROD/trace> tail
-f alert_DBPROD.log
2018-11-23T08:52:27.264745-08:00
Shutting down instance (abort) (OS id: 994)
License high water mark = 105
2018-11-23T08:52:27.265146-08:00
USER (ospid: 994): terminating the instance
2018-11-23T08:52:28.276572-08:00
Instance terminated by USER, pid = 994
2018-11-23T08:52:29.094544-08:00
Instance shutdown complete (OS id: 994)
…
2018-11-23T08:56:01.276626-08:00 Completed redo scan read 3122163 KB redo, 683839 data blocks need recovery
2018-11-23T08:56:06.017712-08:00
…
2018-11-23T08:56:08.955533-08:00
Started redo application at
Thread 1: logseq 10505, block 48777, offset 0
2018-11-23T08:56:08.960895-08:00
Recovery of Online Redo Log: Thread 1 Group 4 Seq 10505 Reading mem 0
Mem# 0: +REDO_DG/DBPROD/group04_redo01.log Mem# 1: +REDO_DG/DBPROD/group04_redo02.log
2018-11-23T08:56:09.522910-08:00
Recovery of Online Redo Log: Thread 1 Group 5 Seq 10506 Reading mem 0
Mem# 0: +REDO_DG/DBPROD/group05_redo01.log
Mem# 1: +REDO_DG/DBPROD/group05_redo02.log
2018-11-23T08:56:10.128741-08:00
Recovery of Online Redo Log: Thread 1 Group 6 Seq 10507 Reading mem 0
Mem# 0: +REDO_DG/DBPROD/group06_redo01.log
Mem# 1: +REDO_DG/DBPROD/group06_redo02.log
2018-11-23T08:56:10.736250-08:00
Recovery of Online Redo Log: Thread 1 Group 7 Seq 10508 Reading mem 0
Mem# 0: +REDO_DG/DBPROD/group07_redo01.log
Mem# 1: +REDO_DG/DBPROD/group07_redo02.log
2018-11-23T08:56:11.354438-08:00
Recovery of Online Redo Log: Thread 1 Group 8 Seq 10509 Reading mem 0
Mem# 0: +REDO_DG/DBPROD/group08_redo01.log
Mem# 1: +REDO_DG/DBPROD/group08_redo02.log
2018-11-23T08:56:11.963102-08:00
Recovery of Online Redo Log: Thread 1 Group 9 Seq 10510 Reading mem 0
Mem# 0: +REDO_DG/DBPROD/group09_redo01.log
Mem# 1: +REDO_DG/DBPROD/group09_redo02.log
2018-11-23T08:56:12.575632-08:00
Recovery of Online Redo Log: Thread 1 Group 10 Seq 10511 Reading mem 0
Mem# 0: +REDO_DG/DBPROD/group10_redo01.log
Mem# 1: +REDO_DG/DBPROD/group10_redo02.log
2018-11-23T08:56:13.196423-08:00
Recovery of Online Redo Log: Thread 1 Group 11 Seq 10512 Reading mem 0
Mem# 0: +REDO_DG/DBPROD/group11_redo01.log
Mem# 1: +REDO_DG/DBPROD/group11_redo02.log
2018-11-23T08:56:13.855567-08:00
Recovery of Online Redo Log: Thread 1 Group 12 Seq 10513 Reading mem 0
Mem# 0: +REDO_DG/DBPROD/group12_redo01.log
Mem# 1: +REDO_DG/DBPROD/group12_redo02.log
2018-11-23T08:56:14.533012-08:00
Recovery of Online Redo Log: Thread 1 Group 13 Seq 10514 Reading mem 0
Mem# 0: +REDO_DG/DBPROD/group13_redo01.log
Mem# 1: +REDO_DG/DBPROD/group13_redo02.log
2018-11-23T08:56:15.210285-08:00
Recovery of Online Redo Log: Thread 1 Group 14 Seq 10515 Reading mem 0
Mem# 0: +REDO_DG/DBPROD/group14_redo01.log
Mem# 1: +REDO_DG/DBPROD/group14_redo02.log
2018-11-23T08:56:15.899655-08:00
Recovery of Online Redo Log: Thread 1 Group 15 Seq 10516 Reading mem 0 Mem# 0: +REDO_DG/DBPROD/group15_redo01.log Mem# 1: +REDO_DG/DBPROD/group15_redo02.log
2018-11-23T08:56:16.605822-08:00
Recovery of Online Redo Log: Thread 1 Group 16 Seq 10517 Reading mem 0
Mem# 0: +REDO_DG/DBPROD/group16_redo01.log Mem# 1: +REDO_DG/DBPROD/group16_redo02.log
2018-11-23T08:56:17.319616-08:00
Completed redo application of 377.92MB
2018-11-23T08:56:25.061718-08:00
Completed crash recovery at
Thread 1: RBA 10517.323909.16, nab 323909, scn 0x00000000087264b7 683839 data blocks read, 679844 data blocks written, 3122163 redo k-bytes read
Endian type of dictionary set to little
…
Start of recovery process – 2018-11-23T08:56:08.955533-08:00
Stop of recovery process – 2018-11-23T08:56:25.061718-08:00
Time taken for crash recovery ~ 17 seconds
Oracle Crash Recovery using AMM Memory Management with
Persistent Memory
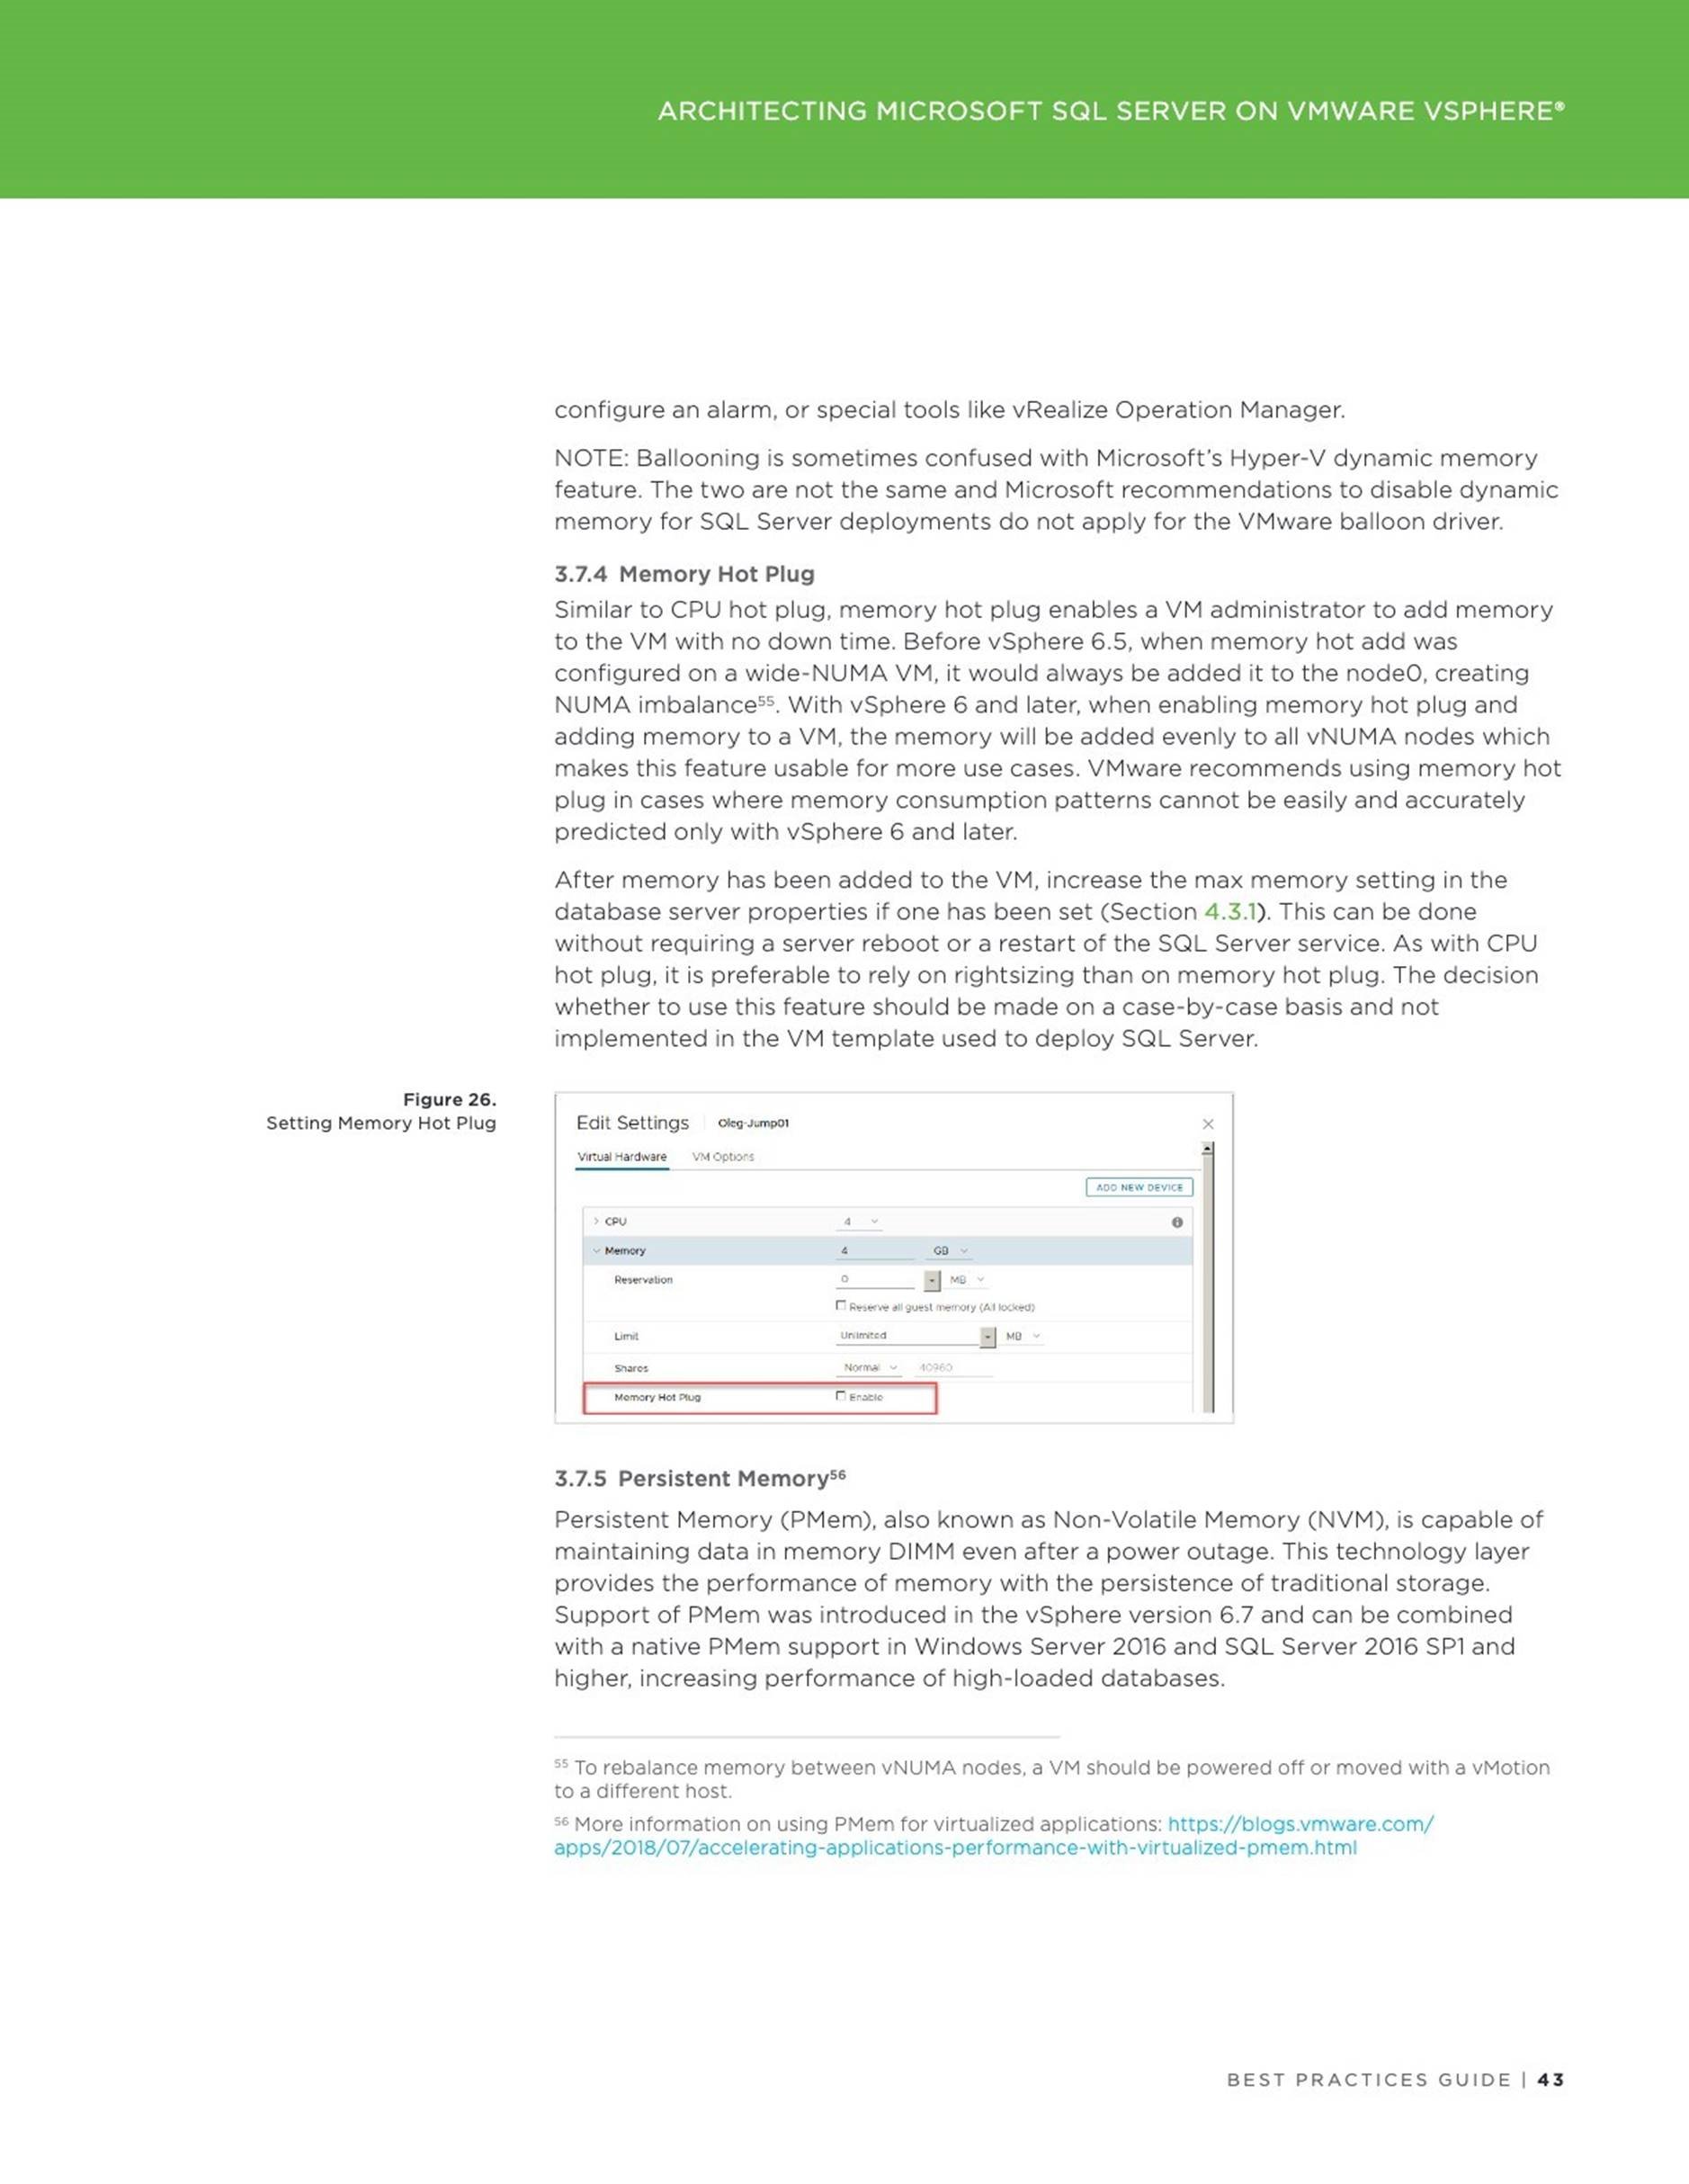
Stop Oracle database and ASM instance . Add a NVDIMM device to the VM of size 32GB as shown below.
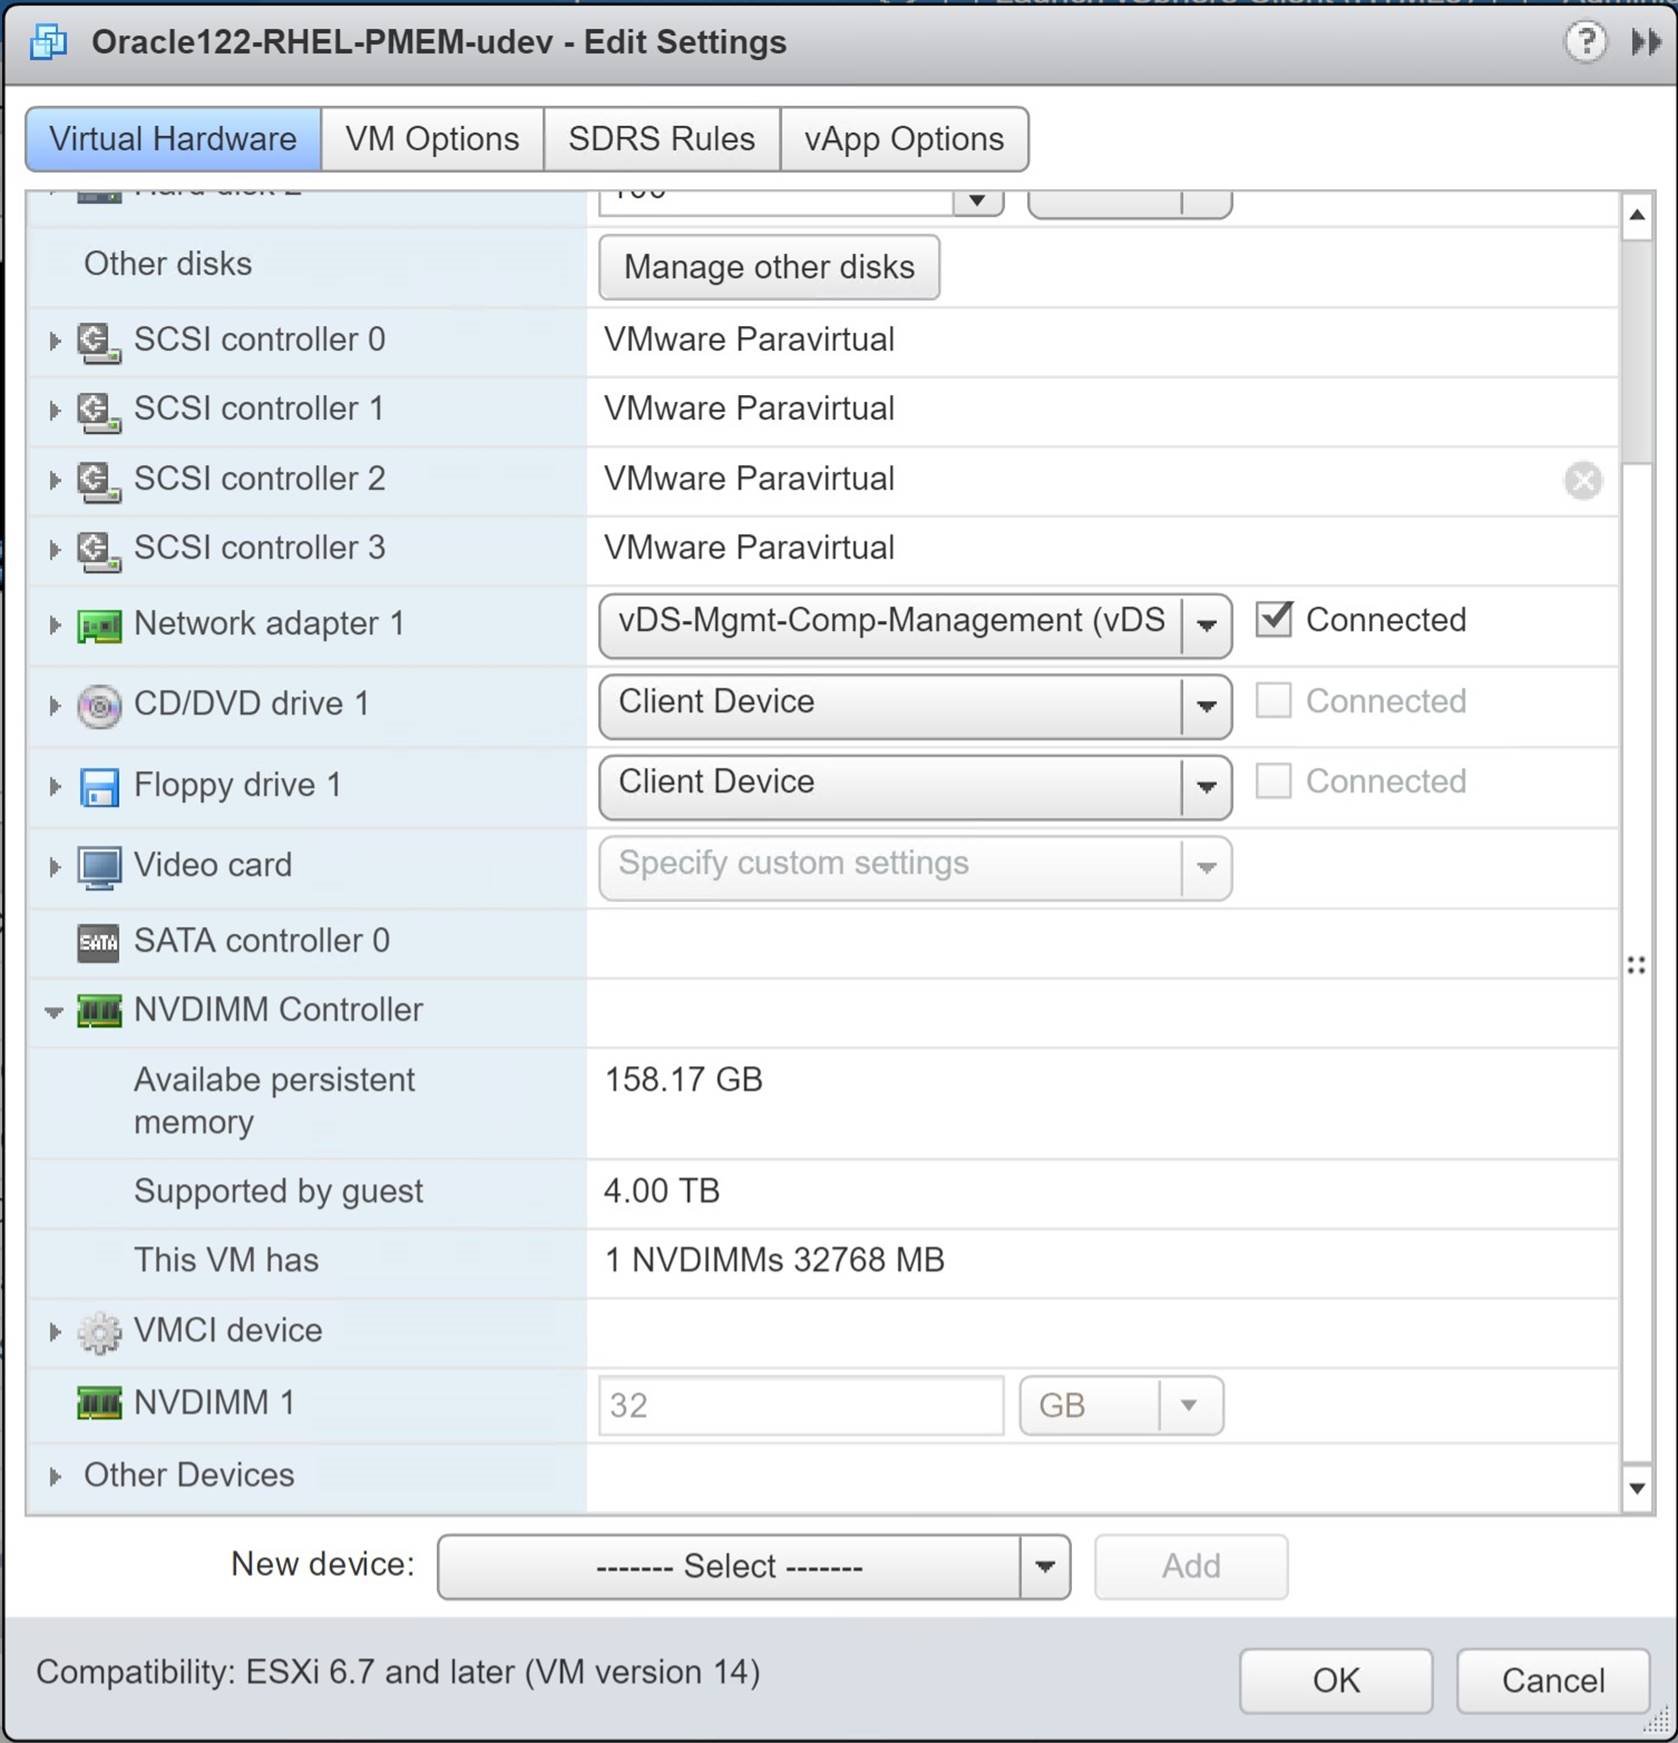
Running linux ‘fdisk’ command shows the nvdimm device as below.
[root@oracle122-rhel ~]# fdisk -lu ….
Disk /dev/pmem0: 34.4 GB, 34359738368 bytes, 67108864 sectors
Units = sectors of 1 * 512 = 512 bytes
Sector size (logical/physical): 512 bytes / 4096 bytes
I/O size (minimum/optimal): 4096 bytes / 4096 bytes
…
[root@oracle122-rhel ~]#
Mount the ‘/dev/shm’ file system on the PMEM device as shown below
[root@oracle122-rhel ~]# umount /dev/shm ; mount -t tmpfs -o size=24g
/dev/pmem0 /dev/shm ; df -h
Filesystem Size Used Avail Use% Mounted on /dev/mapper/rhel-root 36G 2.3G 34G 7% / devtmpfs 16G 0 16G 0% /dev tmpfs 16G 9.1M 16G 1% /run tmpfs 16G 0 16G 0% /sys/fs/cgroup
/dev/sda1 1014M 223M 792M 22% /boot
/dev/mapper/rhel-home 18G 4.0G 14G 23% /home /dev/mapper/vg2_oracle-LogVol_u01 99G 30G 65G 32% /u01 tmpfs 3.2G 0 3.2G 0% /run/user/501 tmpfs 3.2G 0 3.2G 0% /run/user/0
/dev/pmem0 24G 0 24G 0% /dev/shm
[root@oracle122-rhel ~]#
Restart the Oracle ASM and Database instance.
Rerun the same SLOB workload against the oracle database.
oracle@oracle122-rhel:DBPROD:/home/oracle>
/u01/software/SLOB/SLOB/runit.sh -s 1 -t 100
Before AWR
SQL*Plus: Release 12.2.0.1.0 Production on Fri Nov 23 09:16:56 2018
Copyright (c) 1982, 2016, Oracle. All rights reserved.
SQL> Connected.
SQL>
PL/SQL procedure successfully completed.
SQL> Disconnected from Oracle Database 12c Enterprise Edition Release
12.2.0.1.0 – 64bit Production
SLOB started with 1 users
/u01/software/SLOB/SLOB/runit.sh: line 2: !/bin/bash: No such file or directory
NOTIFY : 2018.11.23-09:16:58 : For security purposes all file and directory creation and deletions
NOTIFY : 2018.11.23-09:16:58 : performed by
/u01/software/SLOB/SLOB/runit.sh are logged in:
/u01/software/SLOB/SLOB/.file_operations_audit_trail.out.
NOTIFY : 2018.11.23-09:16:58 : SLOB TEMPDIR is /tmp/.SLOB.2018.11.23.091658. SLOB will delete this directory at the end of this execution.
NOTIFY : 2018.11.23-09:16:58 : Sourcing in slob.conf
NOTIFY : 2018.11.23-09:16:58 : Performing initial slob.conf sanity check…
NOTIFY : 2018.11.23-09:16:58 :
NOTIFY : 2018.11.23-09:16:58 : All SLOB sessions will connect to
DBPROD_PMEM_RHEL_PDB1 via SQL*Net.
NOTIFY : 2018.11.23-09:16:58 : Connecting to the instance to validate slob.conf->SCALE setting.
UPDATE_PCT: 100
SCAN_PCT: 0
RUN_TIME: 300
WORK_LOOP: 0
SCALE: 28G (3670016 blocks) WORK_UNIT: 64
REDO_STRESS: HEAVY
HOT_SCHEMA_FREQUENCY: 0 HOTSPOT_MB: 8
HOTSPOT_OFFSET_MB: 16
HOTSPOT_FREQUENCY: 3
THINK_TM_FREQUENCY: 0
THINK_TM_MIN: .1
THINK_TM_MAX: .5
DATABASE_STATISTICS_TYPE: awr
SYSDBA_PASSWD: “vmware123”
DBA_PRIV_USER: “sys”
ADMIN_SQLNET_SERVICE: “DBPROD_PMEM_RHEL_PDB1”
SQLNET_SERVICE_BASE: “DBPROD_PMEM_RHEL_PDB1”
SQLNET_SERVICE_MAX: “”
EXTERNAL_SCRIPT: “”
THREADS_PER_SCHEMA: 100 (-t option)
Note: runit.sh will use the following connect strings as per slob.conf settings:
Admin Connect String: “sys/vmware123@DBPROD_PMEM_RHEL_PDB1 as sysdba”
NOTIFY : 2018.11.23-09:16:59 :
NOTIFY : 2018.11.23-09:16:59 :
WARNING : 2018.11.23-09:16:59 :
***************************************************************************** WARNING : 2018.11.23-09:16:59 : SLOB has found possible zombie processes from a prior SLOB test.
WARNING : 2018.11.23-09:16:59 : It is possible that a prior SLOB test aborted.
WARNING : 2018.11.23-09:16:59 : Please investigate the following processes:
WARNING : 2018.11.23-09:16:59 :
*****************************************************************************
UID PID PPID C STIME TTY STAT TIME CMD oracle 30594 1 0 08:49 pts/0 S 0:00 iostat -xm 3 oracle 30595 1 0 08:49 pts/0 S 0:00 vmstat 3
WARNING : 2018.11.23-09:16:59 :
***************************************************************************** NOTIFY : 2018.11.23-09:16:59 : Checking for unlinked output files for processes: 30594 30595
NOTIFY : 2018.11.23-09:16:59 : Unlinked files for process pid 30594 (ls -l /proc/30594/fd):
NOTIFY : 2018.11.23-09:16:59 : Unlinked files for process pid 30595 (ls -l
/proc/30595/fd):
WARNING : 2018.11.23-09:16:59 :
*****************************************************************************
NOTIFY : 2018.11.23-09:16:59 : Clearing temporary SLOB output files from previous SLOB testing.
NOTIFY : 2018.11.23-09:16:59 : Testing admin connectivity to the instance to validate slob.conf settings.
NOTIFY : 2018.11.23-09:16:59 : Testing connectivity. Command: “sqlplus -L sys/vmware123@DBPROD_PMEM_RHEL_PDB1 as sysdba”.
NOTIFY : 2018.11.23-09:16:59 : Next, testing 1 user (non-admin) connections…
NOTIFY : 2018.11.23-09:16:59 : Testing connectivity. Command: “sqlplus -L
user1/user1@DBPROD_PMEM_RHEL_PDB1”.
NOTIFY : 2018.11.23-09:16:59 : Performing redo log switch.
NOTIFY : 2018.11.23-09:16:59 : Redo log switch complete. Setting up trigger mechanism.
NOTIFY : 2018.11.23-09:17:09 : Running iostat, vmstat and mpstat on current host–in background.
NOTIFY : 2018.11.23-09:17:09 : Connecting 100 (THREADS_PER_SCHEMA) session(s) to 1 schema(s) …
NOTIFY : 2018.11.23-09:17:12 :
NOTIFY : 2018.11.23-09:17:12 : Executing awr “before snap” procedure.
Command: “sqlplus -S -L sys/vmware123@DBPROD_PMEM_RHEL_PDB1 as sysdba”.
NOTIFY : 2018.11.23-09:17:13 : Before awr snap ID is 1219
NOTIFY : 2018.11.23-09:17:13 :
NOTIFY : 2018.11.23-09:17:13 : Test has been triggered. Processes are executing.
NOTIFY : 2018.11.23-09:17:13 : List of monitored sqlplus PIDs written to /tmp/.SLOB.2018.11.23.091658/17594.f_wait_pids.out.
NOTIFY : 2018.11.23-09:17:23 : Waiting for 287 seconds before monitoring running processes (for exit).
^C oracle@oracle122-rhel:DBPROD:/home/oracle>
Run ‘shutdown abort’ against database to simulate a crash at 3 minutes into the load.
oracle@oracle122-rhel:DBPROD:/home/oracle> date Fri Nov 23 09:20:23 PST 2018
oracle@oracle122-rhel:DBPROD:/home/oracle> ./stop_db_abort SQL*Plus: Release 12.2.0.1.0 Production on Fri Nov 23 09:20:28 2018
Copyright (c) 1982, 2016, Oracle. All rights reserved.
SQL> Connected.
SQL> ORACLE instance shut down.
SQL> Disconnected from Oracle Database 12c Enterprise Edition Release
12.2.0.1.0 – 64bit Production oracle@oracle122-rhel:DBPROD:/home/oracle>
Restart the Oracle database which prompts Oracle to perform crash recovery of the thread.
Observe the database alert log file to see the crash recovery progress.
oracle@oracle122rhel:DBPROD:/u01/admin/DBPROD/diag/rdbms/dbprod/DBPROD/trace> tail
-f alert_DBPROD.log
….
2018-11-23T09:20:28.524404-08:00
Shutting down instance (abort) (OS id: 18455)
License high water mark = 105
2018-11-23T09:20:28.524825-08:00
USER (ospid: 18455): terminating the instance
2018-11-23T09:20:29.724996-08:00
Instance terminated by USER, pid = 18455 2018-11-23T09:20:30.532675-08:00 Instance shutdown complete (OS id: 18455)
…..
2018-11-23T09:22:47.704602-08:00 Completed redo scan read 3233975 KB redo, 725845 data blocks need recovery
2018-11-23T09:22:51.953683-08:00
…
2018-11-23T09:22:56.044295-08:00
Started redo application at
Thread 1: logseq 10518, block 197286, offset 0
2018-11-23T09:22:56.050171-08:00
Recovery of Online Redo Log: Thread 1 Group 1 Seq 10518 Reading mem 0
Mem# 0: +REDO_DG/DBPROD/group01_redo01.log
Mem# 1: +REDO_DG/DBPROD/group01_redo02.log
2018-11-23T09:22:56.430511-08:00
Recovery of Online Redo Log: Thread 1 Group 2 Seq 10519 Reading mem 0
Mem# 0: +REDO_DG/DBPROD/group02_redo01.log
Mem# 1: +REDO_DG/DBPROD/group02_redo02.log
2018-11-23T09:22:57.038002-08:00
Recovery of Online Redo Log: Thread 1 Group 3 Seq 10520 Reading mem 0
Mem# 0: +REDO_DG/DBPROD/group03_redo01.log
Mem# 1: +REDO_DG/DBPROD/group03_redo02.log
2018-11-23T09:22:57.661509-08:00
Recovery of Online Redo Log: Thread 1 Group 4 Seq 10521 Reading mem 0
Mem# 0: +REDO_DG/DBPROD/group04_redo01.log
Mem# 1: +REDO_DG/DBPROD/group04_redo02.log
2018-11-23T09:22:58.285863-08:00
Recovery of Online Redo Log: Thread 1 Group 5 Seq 10522 Reading mem 0
Mem# 0: +REDO_DG/DBPROD/group05_redo01.log
Mem# 1: +REDO_DG/DBPROD/group05_redo02.log
2018-11-23T09:22:58.899482-08:00
Recovery of Online Redo Log: Thread 1 Group 6 Seq 10523 Reading mem 0
Mem# 0: +REDO_DG/DBPROD/group06_redo01.log
Mem# 1: +REDO_DG/DBPROD/group06_redo02.log
2018-11-23T09:22:59.525095-08:00
Recovery of Online Redo Log: Thread 1 Group 7 Seq 10524 Reading mem 0
Mem# 0: +REDO_DG/DBPROD/group07_redo01.log
Mem# 1: +REDO_DG/DBPROD/group07_redo02.log
2018-11-23T09:23:00.153196-08:00
Recovery of Online Redo Log: Thread 1 Group 8 Seq 10525 Reading mem 0 Mem# 0: +REDO_DG/DBPROD/group08_redo01.log
Mem# 1: +REDO_DG/DBPROD/group08_redo02.log
2018-11-23T09:23:00.802933-08:00
Recovery of Online Redo Log: Thread 1 Group 9 Seq 10526 Reading mem 0
Mem# 0: +REDO_DG/DBPROD/group09_redo01.log
Mem# 1: +REDO_DG/DBPROD/group09_redo02.log
2018-11-23T09:23:01.497673-08:00
Recovery of Online Redo Log: Thread 1 Group 10 Seq 10527 Reading mem 0
Mem# 0: +REDO_DG/DBPROD/group10_redo01.log
Mem# 1: +REDO_DG/DBPROD/group10_redo02.log
2018-11-23T09:23:02.152860-08:00
Recovery of Online Redo Log: Thread 1 Group 11 Seq 10528 Reading mem 0
Mem# 0: +REDO_DG/DBPROD/group11_redo01.log
Mem# 1: +REDO_DG/DBPROD/group11_redo02.log
2018-11-23T09:23:02.861497-08:00
Recovery of Online Redo Log: Thread 1 Group 12 Seq 10529 Reading mem 0
Mem# 0: +REDO_DG/DBPROD/group12_redo01.log
Mem# 1: +REDO_DG/DBPROD/group12_redo02.log
2018-11-23T09:23:03.583704-08:00
Recovery of Online Redo Log: Thread 1 Group 13 Seq 10530 Reading mem 0
Mem# 0: +REDO_DG/DBPROD/group13_redo01.log
Mem# 1: +REDO_DG/DBPROD/group13_redo02.log
2018-11-23T09:23:04.323907-08:00
Recovery of Online Redo Log: Thread 1 Group 14 Seq 10531 Reading mem 0
Mem# 0: +REDO_DG/DBPROD/group14_redo01.log
Mem# 1: +REDO_DG/DBPROD/group14_redo02.log
2018-11-23T09:23:05.024650-08:00
Completed redo application of 375.40MB
2018-11-23T09:23:13.419001-08:00
Completed crash recovery at
Thread 1: RBA 10531.255760.16, nab 255760, scn 0x000000000878ad36 725845 data blocks read, 721385 data blocks written, 3233975 redo k-bytes read
Endian type of dictionary set to little
….
Start of recovery process – 2018-11-23T09:22:56.044295-08:00
Stop of recovery process – 2018-11-23T09:23:13.419001-08:00
Time taken for crash recovery ~ 17 secs
Test Results
Oracle Crash Recovery using AMM Memory Management without Persistent
Memory
Start of recovery process – 2018-11-23T08:56:08.955533-08:00
Stop of recovery process – 2018-11-23T08:56:25.061718-08:00
Time taken for crash recovery ~ 17 seconds
Oracle Crash Recovery using AMM Memory Management with Persistent
Memory
Start of recovery process – 2018-11-23T09:22:56.044295-08:00
Stop of recovery process – 2018-11-23T09:23:13.419001-08:00
Time taken for crash recovery ~ 17 seconds
The above 2 results are the same and we wonder why we are not able to accelerate the Oracle crash recovery process in the same way as we were able to achieve with the Redis IMBD. Keep in mind, with PMem-aware Redis. we added very low-overhead journaling to make Redis transactions on persistent memory crash consistent .
That’s not the case with the Oracle software out of the box. Oracle will still use its proprietary crash recovery mechanism and hence the reason.
Oracle recreates the SGA granules on every instance startup , in /dev/shm , and hence even if the old SGA granules are present in PMEM , Oracle disregards it for crash recovery purposes.
The best way to find out is to trace the Oracle startup process which shows the
SGA granules under /dev/shm are created with O_RDWR, O_CREAT & O_SYNC flags.
The man page for Linux open describes the flags in the open() command below.
A call to open() creates a new open file description, an entry in the system-wide table of open files. The open file description records the file offset and the file status flags (see below). A file descriptor is a reference to an open file description; this reference is unaffected if pathname is subsequently removed or modified to refer to a different file. For further details on open file descriptions, see NOTES.
The argument flags must include one of the following access modes:
O_RDONLY, O_WRONLY, or O_RDWR. These request opening the file readonly, write-only, or read/write, respectively.
O_CREAT – If pathname does not exist, create it as a regular file. The owner (user ID) of the new file is set to the effective user ID of the process.
O_SYNC – Write operations on the file will complete according to the requirements of synchronized I/O file integrity completion (by contrast with the synchronized I/O data integrity completion provided by O_DSYNC.)
http://man7.org/linux/man-pages/man2/open.2.html
The complete output of the strace command for Instance startup is below. strace –o /tmp/foo –f sh ./start_db Output :
24932 open(“/dev/shm”, O_RDONLY|O_NOCTTY) = 3
24932 fstat(3, {st_mode=S_IFDIR|S_ISVTX|0777, st_size=5480, …}) = 0
24932 close(3) = 0
24932 open(“/etc/mtab”, O_RDONLY|O_CLOEXEC) = 3
24932 fstat(3, {st_mode=S_IFREG|0444, st_size=0, …}) = 0
24932 mmap(NULL, 4096, PROT_READ|PROT_WRITE,
MAP_PRIVATE|MAP_ANONYMOUS, -1, 0) = 0x7fba5c338000
24932 read(3, “rootfs / rootfs rw 0 0\nsysfs /sy”…, 1024) = 1024
24932 read(3, “eezer cgroup rw,nosuid,nodev,noe”…, 1024) = 1024
24932 read(3, “ogVol_u01 /u01 ext4 rw,relatime,”…, 1024) = 401
24932 read(3, “”, 1024) = 0
24932 close(3) = 0
24932 munmap(0x7fba5c338000, 4096) = 0
24932 lstat(“/dev”, {st_mode=S_IFDIR|0755, st_size=3540, …}) = 0
24932 lstat(“/dev/shm”, {st_mode=S_IFDIR|S_ISVTX|0777, st_size=5480, …})
= 0
24932 stat(“/dev/shm”, {st_mode=S_IFDIR|S_ISVTX|0777, st_size=5480, …}) = 0
24932 uname({sysname=”Linux”, nodename=”oracle122-rhel.vslab.local”, …})
= 0
24932 statfs(“/dev/shm”, {f_type=TMPFS_MAGIC, f_bsize=4096, f_blocks=6291456, f_bfree=6127616, f_bavail=6127616, f_files=4097625, f_ffree=4097352, f_fsid={0, 0}, f_namelen=255, f_frsize=409
6, f_flags=ST_VALID|ST_RELATIME}) = 0
24932 stat(“/dev/shm”, {st_mode=S_IFDIR|S_ISVTX|0777, st_size=5480, …})
= 0
24932 open(“/usr/lib64/gconv/gconv-modules.cache”, O_RDONLY) = 3
24932 fstat(3, {st_mode=S_IFREG|0644, st_size=26254, …}) = 0
24932 mmap(NULL, 26254, PROT_READ, MAP_SHARED, 3, 0) =
0x7fba5c332000
24932 close(3) = 0
24932 fstat(1, {st_mode=S_IFIFO|0600, st_size=0, …}) = 0
24932 mmap(NULL, 4096, PROT_READ|PROT_WRITE,
MAP_PRIVATE|MAP_ANONYMOUS, -1, 0) = 0x7fba5c331000
24932 write(1, “Filesystem 1K-blocks Used “…, 114) = 114
24932 close(1 <unfinished …>
24917 <… read resumed> “Filesystem 1K-blocks Used “…, 4096) = 114
24932 <… close resumed> ) = 0
24932 munmap(0x7fba5c331000, 4096) = 0
24917 close(13 <unfinished …> 24932 close(2) = 0
24917 <… close resumed> ) = 0
24932 exit_group(0) = ?
24917 wait4(24932, <unfinished …>
24932 +++ exited with 0 +++
24917 <… wait4 resumed> [{WIFEXITED(s) && WEXITSTATUS(s) == 0}], 0,
NULL) = 24932
24917 — SIGCHLD {si_signo=SIGCHLD, si_code=CLD_EXITED, si_pid=24932, si_uid=54321, si_status=0, si_utime=0, si_stime=0} — 24917 munmap(0x7fc6387df000, 4096) = 0
24917 get_mempolicy(NULL, NULL, 0, NULL, 0) = 0
24917 get_mempolicy(NULL, NULL, 0, NULL, 0) = 0
24917 shmget(IPC_PRIVATE, 4096, IPC_CREAT|IPC_EXCL|0600) = 983043
24917 shmat(983043, NULL, 0) = 0x7fc6387df000
24917 open(“/dev/shm/ora_DBPROD_983043_0”,
O_RDWR|O_CREAT|O_SYNC, 0600) = 13
24917 close(13) = 0
24917 shmdt(0x7fc6387df000) = 0
24917 getrlimit(RLIMIT_STACK, {rlim_cur=32768*1024, rlim_max=32768*1024}) = 0
24917 brk(NULL) = 0x1603e000
24917 open(“/proc/self/maps”, O_RDONLY) = 13
24917 read(13, “00400000-15293000 r-xp 00000000 “…, 299) = 299
24917 read(13, ” /u01/app/o”…, 299) = 299
24917 read(13, ” /u01/app/oracle”…, 299) = 299
24917 read(13, “t/12.2.0/dbhome_1/lib/libnque12.”…, 299) = 299
24917 read(13, “377e000-7fc63377f000 r–p 0000b0″…, 299) = 299
24917 read(13, ” 33556075 /usr”…, 299) = 299
24917 read(13, “5 /usr/lib64/l”…, 299) = 299
24917 read(13, “p 00014000 fd:00 33554500 “…, 299) = 299
24917 read(13, “3d6b000-7fc633f6a000 —p 001c30″…, 299) = 299
24917 read(13, “7fc633f75000 rw-p 00000000 00:00″…, 299) = 299
24917 read(13, ” /usr/lib64/libreso”…, 299) = 299
24917 read(13, “1a4000-7fc6343a4000 —p 0001600″…, 299) = 299
24917 read(13, “6000-7fc6343a8000 rw-p 00000000 “…, 299) = 299
24917 read(13, “18 /usr/lib64/”…, 299) = 299
24917 read(13, “\n7fc6346c5000-7fc6348c4000 —p “…, 299) = 299
24917 read(13, “c6000-7fc6348c8000 r-xp 00000000″…, 299) = 299
24917 read(13, “-7fc634aca000 rw-p 00003000 fd:0″…, 299) = 299
24917 read(13, “le/product/12.2.0/dbhome_1/lib/l”…, 299) = 299
24917 read(13, “00001000 fd:00 33557989 “…, 299) = 299
24917 read(13, ” 00000000 fd:02 2885530 “…, 299) = 299
24917 read(13, ” /u01/app/oracle/product/”…, 299) = 299
24917 read(13, “0/dbhome_1/lib/libocrb12.so\n7fc6″…, 299) = 299
24917 read(13, “-7fc63578b000 —p 00109000 fd:0″…, 299) = 299
24917 read(13, ” /u01/app/ora”…, 299) = 299
24917 read(13, “duct/12.2.0/dbhome_1/lib/libskgx”…, 299) = 299
24917 read(13, “so\n7fc636c31000-7fc636c78000 rw-“…, 299) = 299
24917 read(13, “b/libdbcfg12.so\n7fc636ca1000-7fc”…, 299) = 299
24917 read(13, “d000 r-xp 00000000 fd:02 2889021″…, 299) = 299
24917 read(13, ” /u01/app/oracle/p”…, 299) = 299
24917 read(13, “2.2.0/dbhome_1/lib/libipc1.so\n7f”…, 299) = 299
24917 read(13, “duct/12.2.0/dbhome_1/lib/libmql1″…, 299) = 299
24917 read(13, “96000-7fc637798000 rw-p 00000000″…, 299) = 299
24917 read(13, ” /usr/lib64/librt-2.1″…, 299) = 299
24917 read(13, “041000 fd:02 2884686 “…, 299) = 299
24917 read(13, ” /u01/app/oracle/product/12.2.”…, 299) = 299
24917 read(13, “ome_1/lib/libskgxp12.so\n7fc637ef”…, 299) = 299
24917 read(13, “c6381bf000 rw-p 000b5000 fd:02 2″…, 299) = 299
24917 read(13, ” /u01/app/oracle/”…, 299) = 299
24917 read(13, “0/dbhome_1/lib/libodmd12.so\n7fc6″…, 299) = 299
24917 read(13, “0-7fc6385e4000 r-xp 00000000 fd:”…, 299) = 299
24917 read(13, “000 rw-p 00022000 fd:00 33555224″…, 299) = 299
24917 read(13, “-ffffffffff601000 r-xp 00000000 “…, 299) = 68
24917 close(13) = 0
24917 shmat(983043, NULL, SHM_RDONLY) = 0x7fc6387df000
24917 shmdt(0x7fc6387df000) = 0
24917 shmat(983043, NULL, 0) = 0x7fc6387df000
24917 shmdt(0x7fc6387df000) = 0
24917 mmap(0x60000000, 33554432, PROT_READ|PROT_WRITE,
MAP_PRIVATE|MAP_FIXED|MAP_ANONYMOUS, -1, 0) = 0x60000000
24917 munmap(0x60000000, 33554432) = 0
24917 open(“/dev/shm/ora_DBPROD_983043_0”, O_RDWR|O_SYNC) = 13
24917 mmap(0x60000000, 33554432, PROT_READ|PROT_WRITE,
MAP_SHARED|MAP_FIXED, 13, 0) = 0x60000000
24917 close(13) = 0
24917 lseek(8, 0, SEEK_CUR) = 851
24917 write(8, “\n*** 2018-10-11T16:06:11.497151-“…, 38) = 38
24917 write(11, “00+3}0Pc\n”, 9) = 9
24917 write(8, ” Shared memory segment allocated”…, 105) = 105
24917 write(8, “\n”, 1) = 1
24917 shmget(IPC_PRIVATE, 4096, IPC_CREAT|IPC_EXCL|0600) = 1015812
24917 shmat(1015812, NULL, 0) = 0x7fc6387df000
24917 open(“/dev/shm/ora_DBPROD_1015812_0”,
O_RDWR|O_CREAT|O_SYNC, 0600) = 13
24917 close(13) = 0
24917 open(“/dev/shm/ora_DBPROD_1015812_1”,
O_RDWR|O_CREAT|O_SYNC, 0600) = 13
24917 close(13) = 0
24917 open(“/dev/shm/ora_DBPROD_1015812_2”,
O_RDWR|O_CREAT|O_SYNC, 0600) = 13
24917 close(13) = 0
24917 open(“/dev/shm/ora_DBPROD_1015812_3”,
O_RDWR|O_CREAT|O_SYNC, 0600) = 13
24917 close(13) = 0
24917 open(“/dev/shm/ora_DBPROD_1015812_4”,
O_RDWR|O_CREAT|O_SYNC, 0600) = 13
24917 close(13) = 0
24917 open(“/dev/shm/ora_DBPROD_1015812_5”,
O_RDWR|O_CREAT|O_SYNC, 0600) = 13
24917 close(13) = 0
24917 open(“/dev/shm/ora_DBPROD_1015812_6”,
O_RDWR|O_CREAT|O_SYNC, 0600) = 13
24917 close(13) = 0
24917 open(“/dev/shm/ora_DBPROD_1015812_7”,
O_RDWR|O_CREAT|O_SYNC, 0600) = 13 ……….
Conclusion
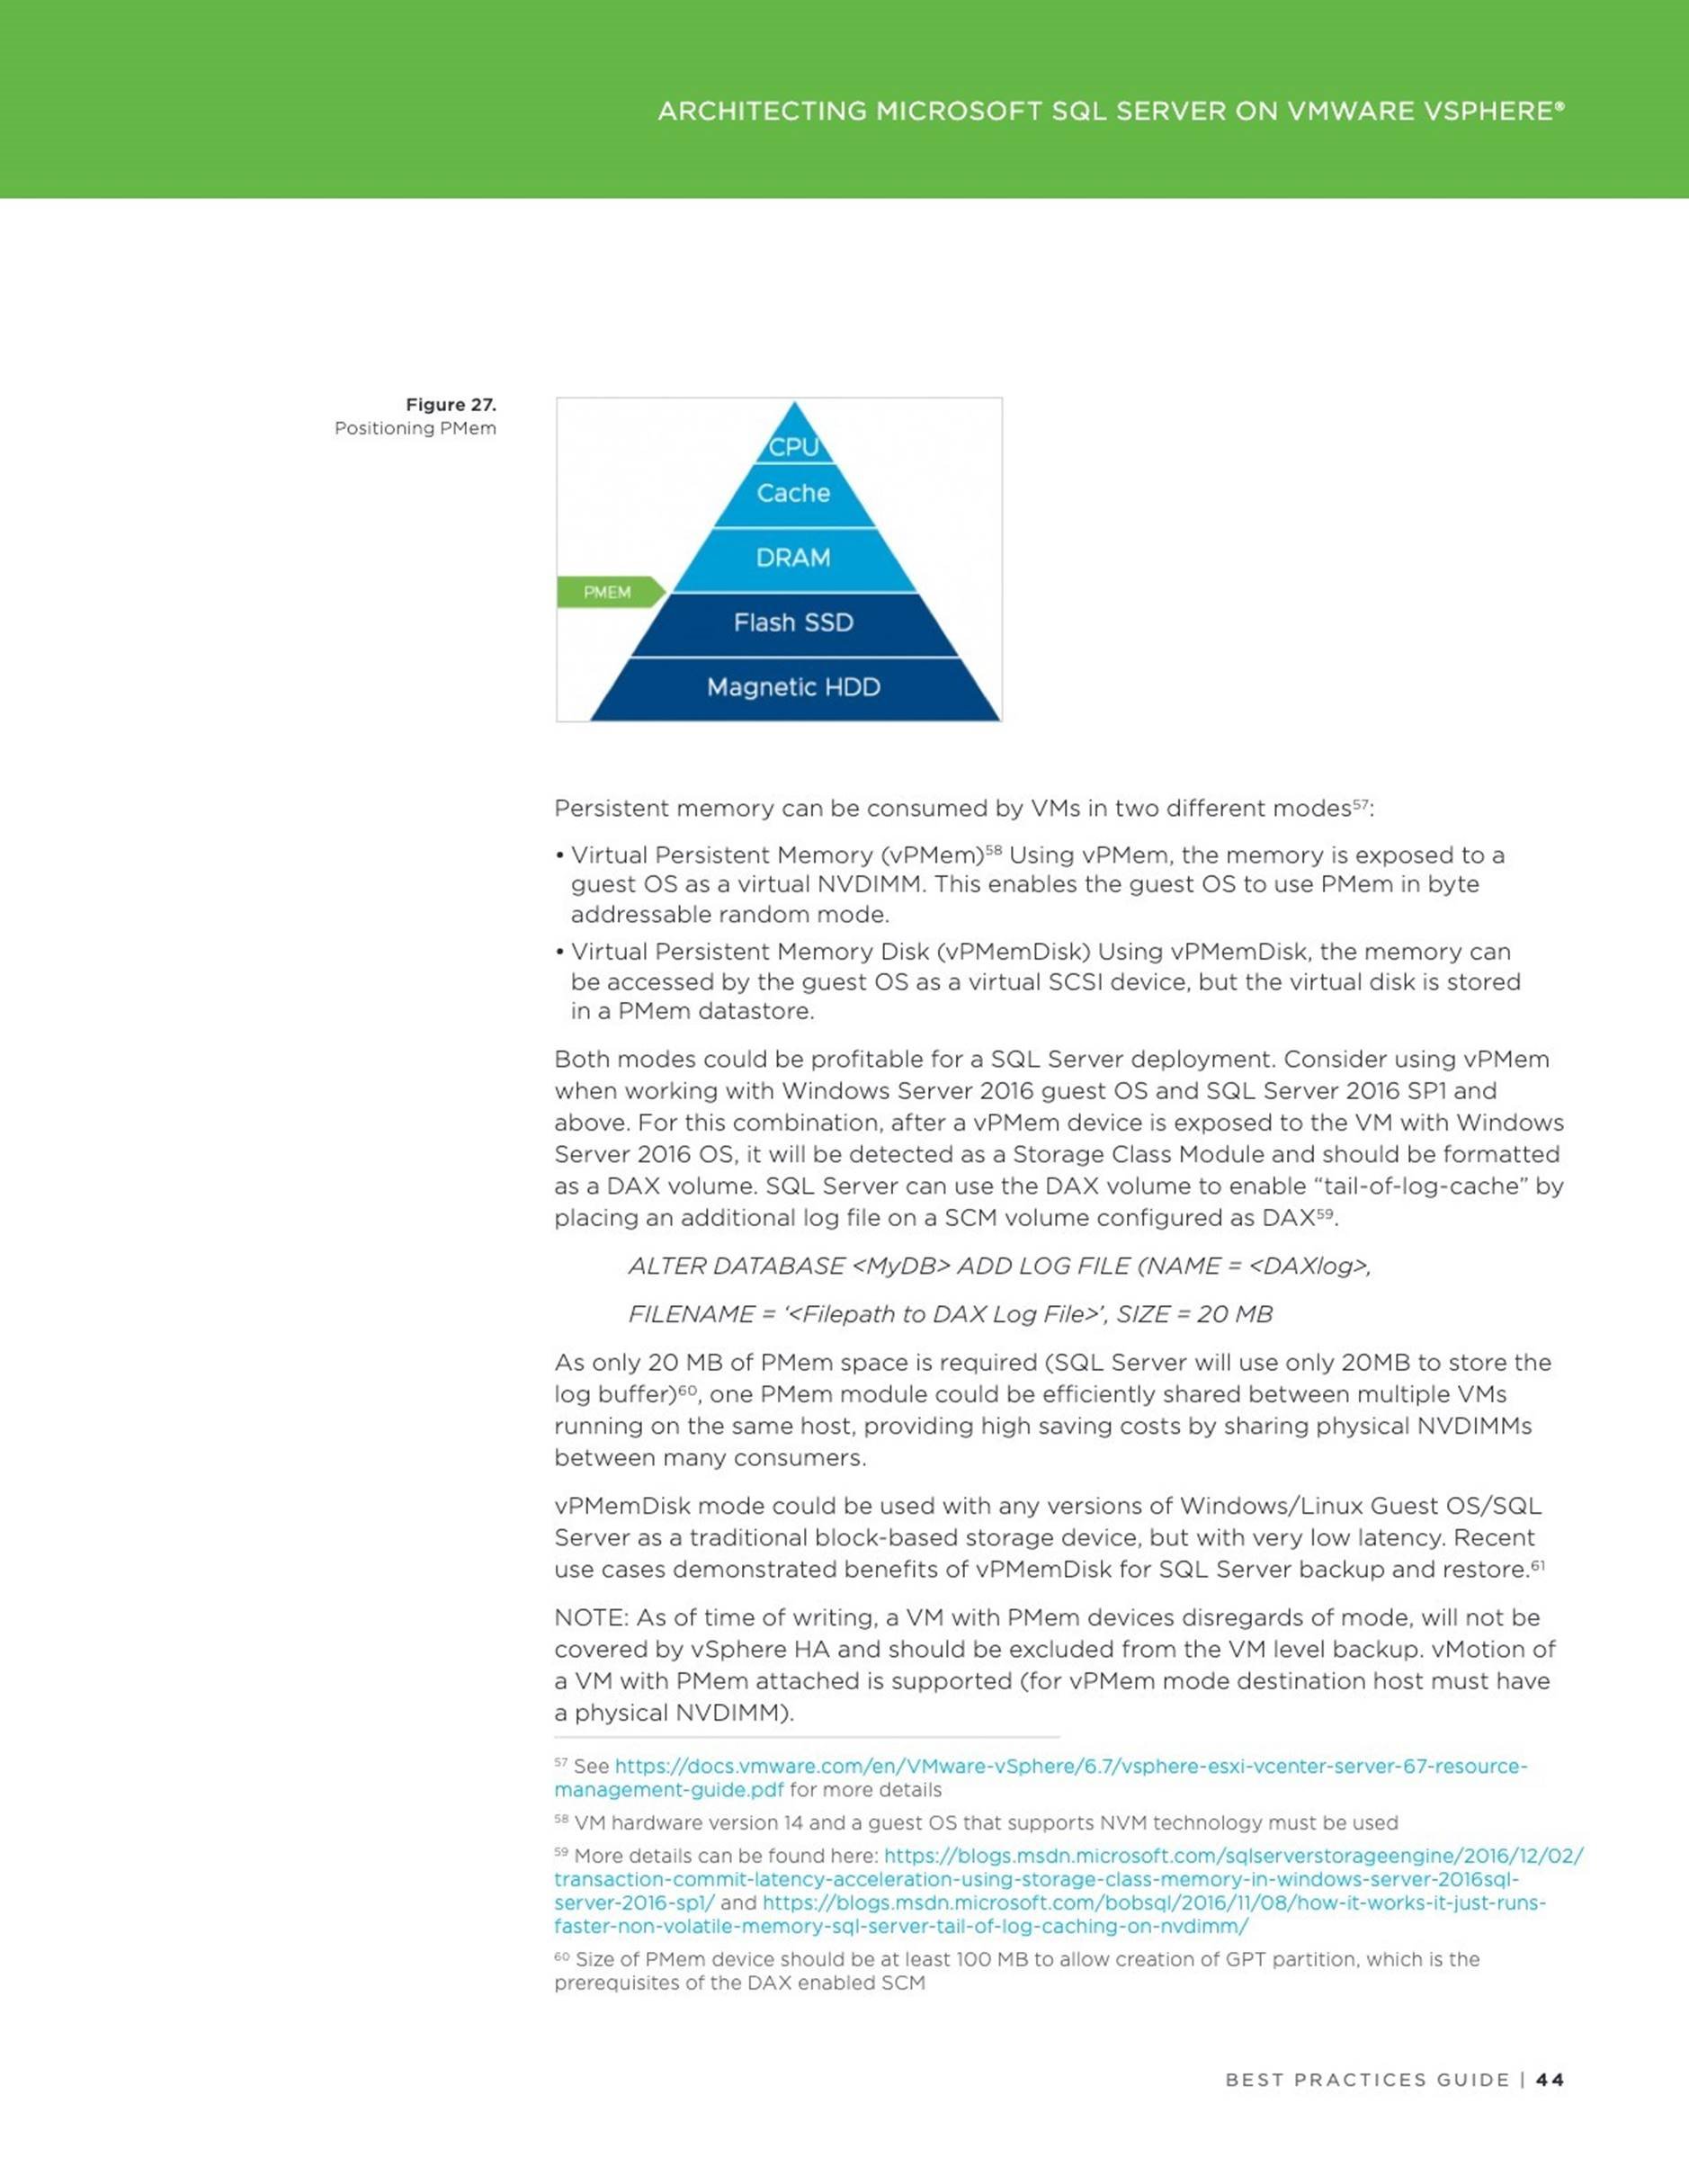
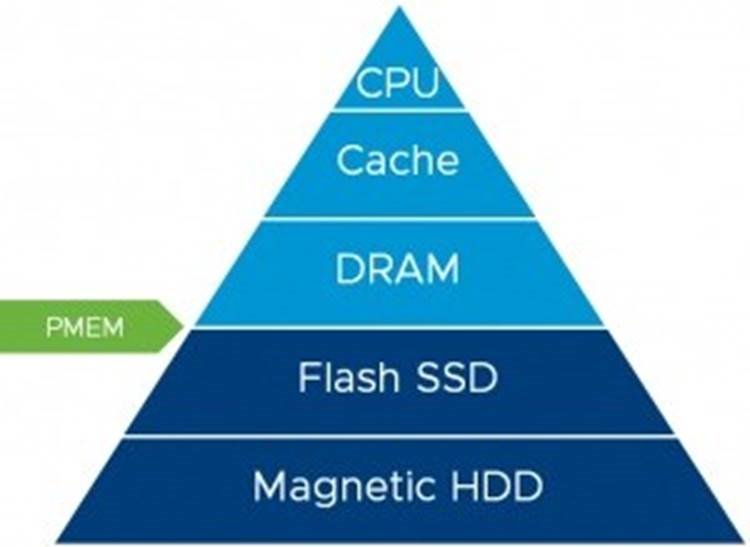
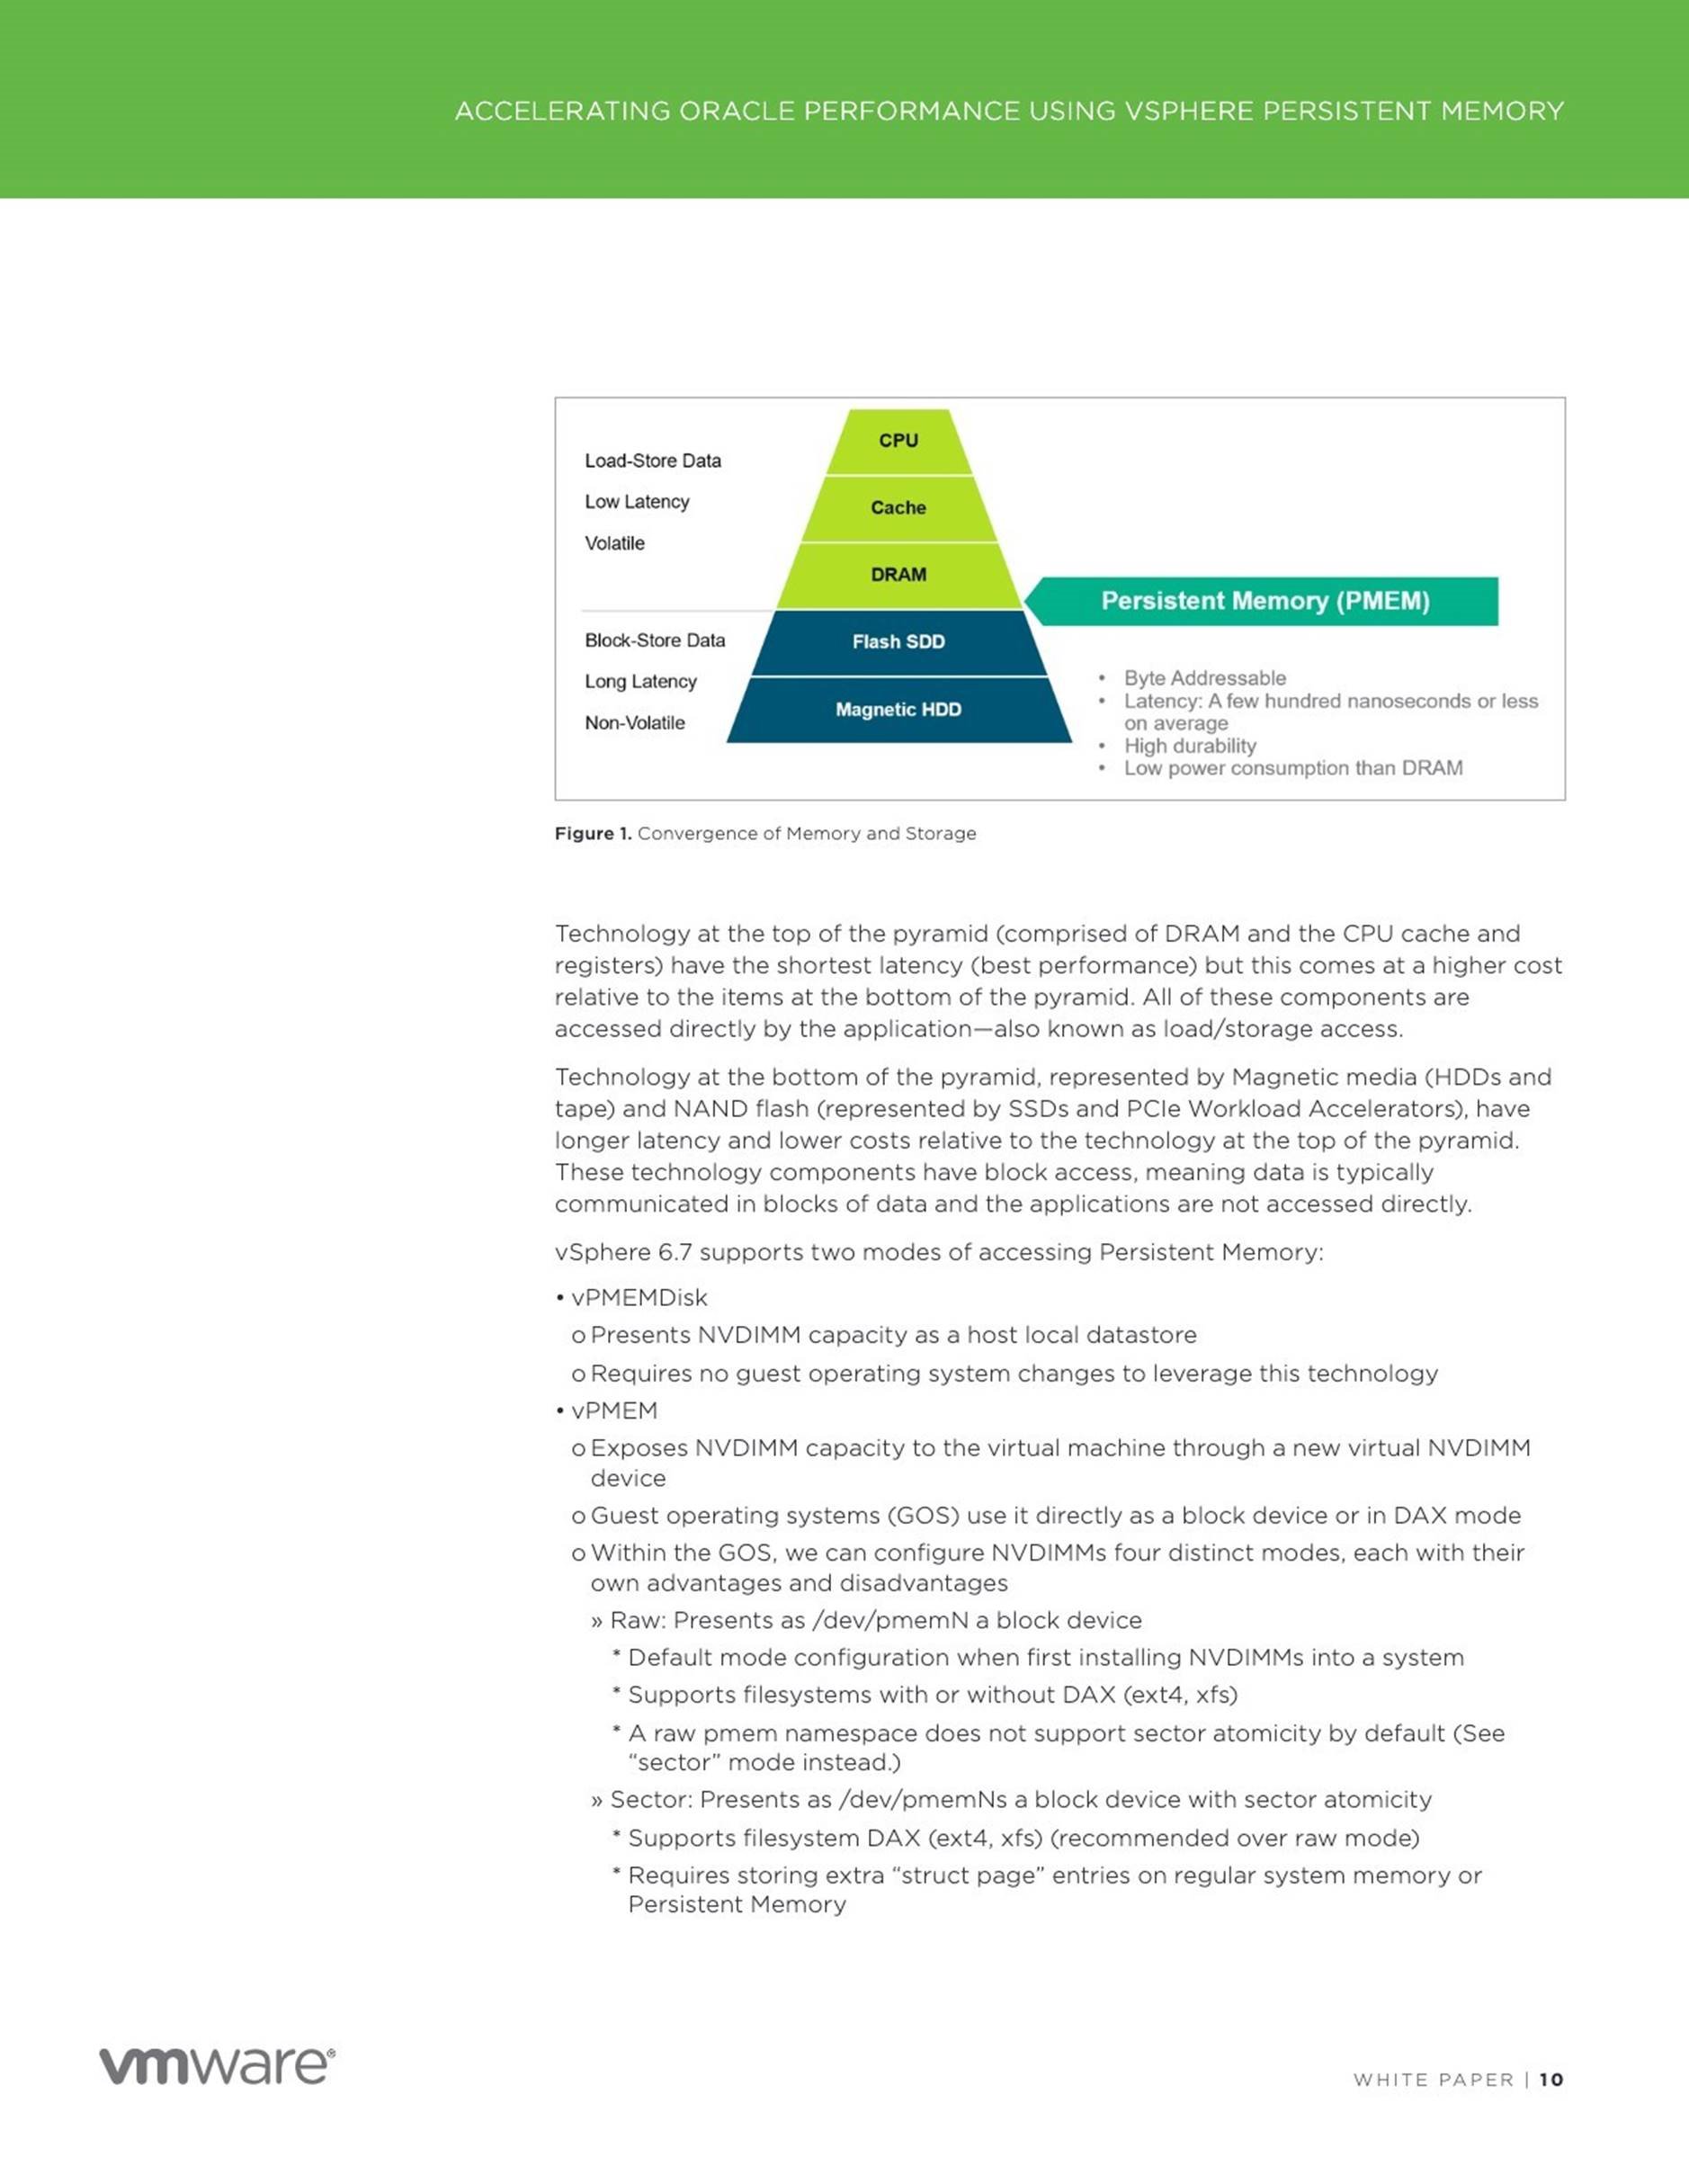
Persistent Memory (PMEM) resides between DRAM and disk storage in the data storage hierarchy. This technology enables byte-addressable updates and does not lose data if power is lost.
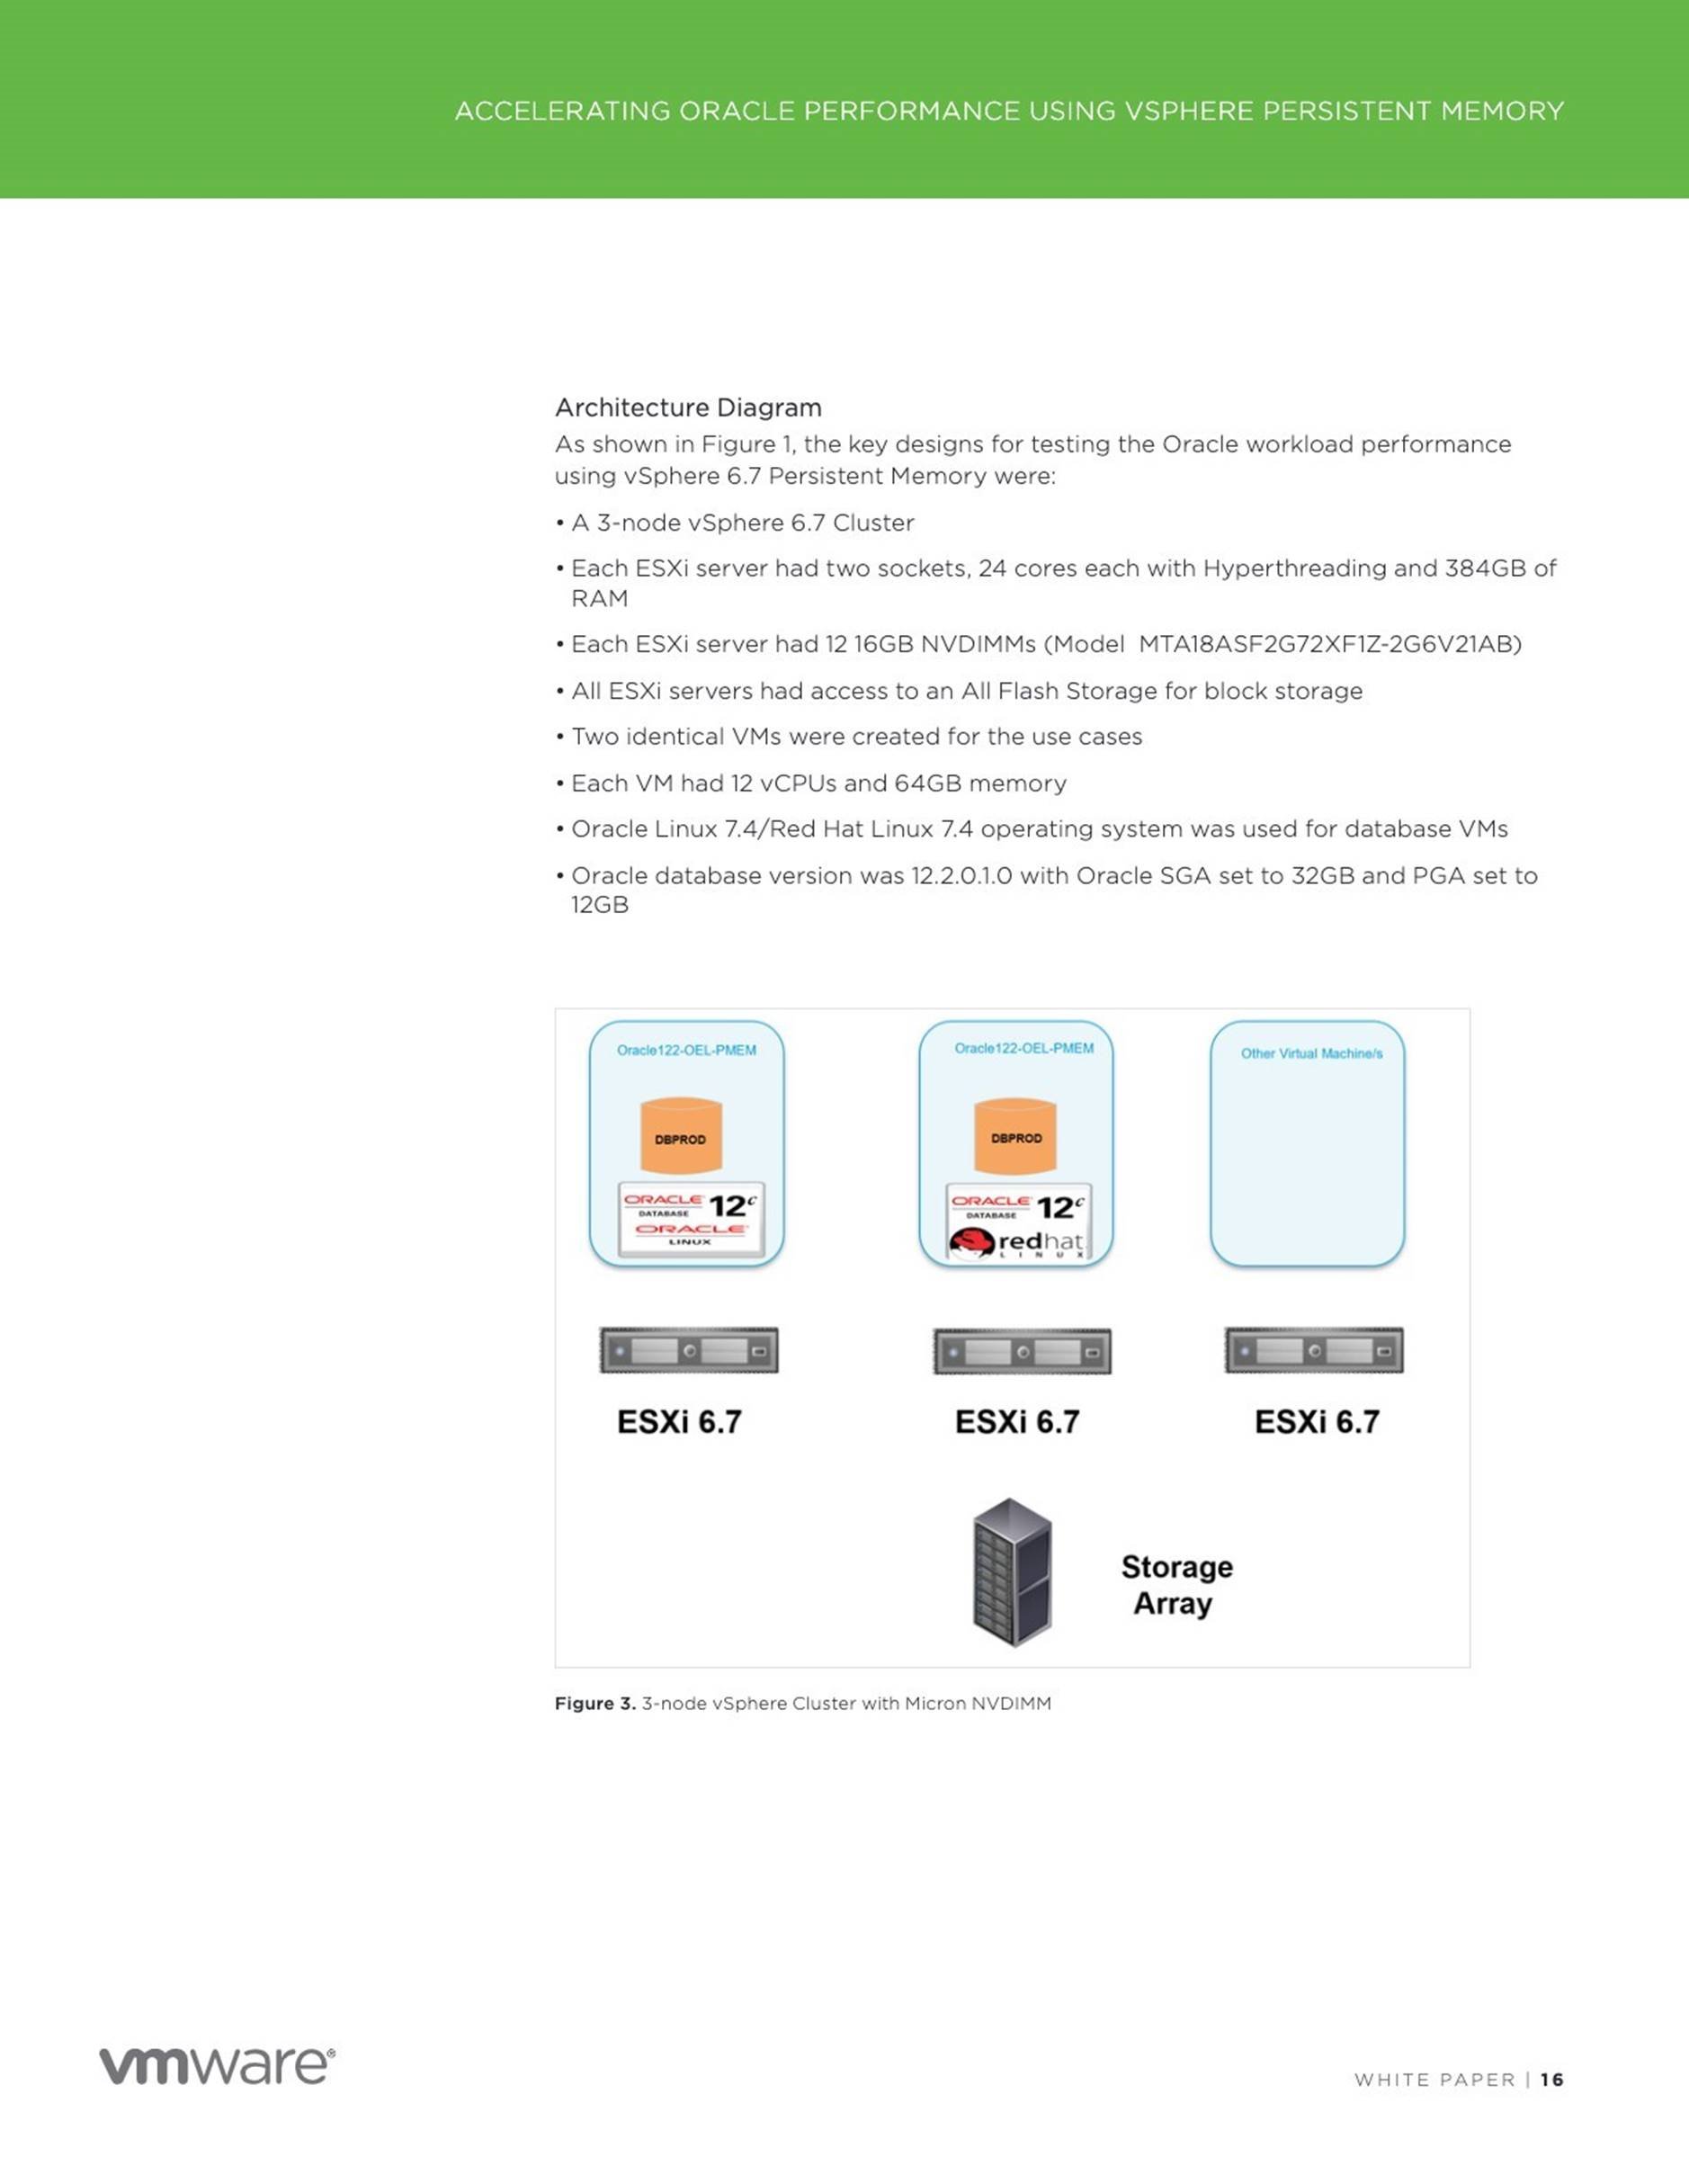
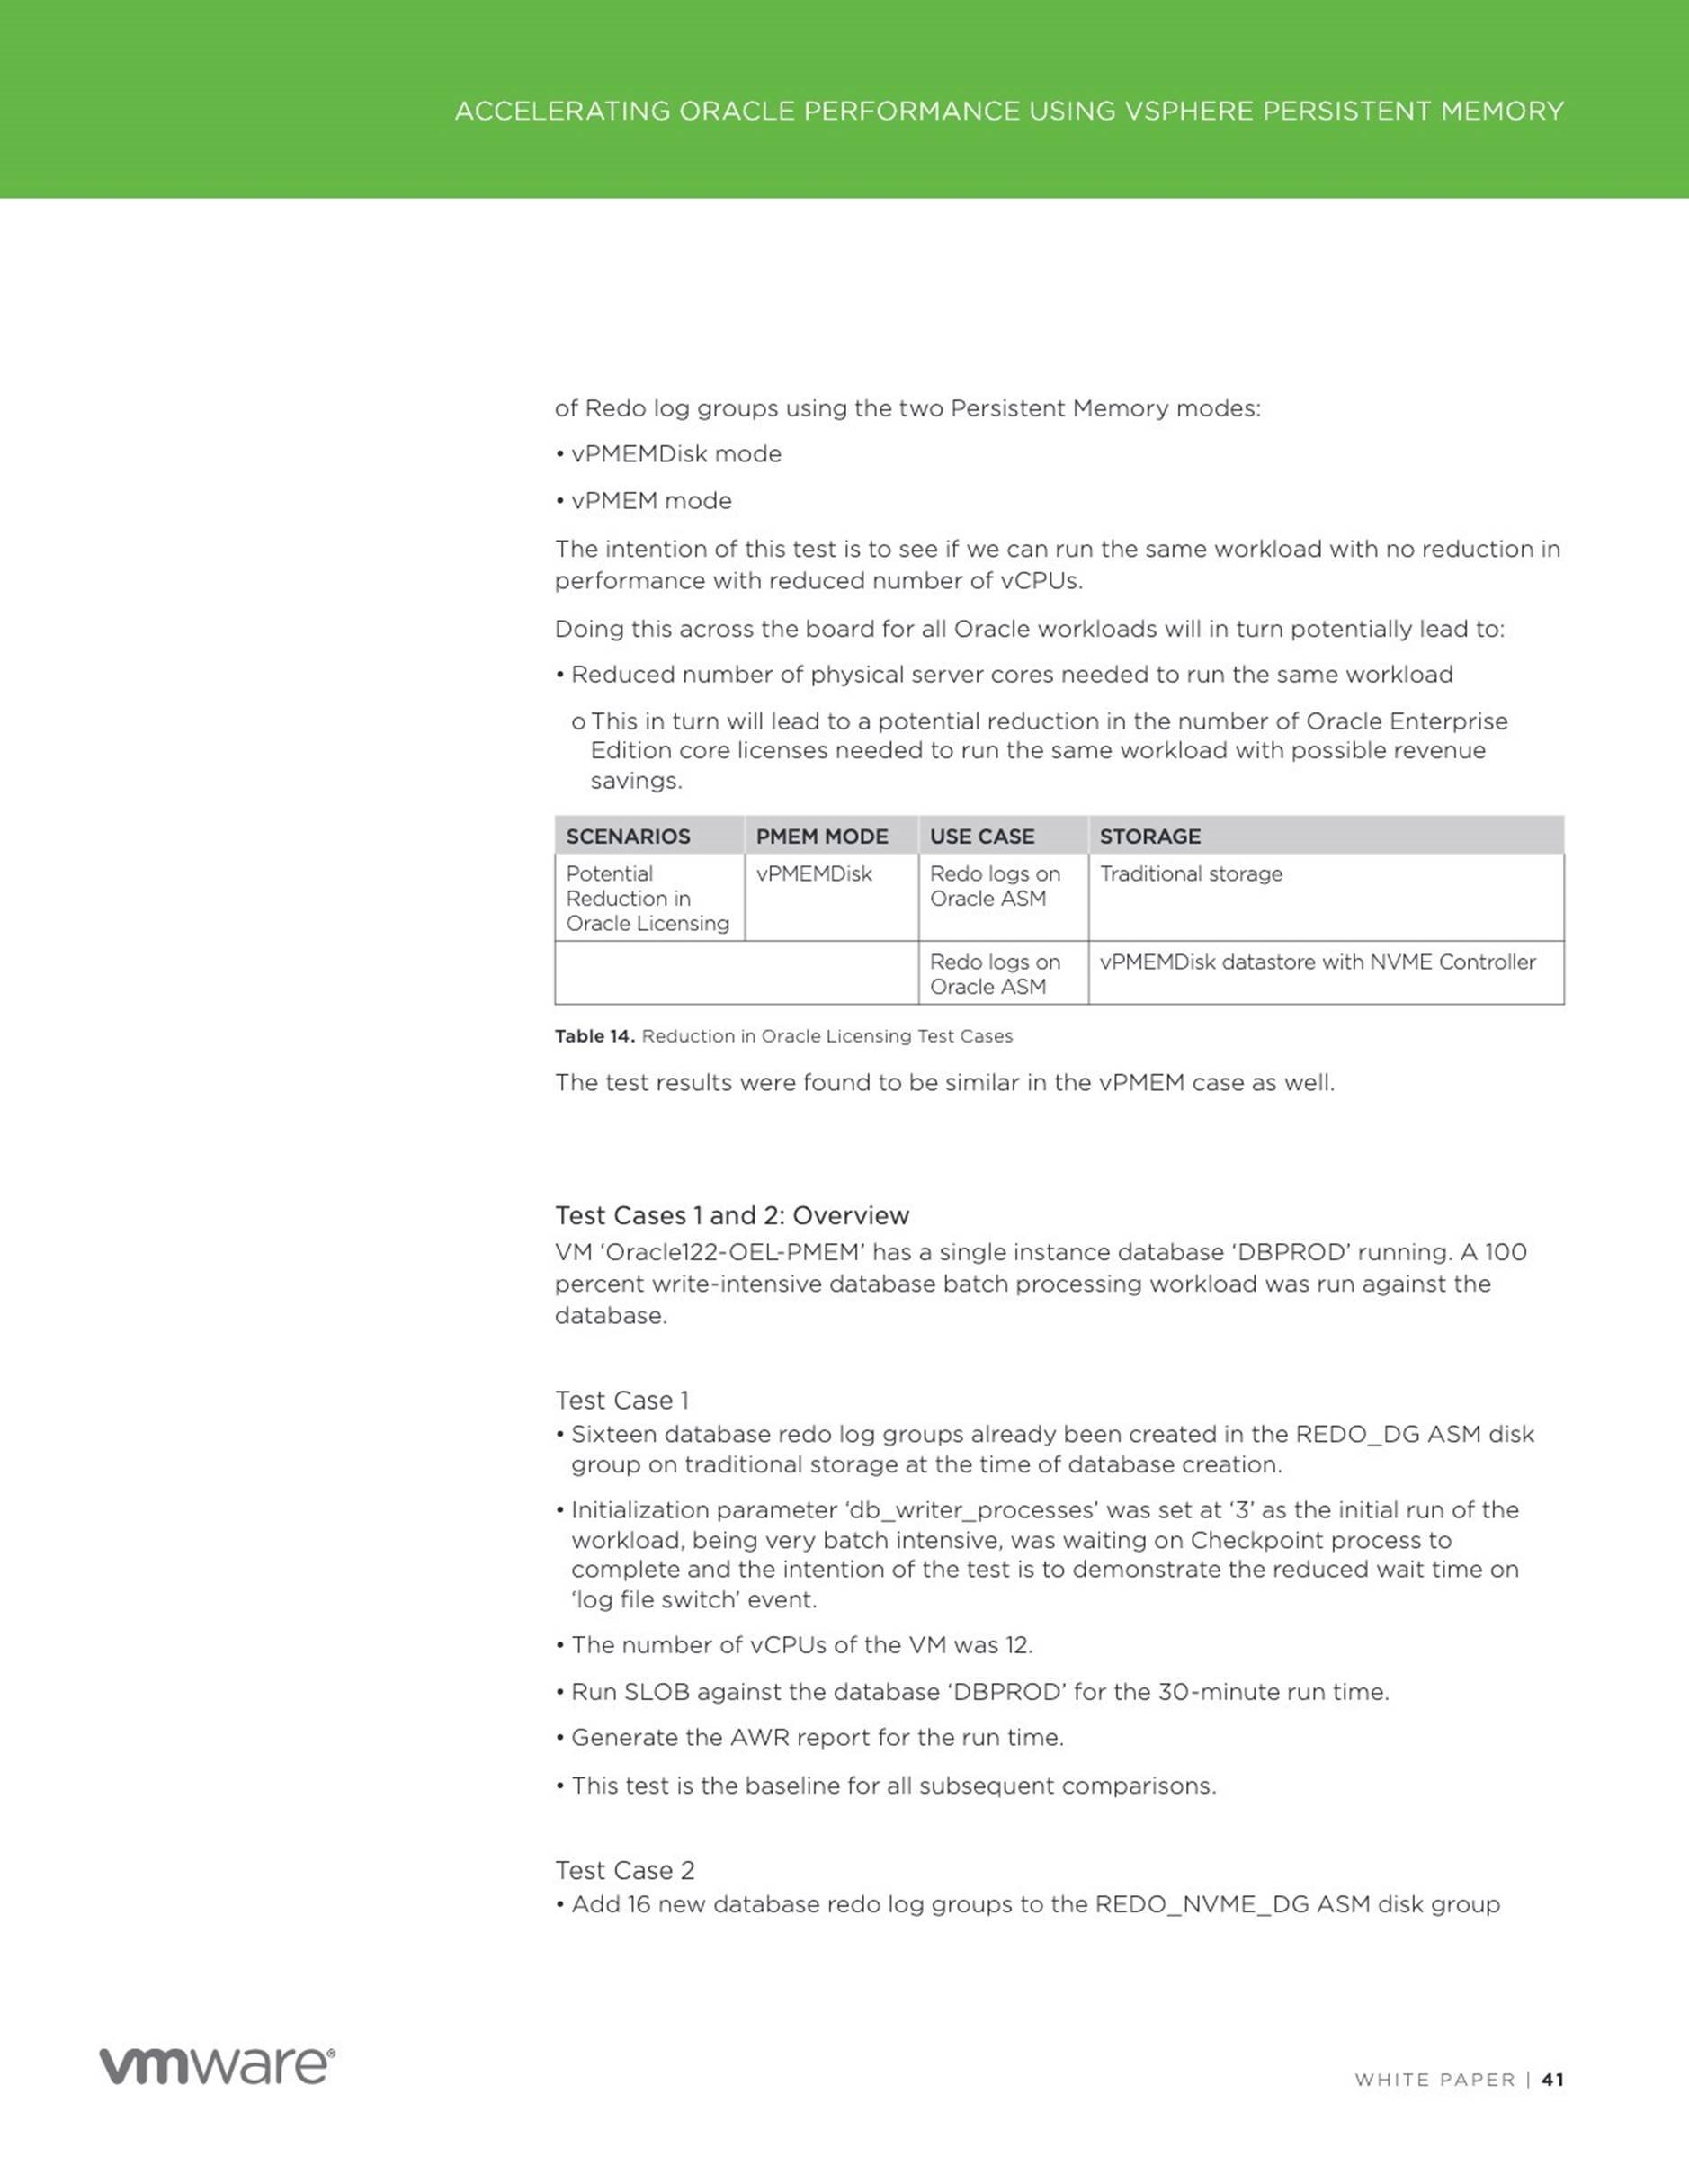
The Accelerating Oracle Performance using vSphere Persistent Memory (PMEM) paper examines the performance of Oracle databases using VMware vSphere 6.7 Persistent Memory feature in different modes for below uses cases for
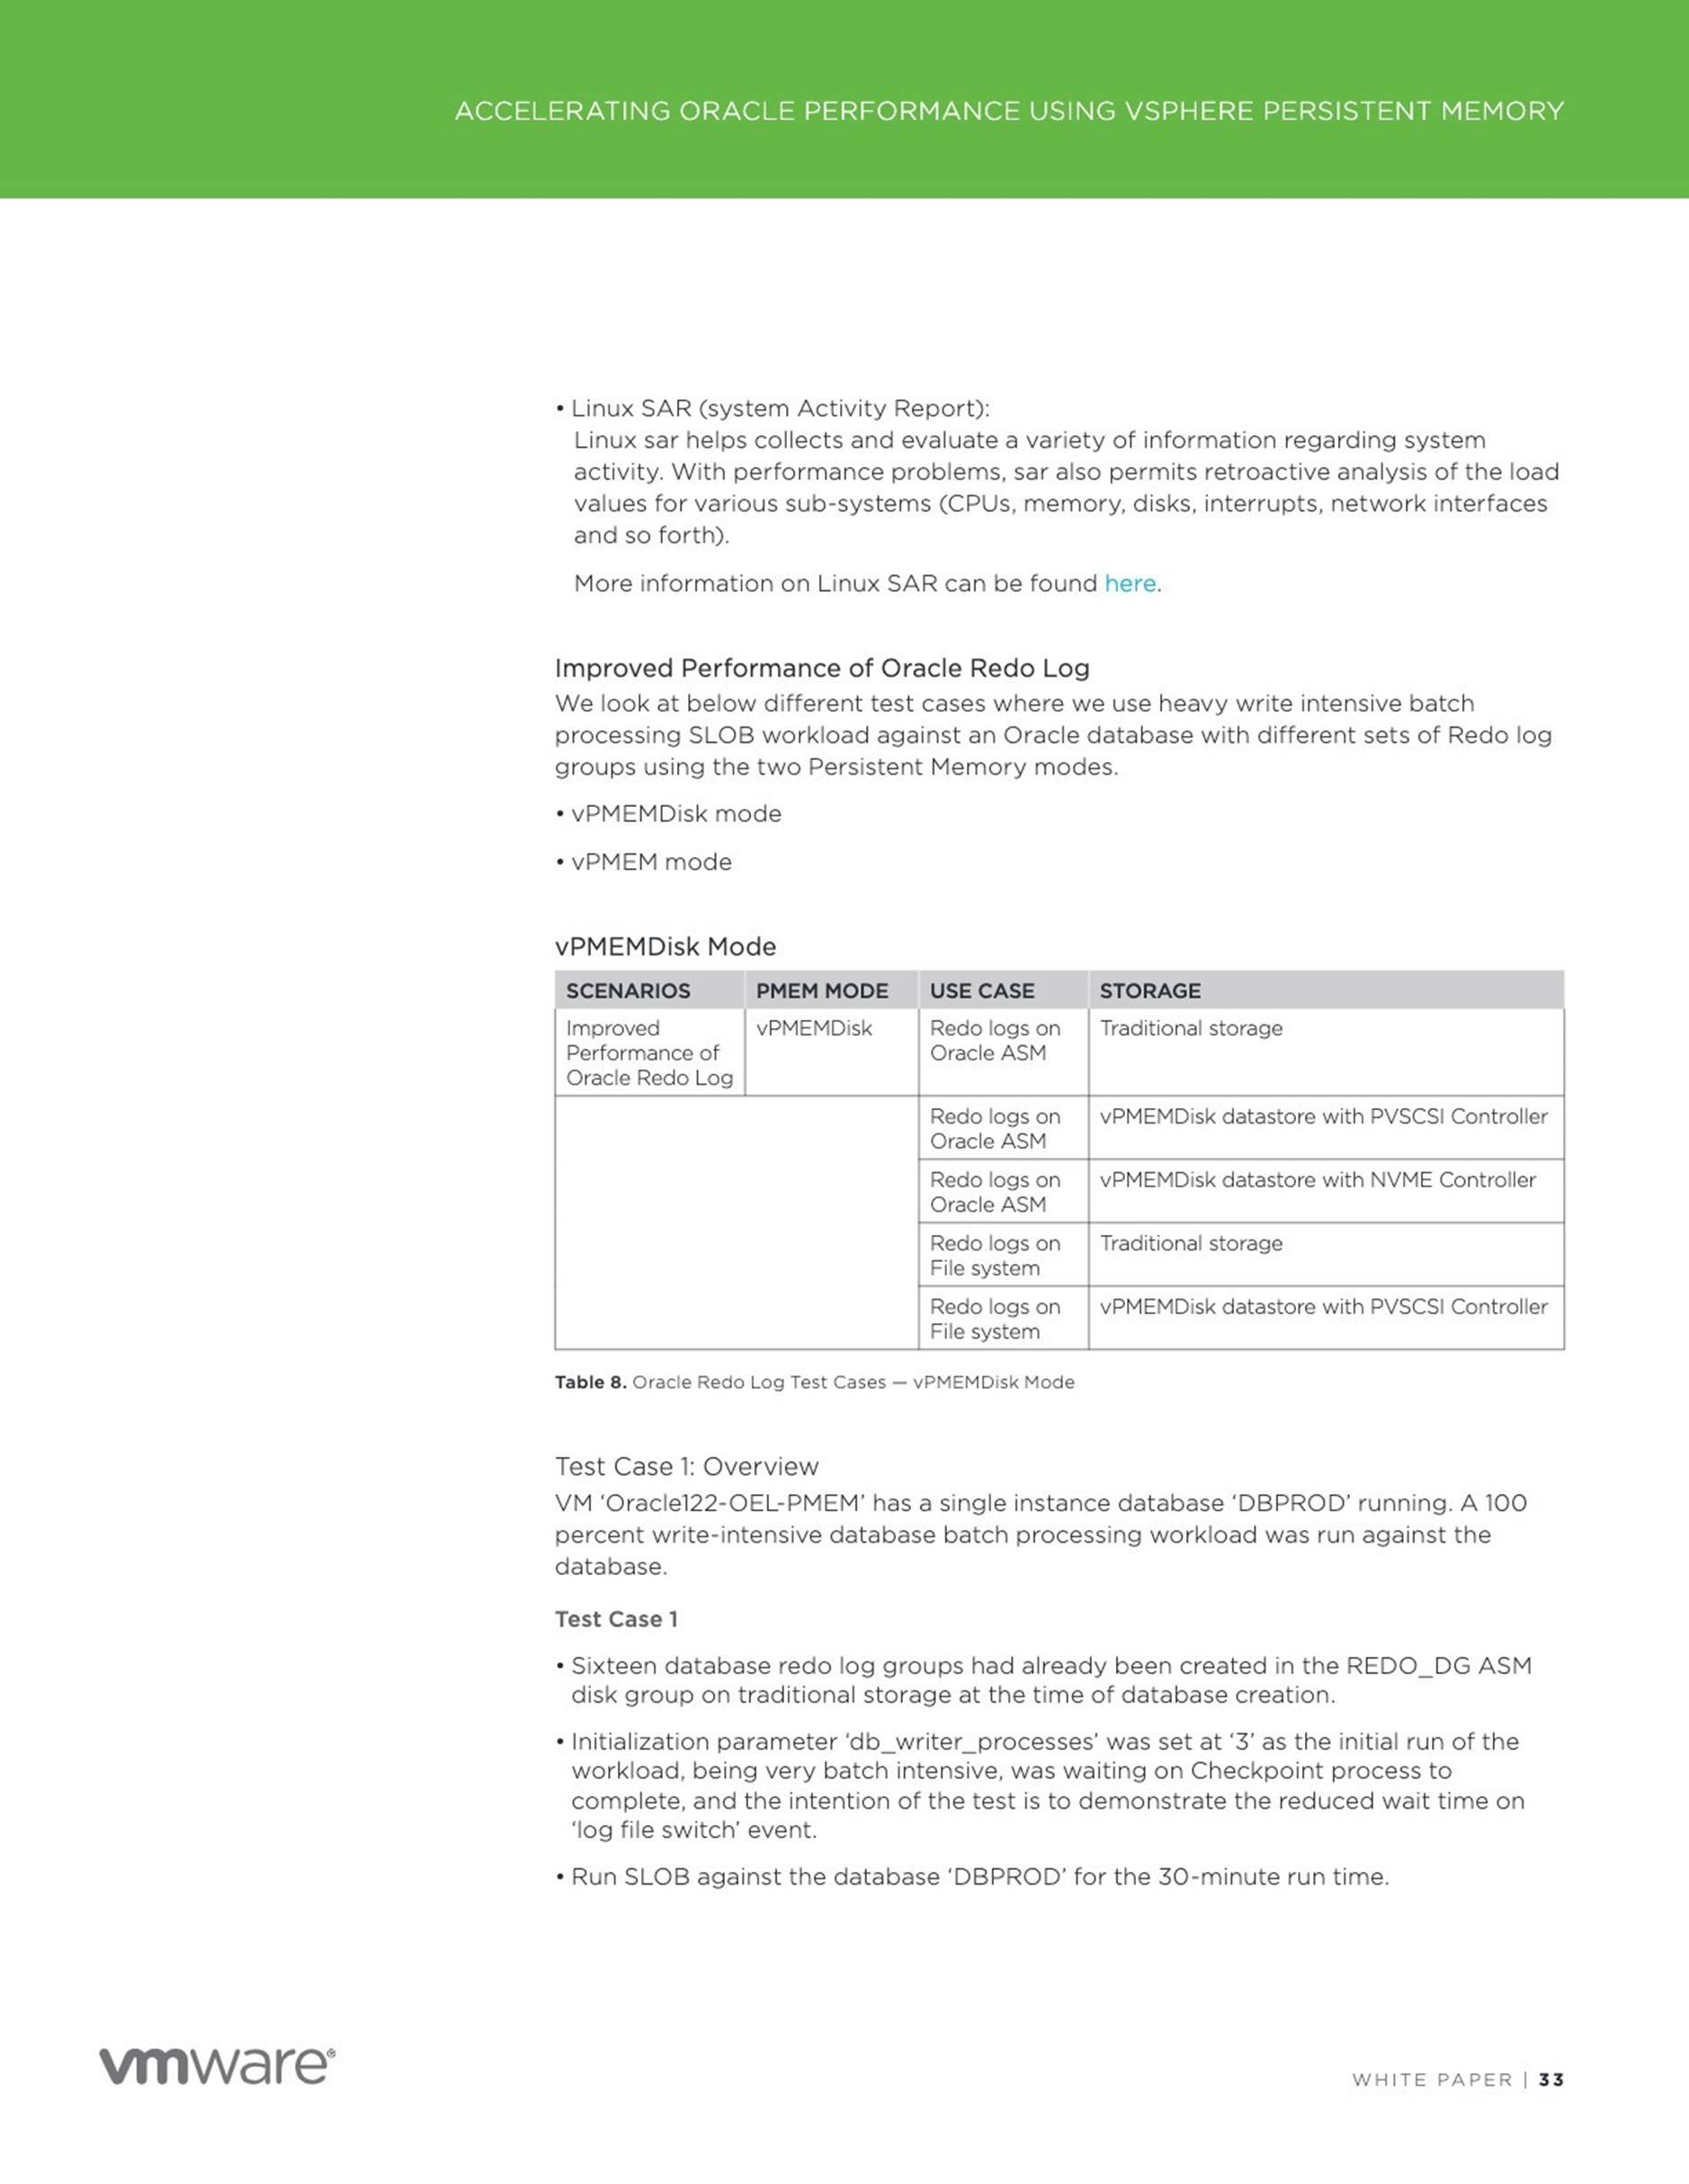
![]() Improved performance of Oracle Redo Log using vPMEM Disk-backed vmdks/vPMEM disks in DAX mode
Improved performance of Oracle Redo Log using vPMEM Disk-backed vmdks/vPMEM disks in DAX mode
Accelerating Performance using Oracle Smart Flash Cache
Potential reduction in Oracle Licensing
In the blog article Oracle and vSphere Persistent Memory (PMEM) – vPMEM v/s vPMEMDisk , we demonstrate the performance improvement in Redo log activity when redo log files are placed on vPMEM Disk-backed vmdks/vPMEM disks in DAX mode over redo logs on vPMEMDisk backed vmdks.
With PMem-aware Redis. By adding very low-overhead journaling to make Redis transactions on persistent memory crash consistent, we were able to reduce the crash recovery time,
We are not able to accelerate the Oracle crash recovery process in the same way as Oracle will still use its proprietary crash recovery mechanism. Oracle recreates the SGA granules on every instance startup , in /dev/shm , and hence even if the old SGA granules are present in PMEM , Oracle disregards it for crash recovery purposes.
Unless the Oracle software code is cognizant of the PMEM device and take advantage of the memory persistence , Oracle crash recovery will continue to function as is without any PMEM advantages.
All Oracle on vSphere white papers including Oracle on VMware vSphere /
VMware vSAN / VMware Cloud on AWS , Best practices, Deployment guides, Workload characterization guide can be found at Oracle on VMware Collateral – One Stop Shop.
Article: https://blogs.vmware.com/apps/2018/11/oracle-and-vspherepersistent-memo…
Date: 2019-05-21
2 Using Persistent Memory with a Virtual Microsoft SQL Server –
vPMem Mode
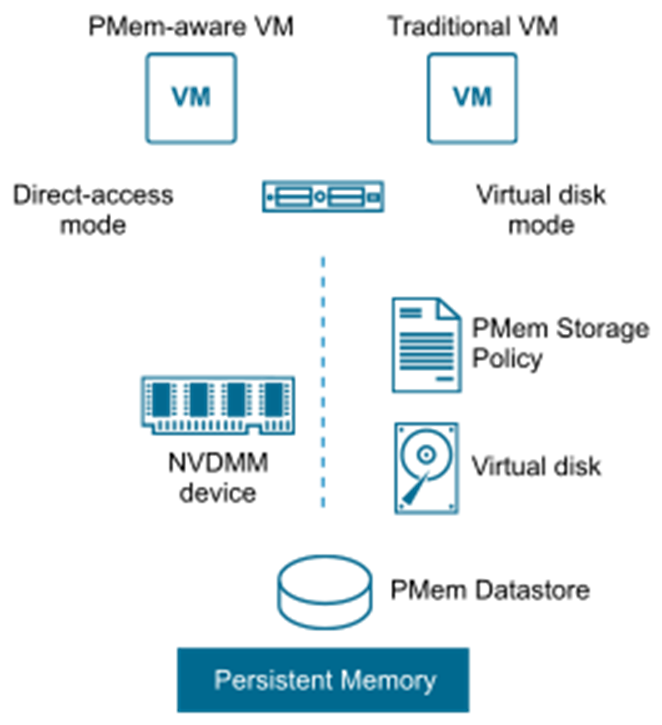
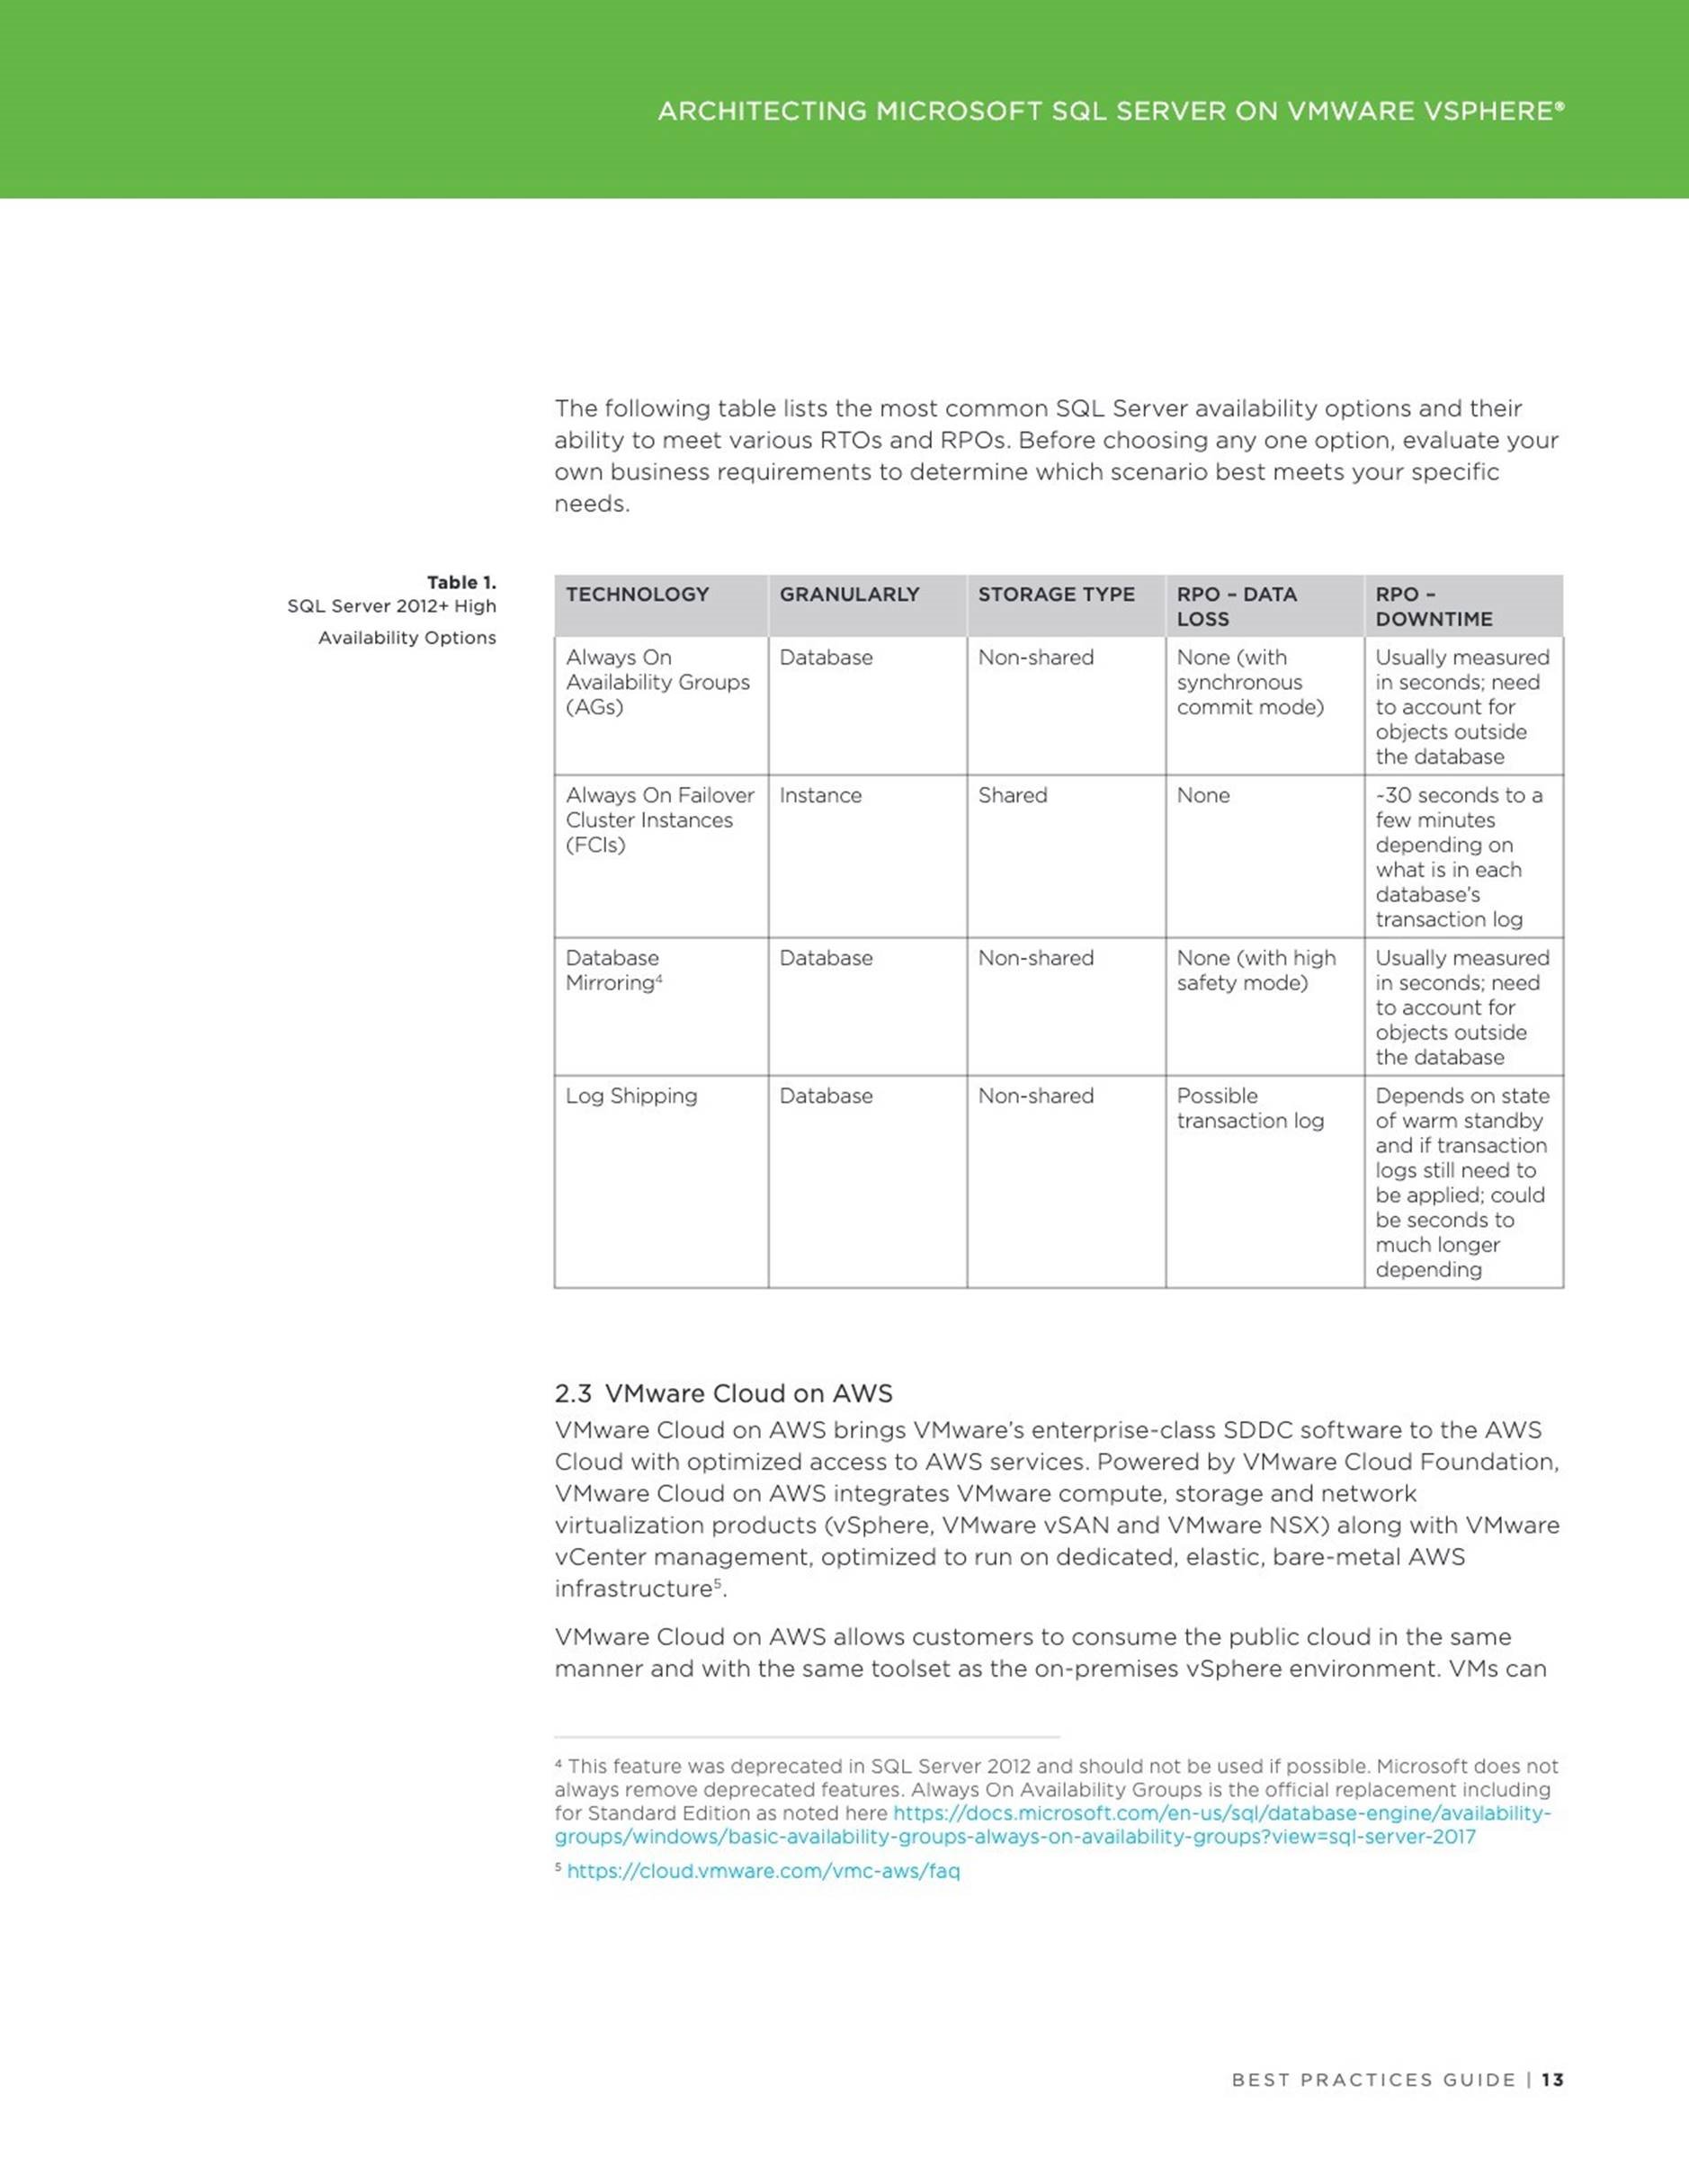
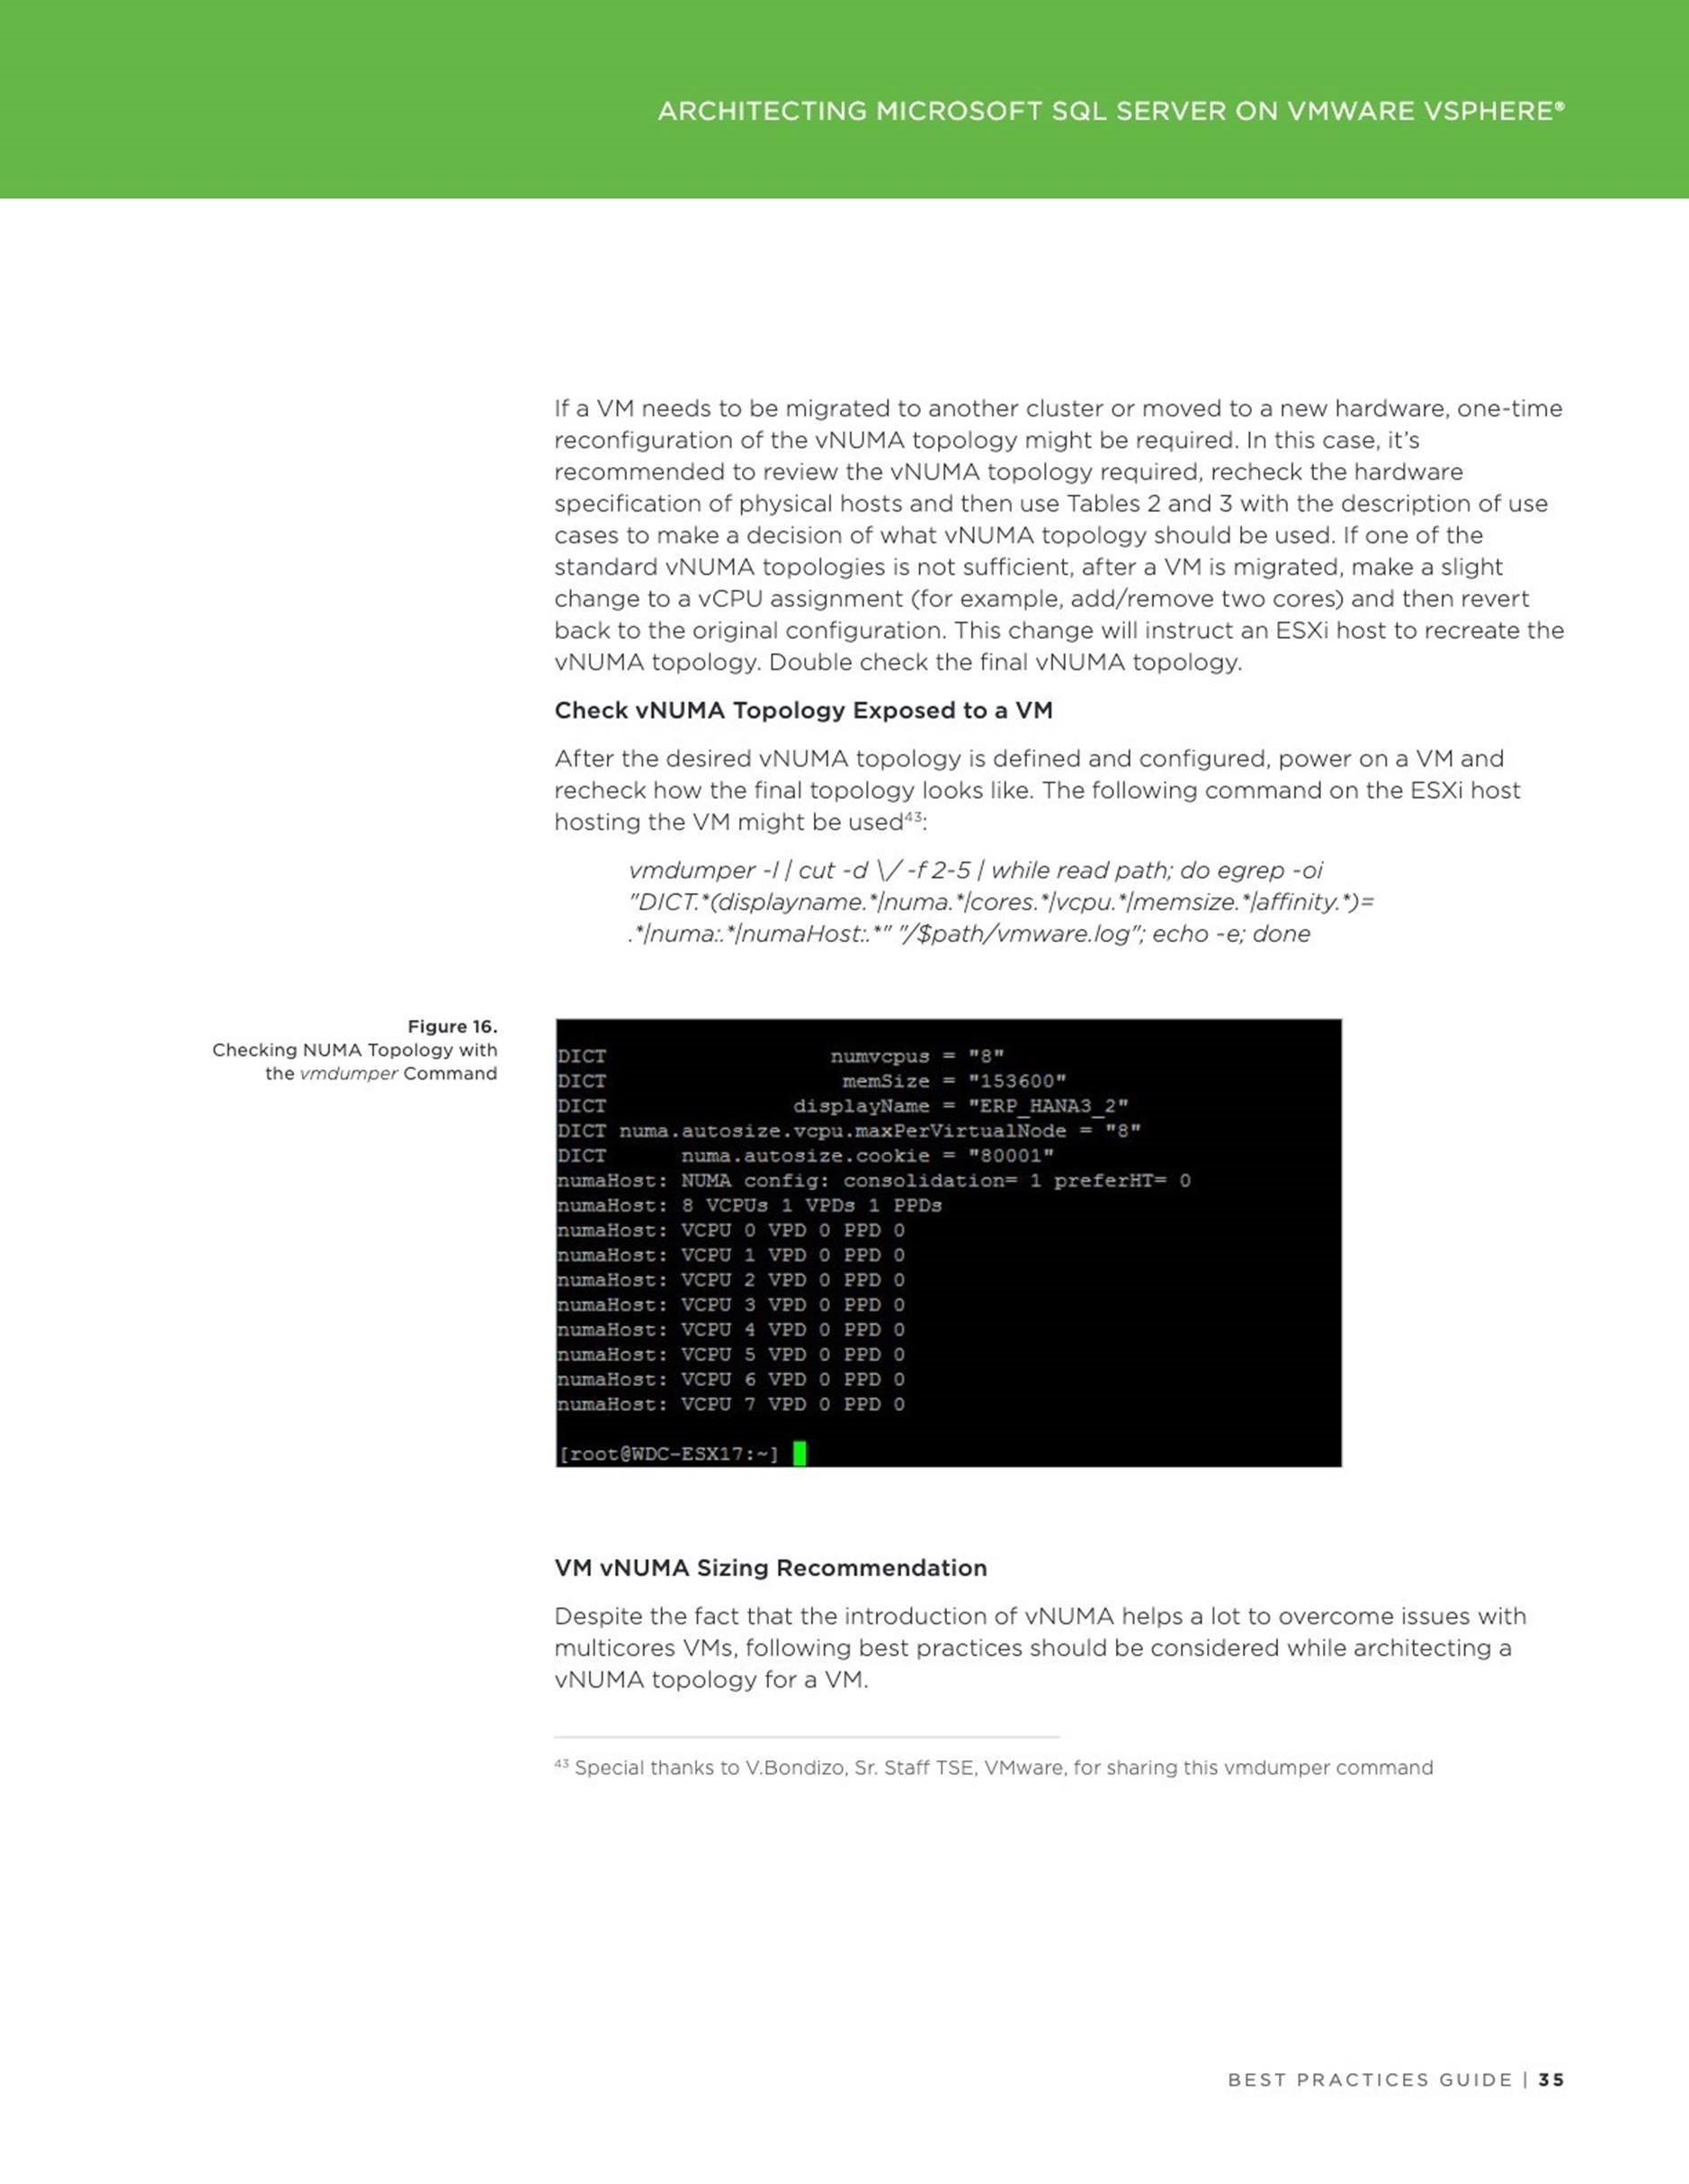
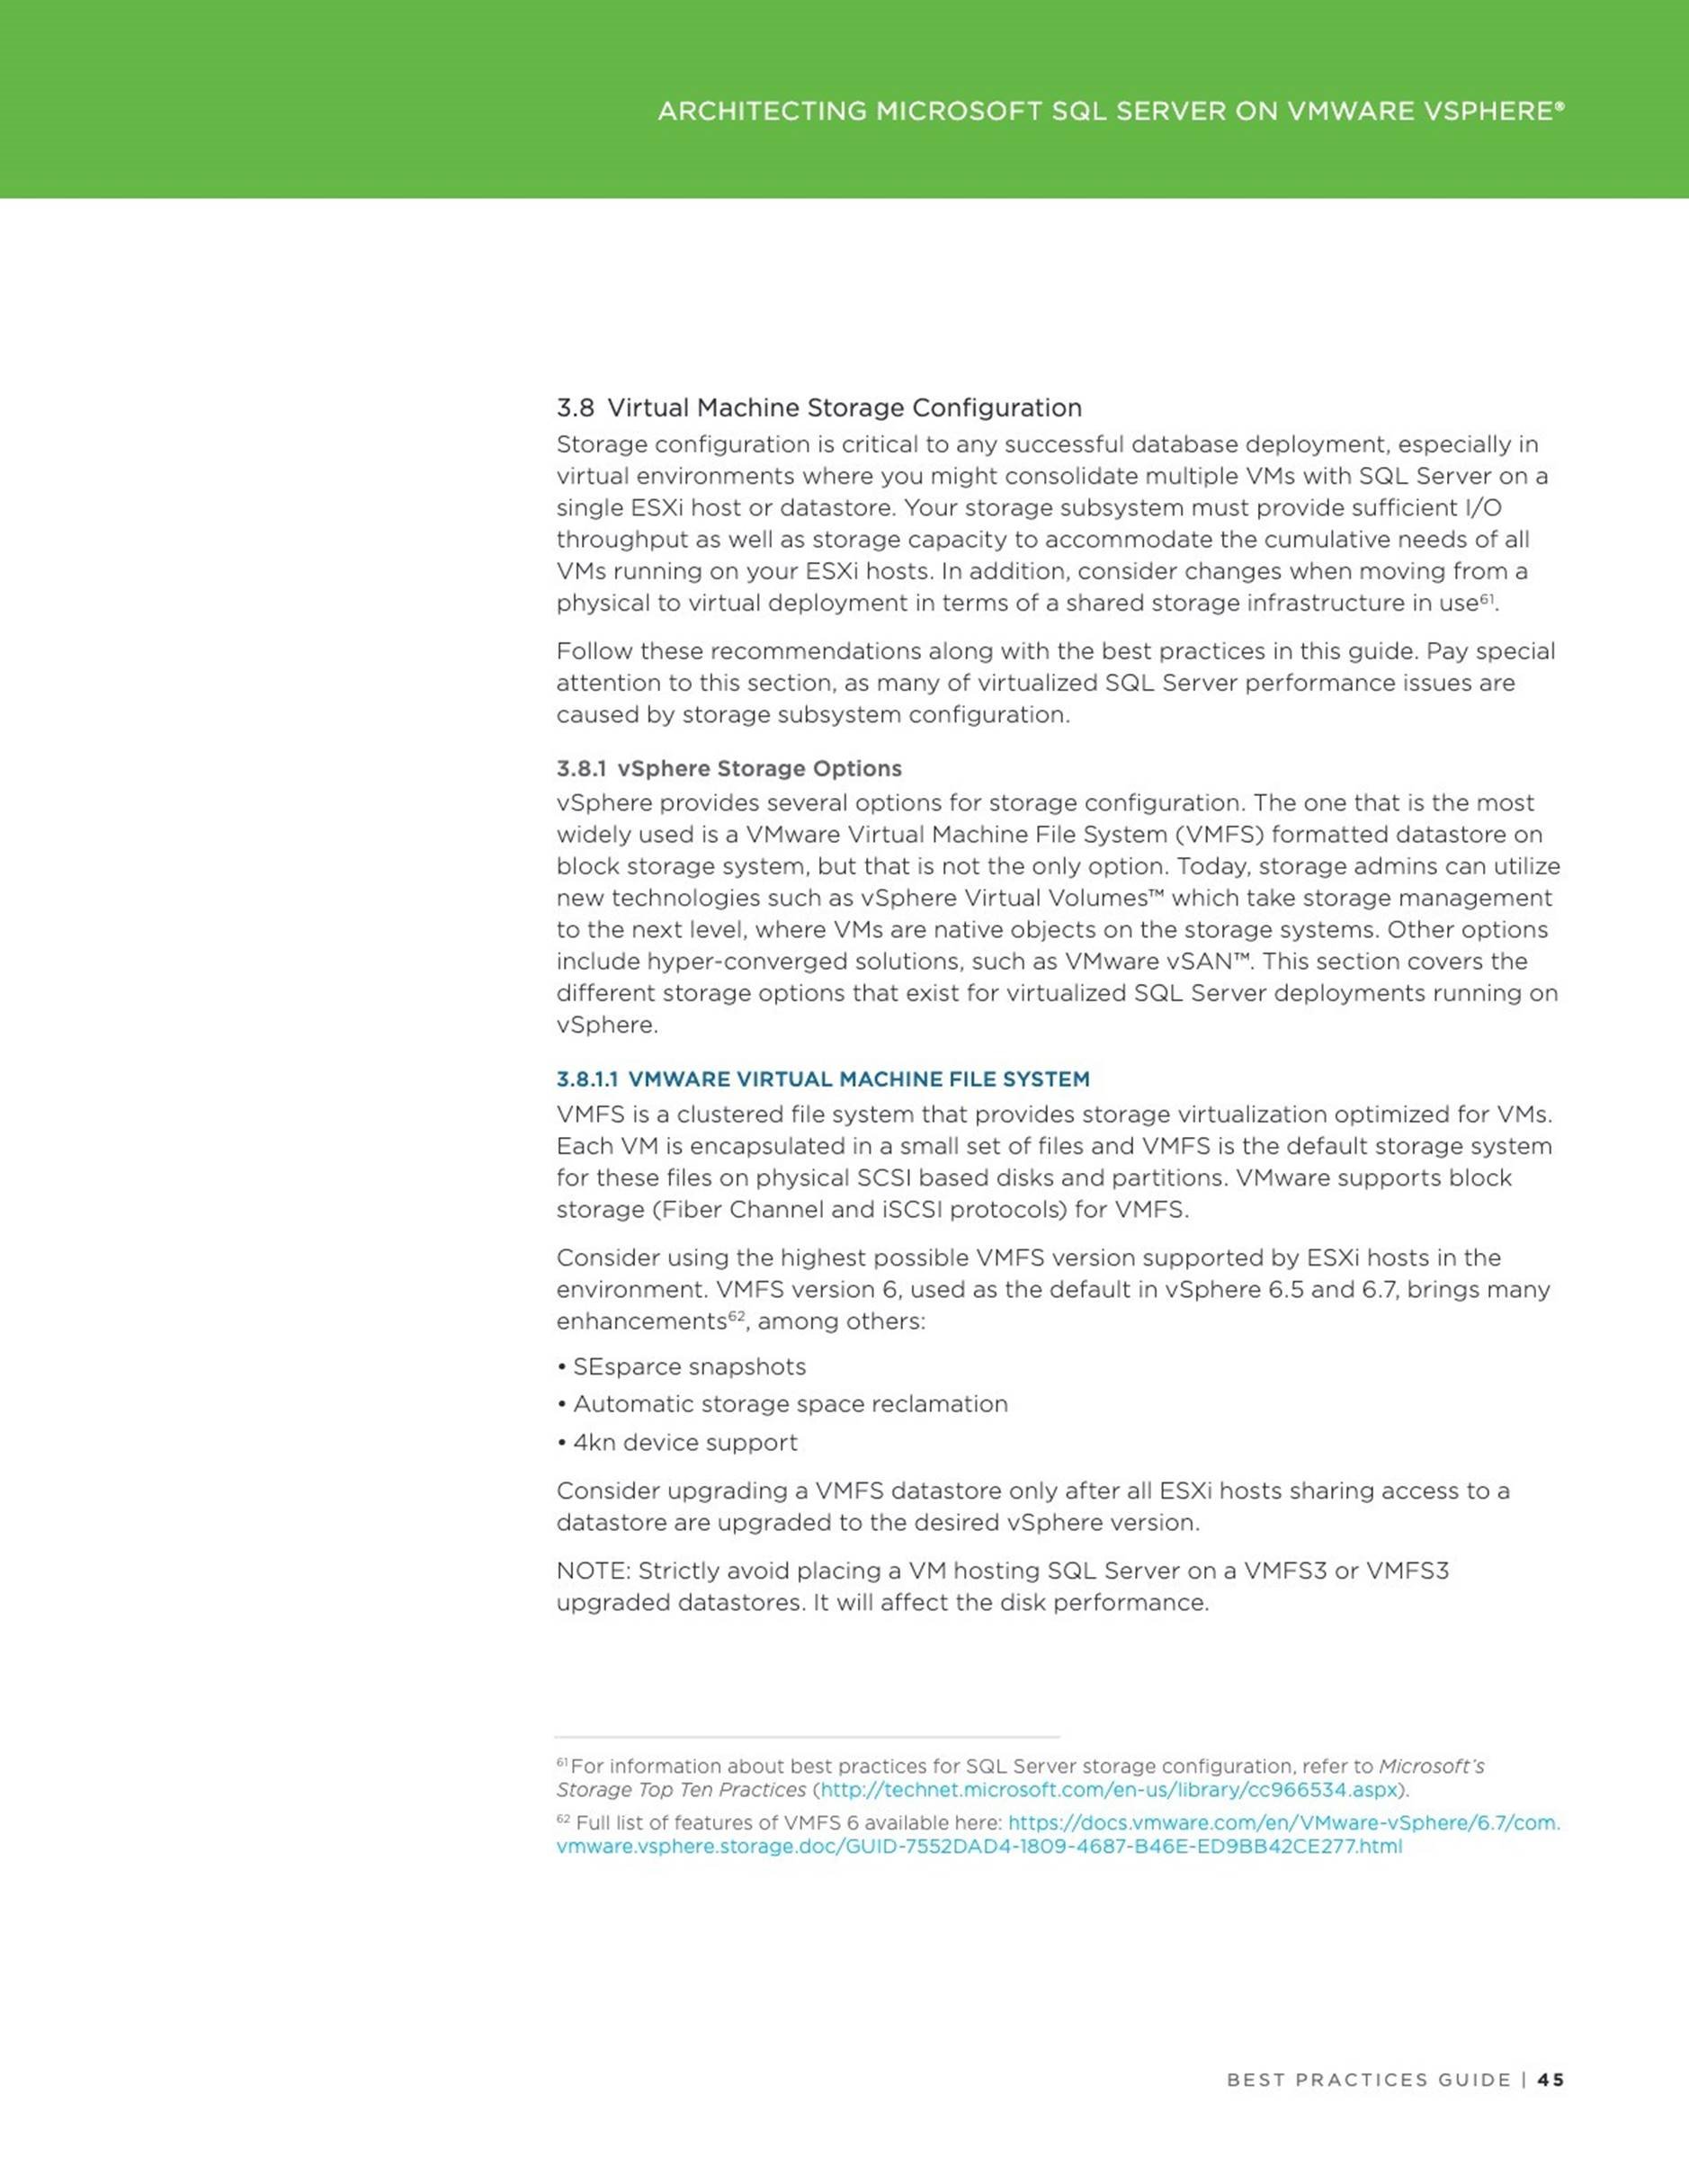
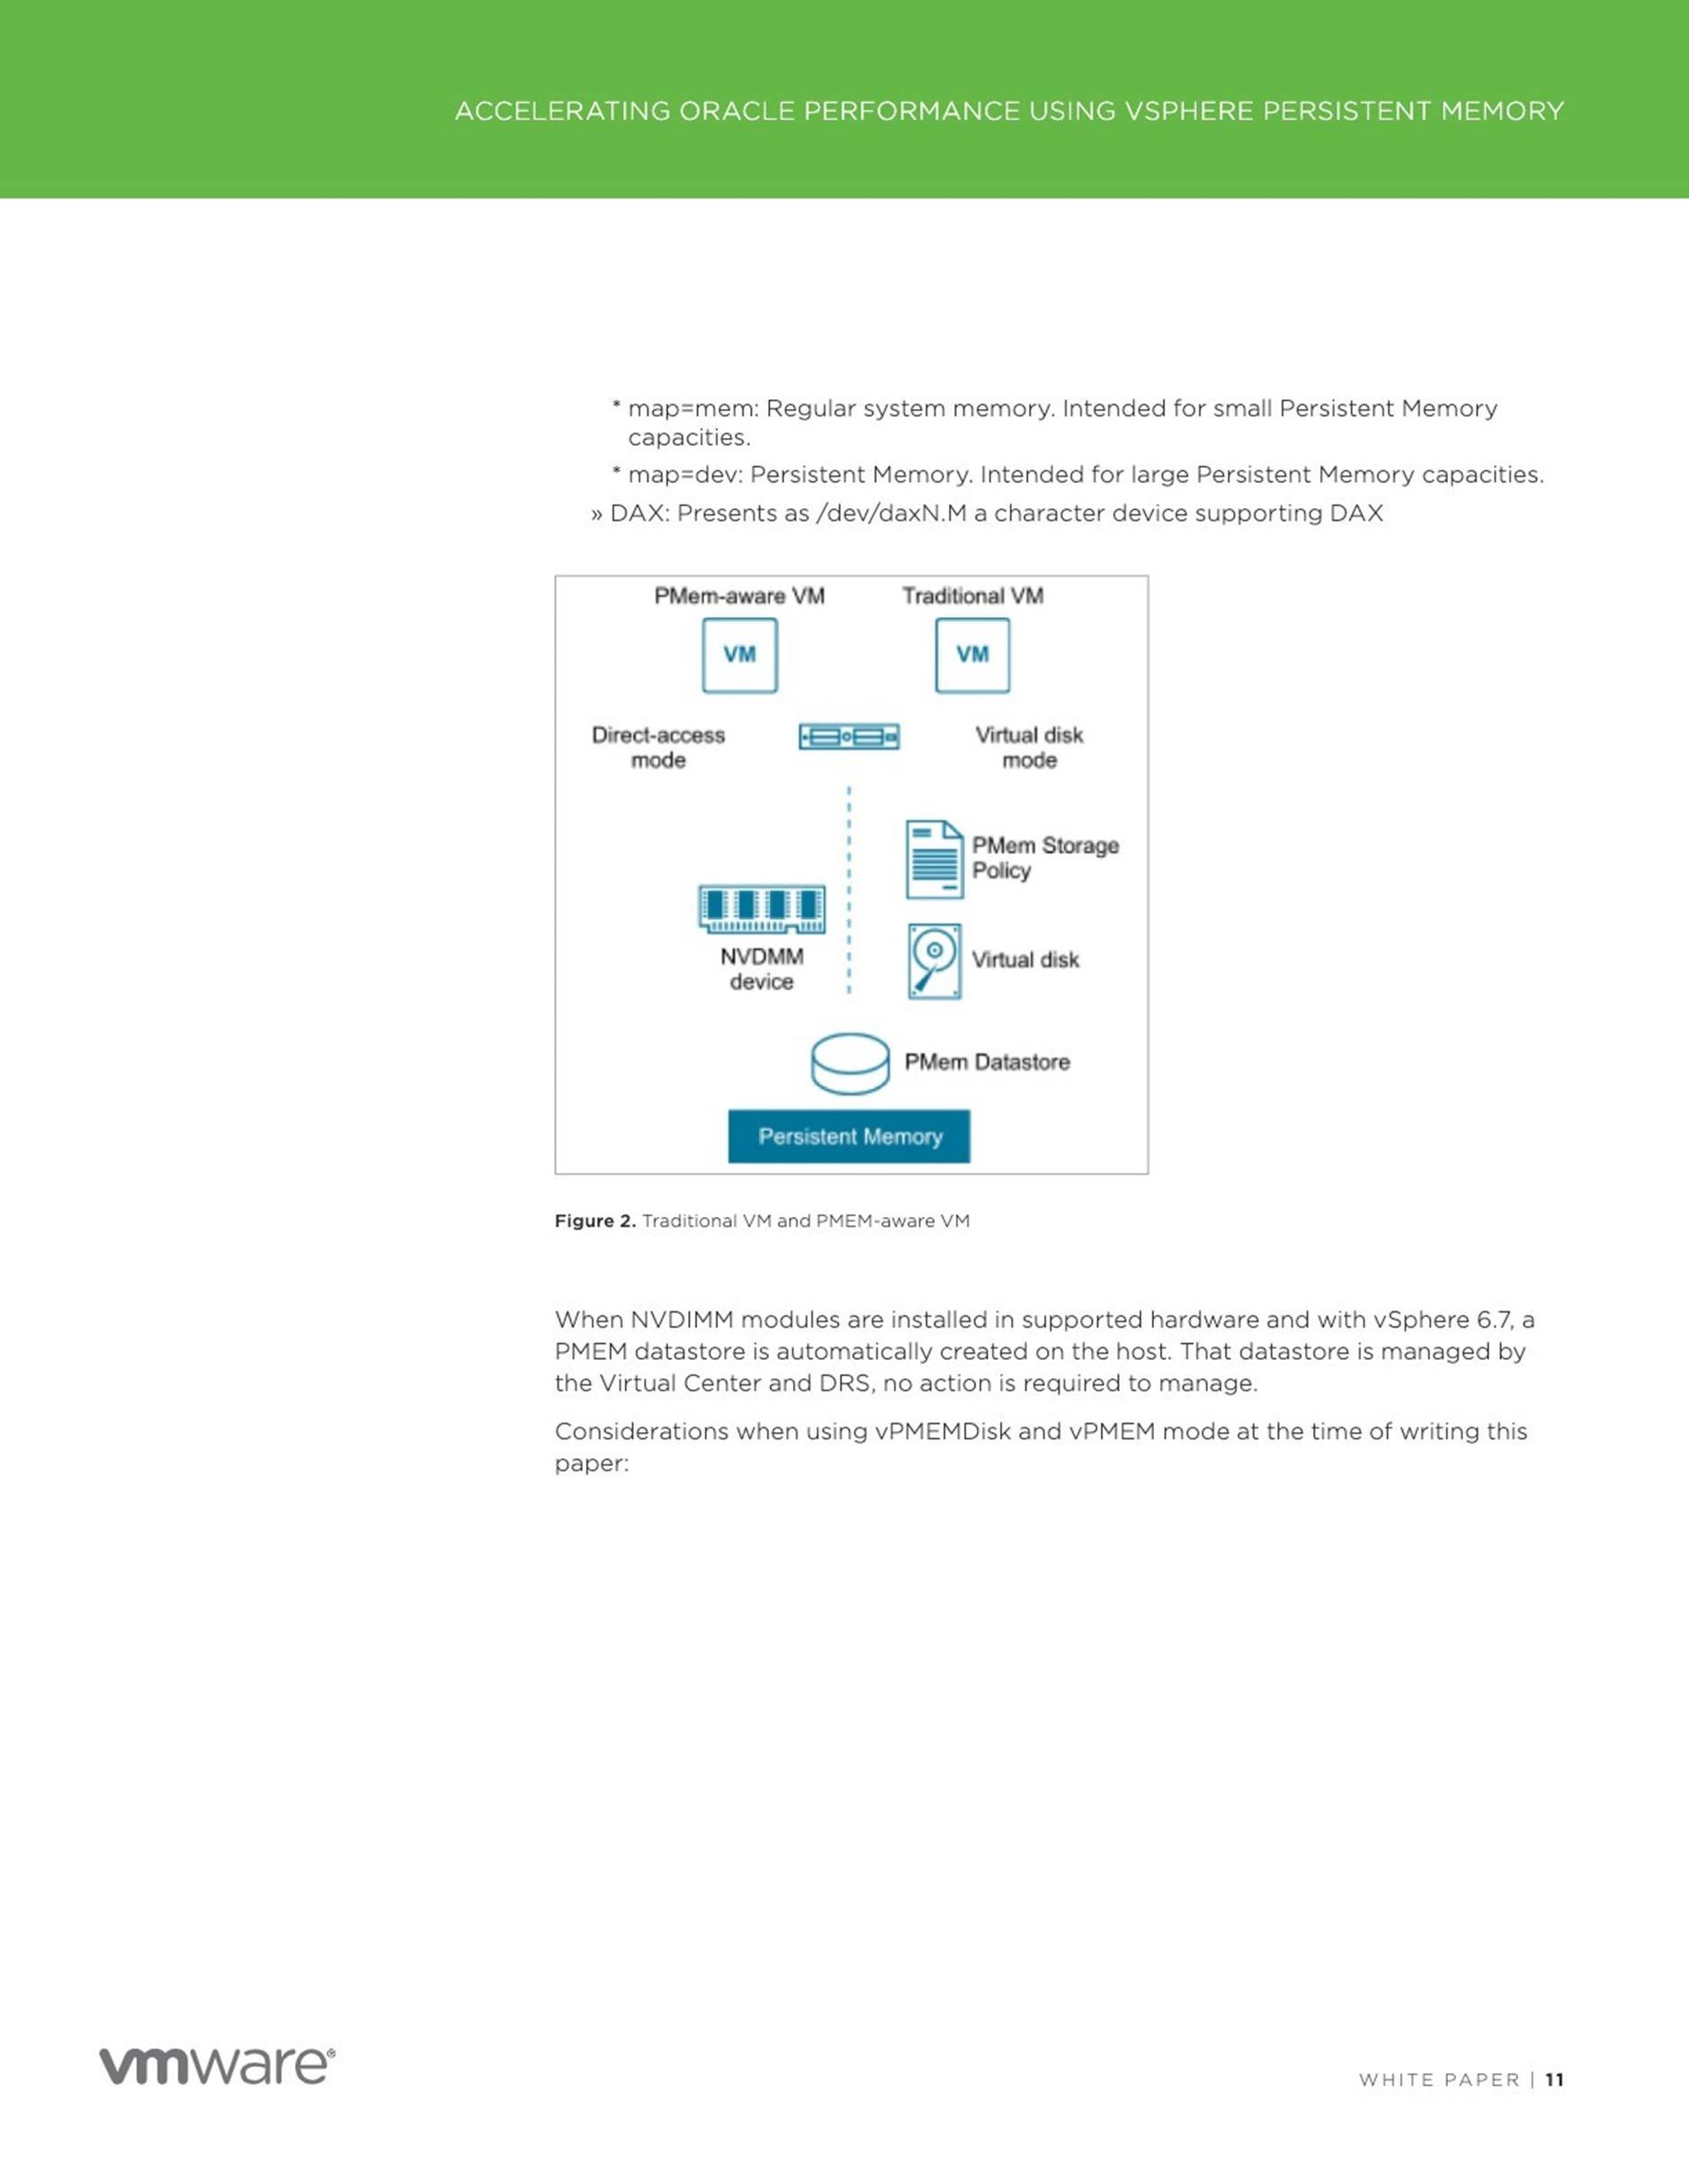
We’re continuing our blog series dedicated to the great persistent memory technology. In the Part I we discussed the way of configuring a PMem device on an ESXi host. In this part we will cover how an instance of Microsoft SQL Server (further referenced as SQL Server) can consume virtual NVDIMM device in vPMem (Direct-access mode, shown on the left in the figure below).
The vPMem mode provides the best way to consume a NVDIMM device by an instance of SQL Server running on a virtual machine (VM), but has number of prerequisites:
![]() Virtual Machine must have compatibility mode set to the hardware version
Virtual Machine must have compatibility mode set to the hardware version
14. The VM cannot be run on any ESXi host with the version 6.5 or above.
ESXi host hosting a VM must be on the vSphere version 6.7 or above.
Guest operating system must support NVDIMM in so called DAX mode. This support for Windows operating system was introduced starting with Windows Server 2016.
![]()
SQL Server must support the DAX-mode enabled device. This support was introduced by SQL Server 2016 SP1.
If all prerequisites are in place, a SQL Server database can be configured to use the “tail-of-log-cache” feature, when one of the database log flies is placed on a virtual NVDIMM device, providing significant performance improvement especially for In-memory optimized databases as shown here and here. Let us explore, how to configure the “tail-of-log-cache” SQL Server feature on the vSphere platform.
Adding NVDIMM to a VM
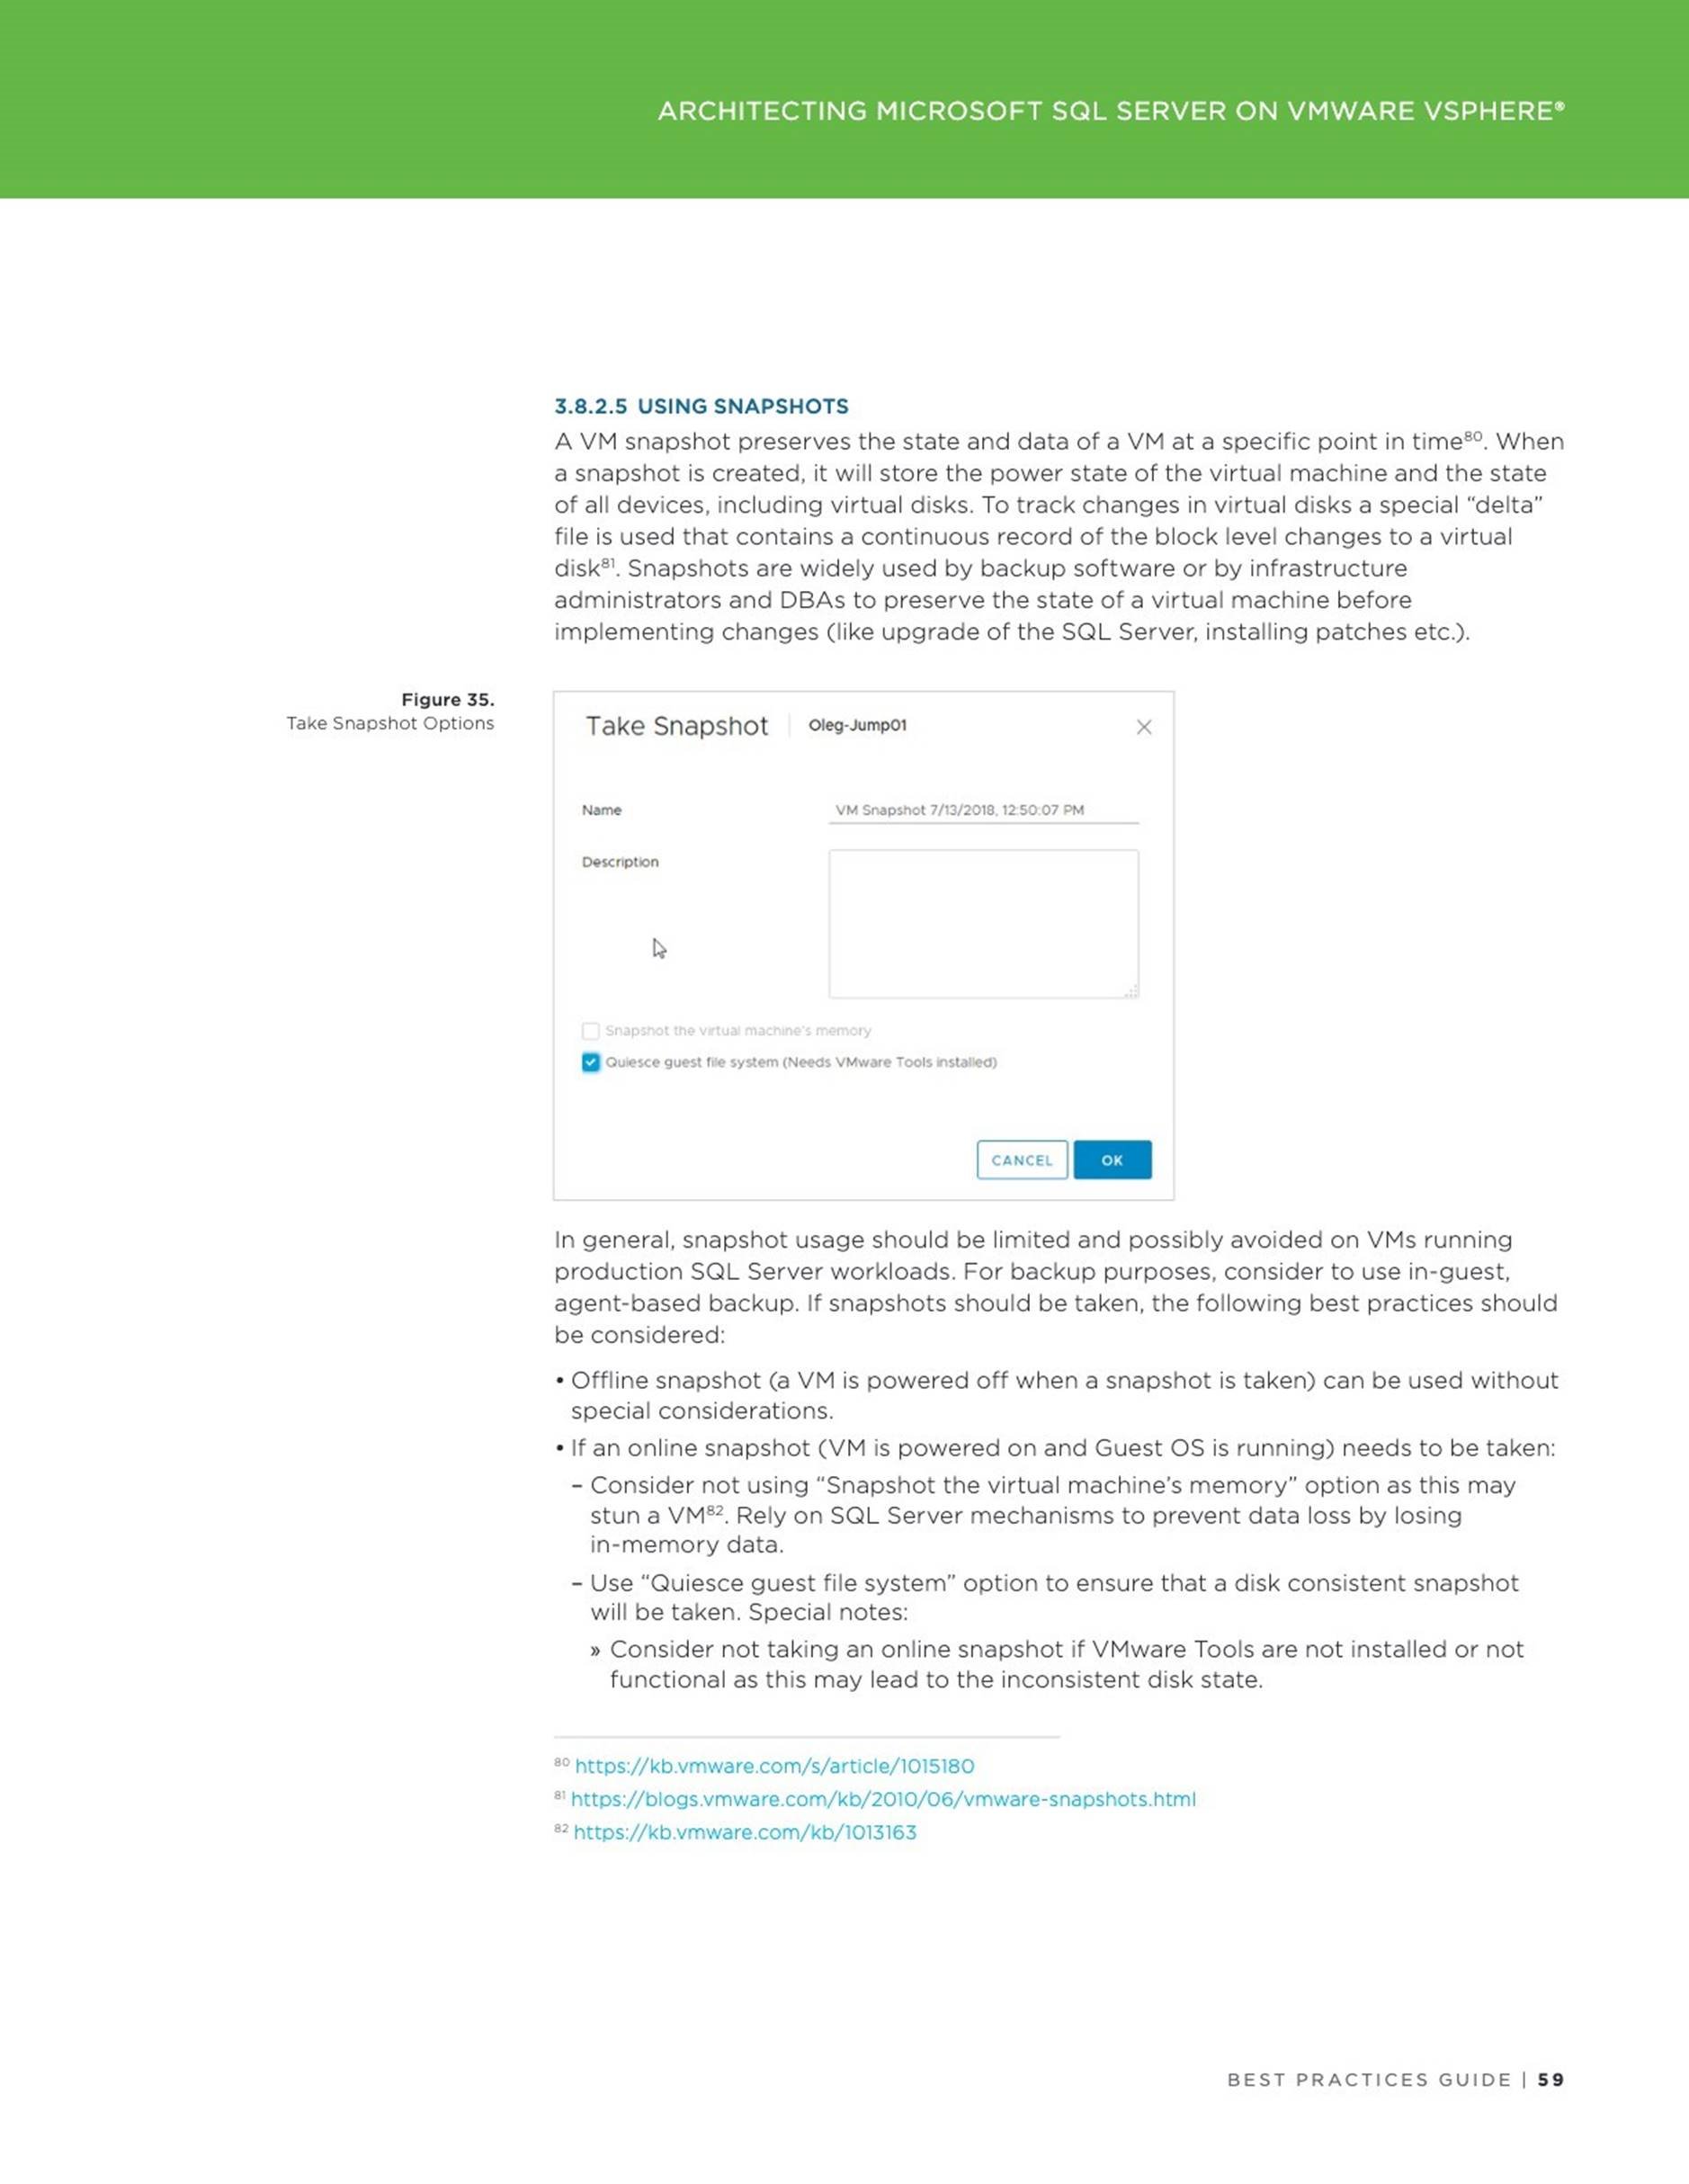
First, a VM must be created or already existing VM might be taken (check prerequisites below in this case carefully). The VM must be powered off in order to add a virtual NVDIMM device. Use vSphere (HTML5) Client, navigate to the VM and select Edit in the drop-down menu. Select NVDIMM from the “Add new device” list:
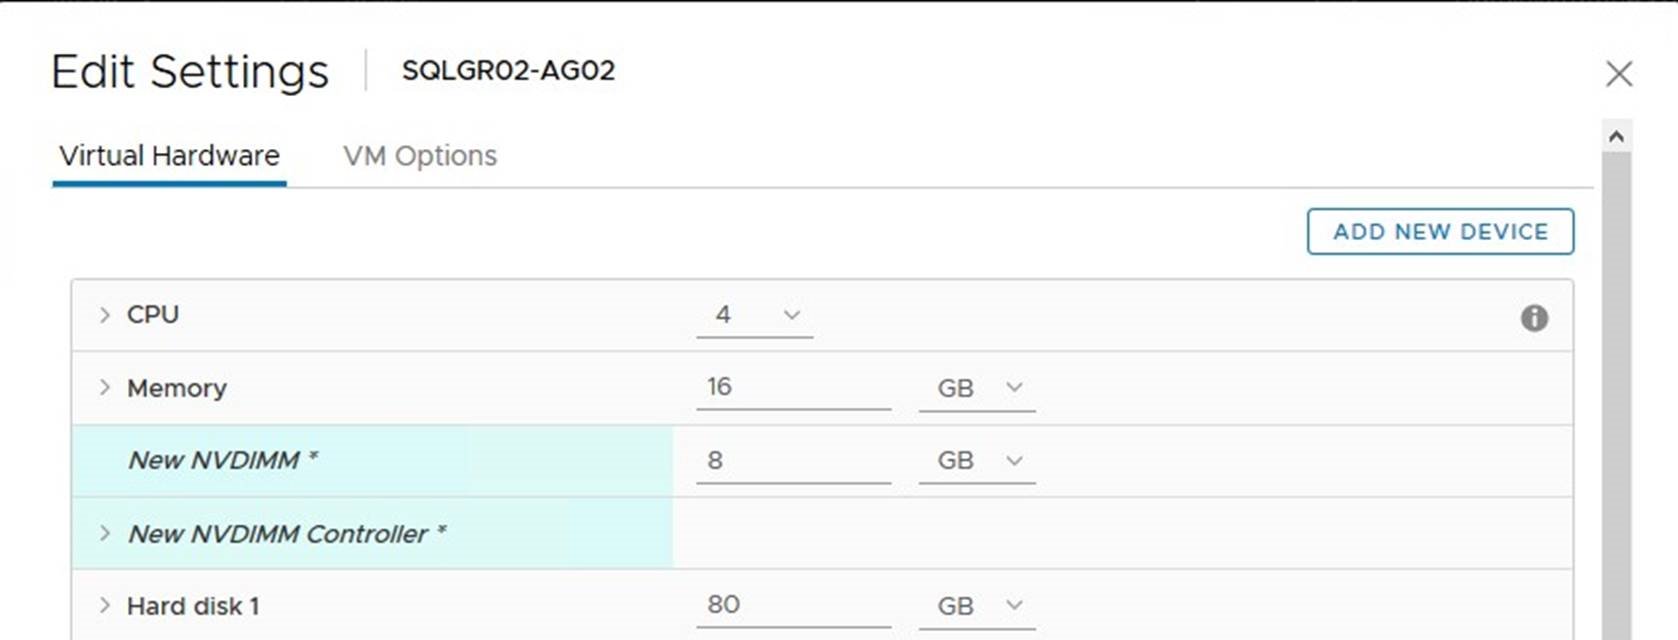
Specify the size of the vPMem device to be present. Virtual NVDIMM controller will be created automatically.
NOTE: The recommended vPMem size is 256 MB. SQL Server is using only 20 MB to allocate “tail-of-log-cache” and 256MB is the minimum requirement for a GPT partition, which is a prerequisites for creating a DAX volume.
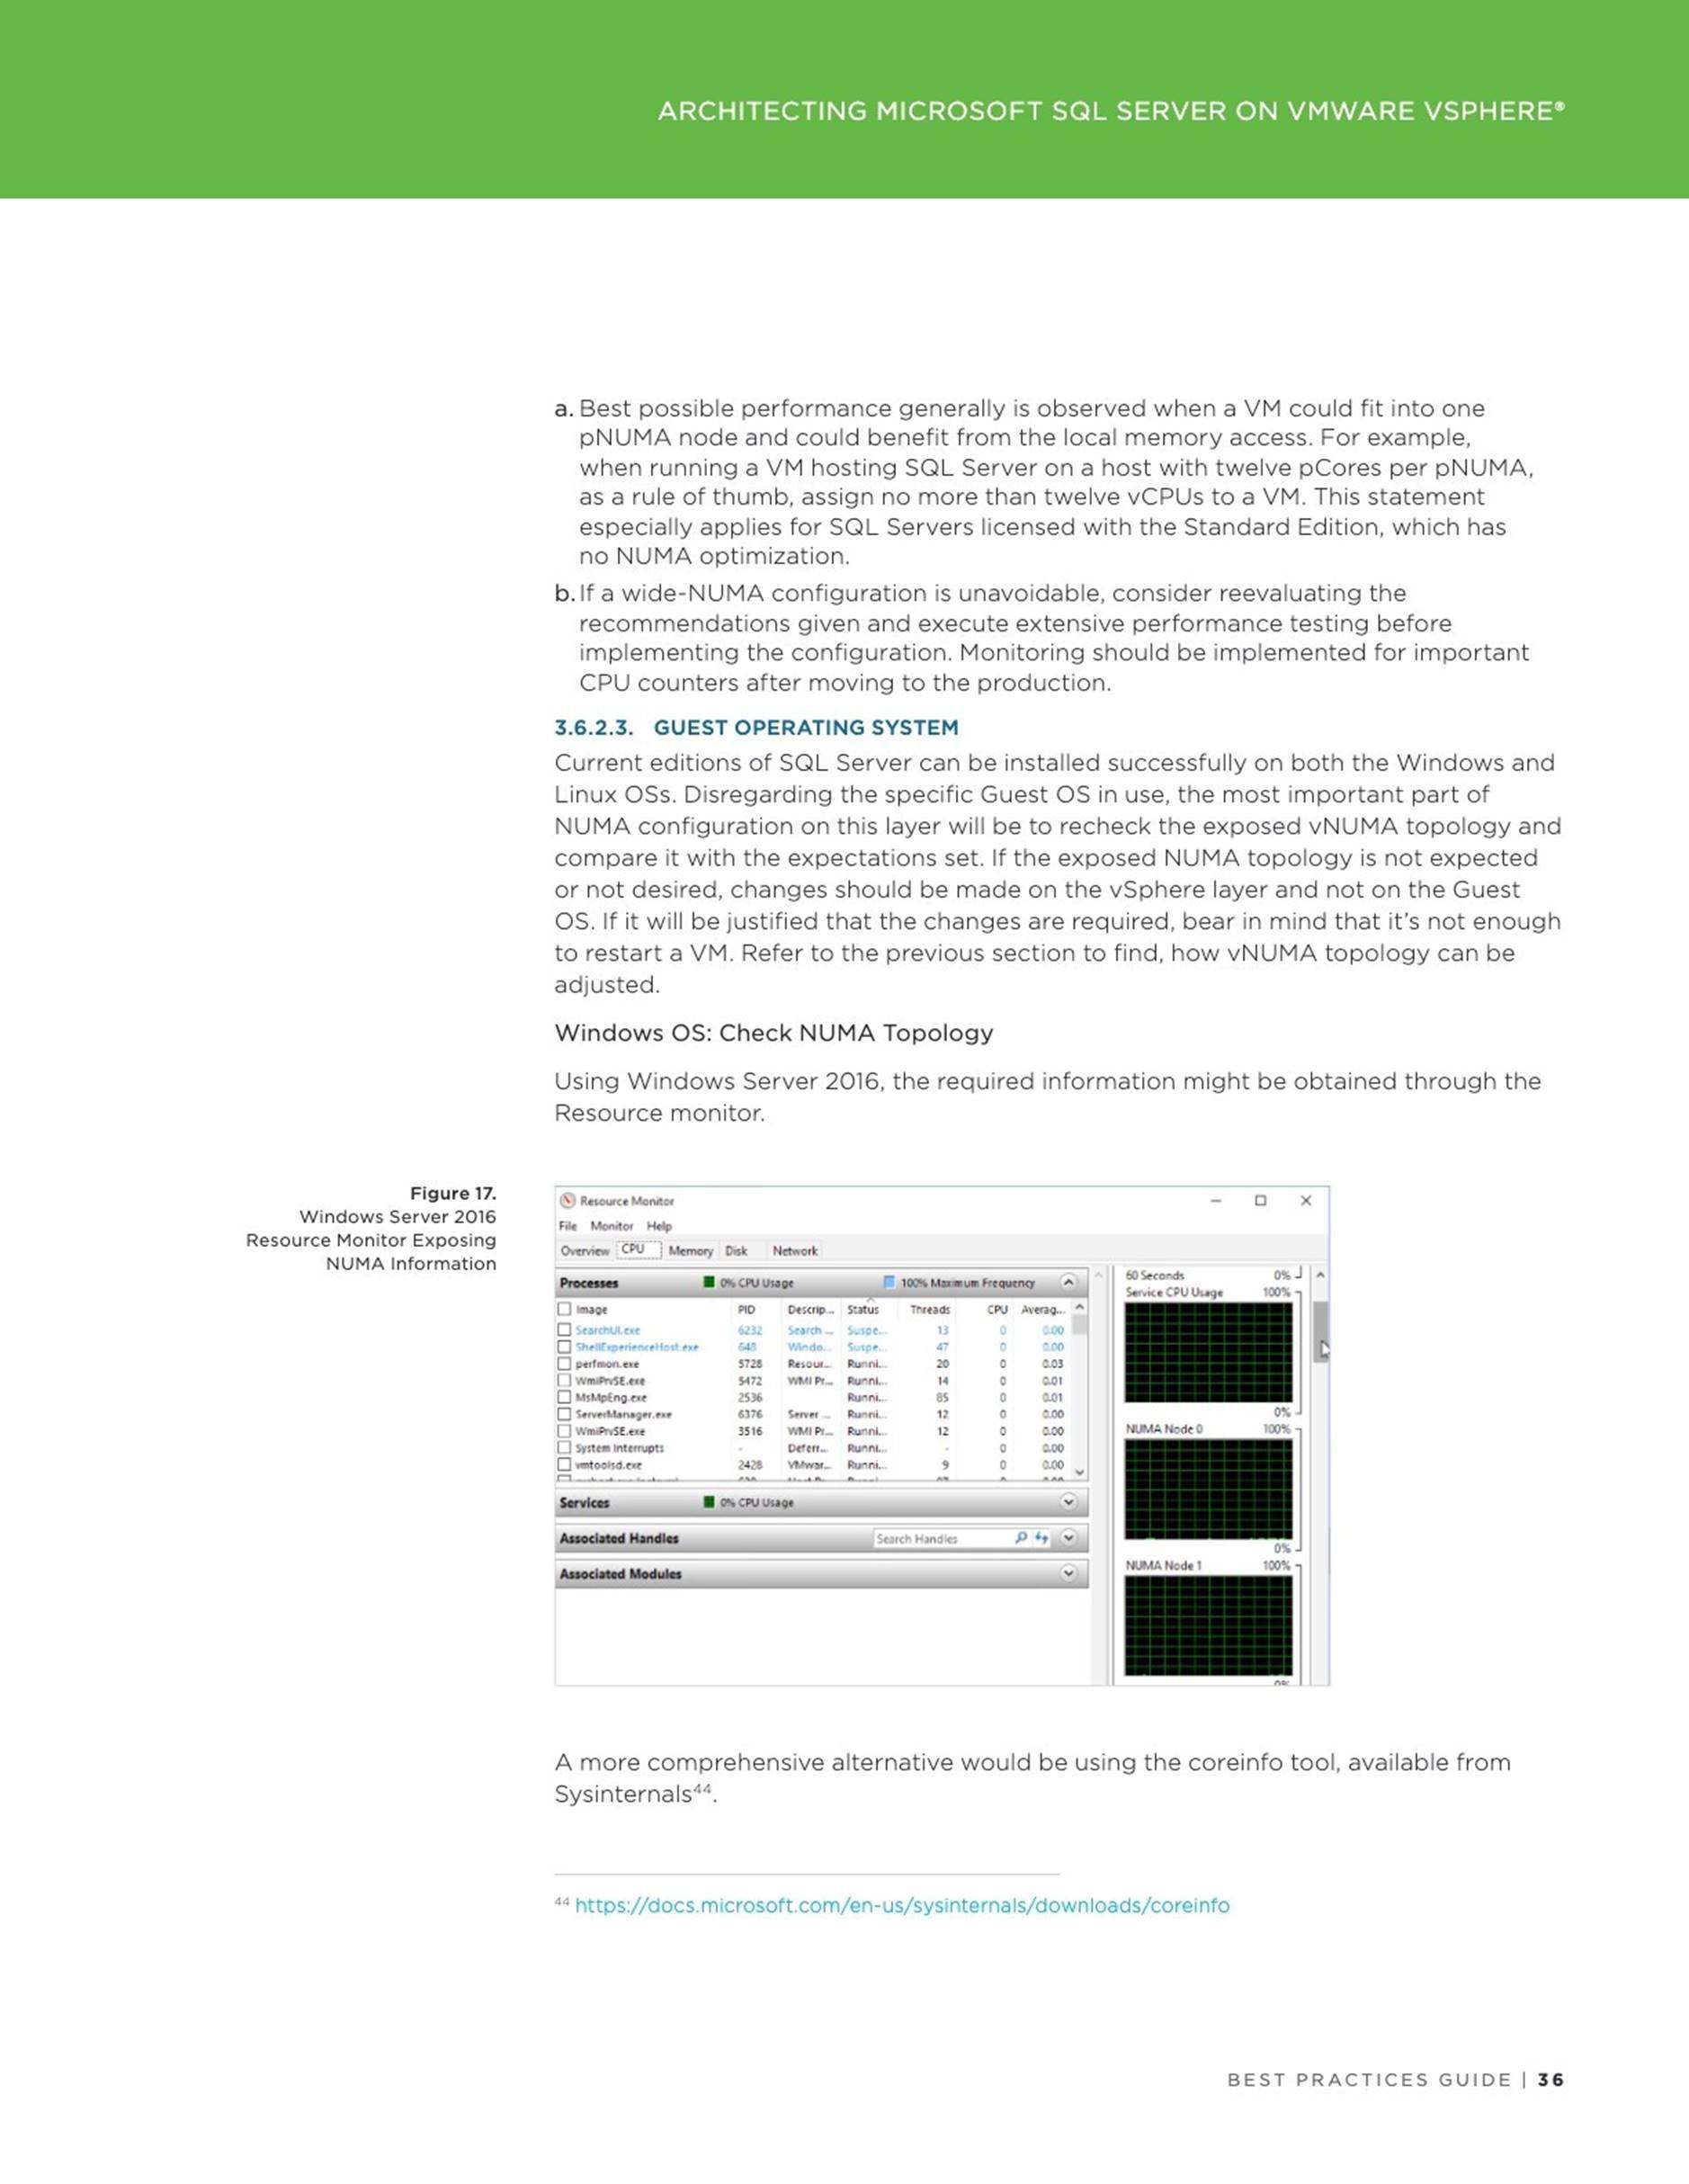
Formating vPmem device in Windows OS
After a VM is powered on and the OS is booted, a new physical disk will be found (All NVDIMM backend device will be operated in the same manner as usual disks, including file operations). Confirm, that a Storage Class Memory (SCM) type physical disk device is present using PowerShell. The SCM device type is a requirement for the DAX access:
Get-PhysicalDisk | select bustype, healthstatus, size | sort bustype

Proceed with the disk initialization using the Disk management tool:
![]() Initialize the disk as a GPT partition
Initialize the disk as a GPT partition
Proceed with a creation of volume, do not format, take notice of the volume letter
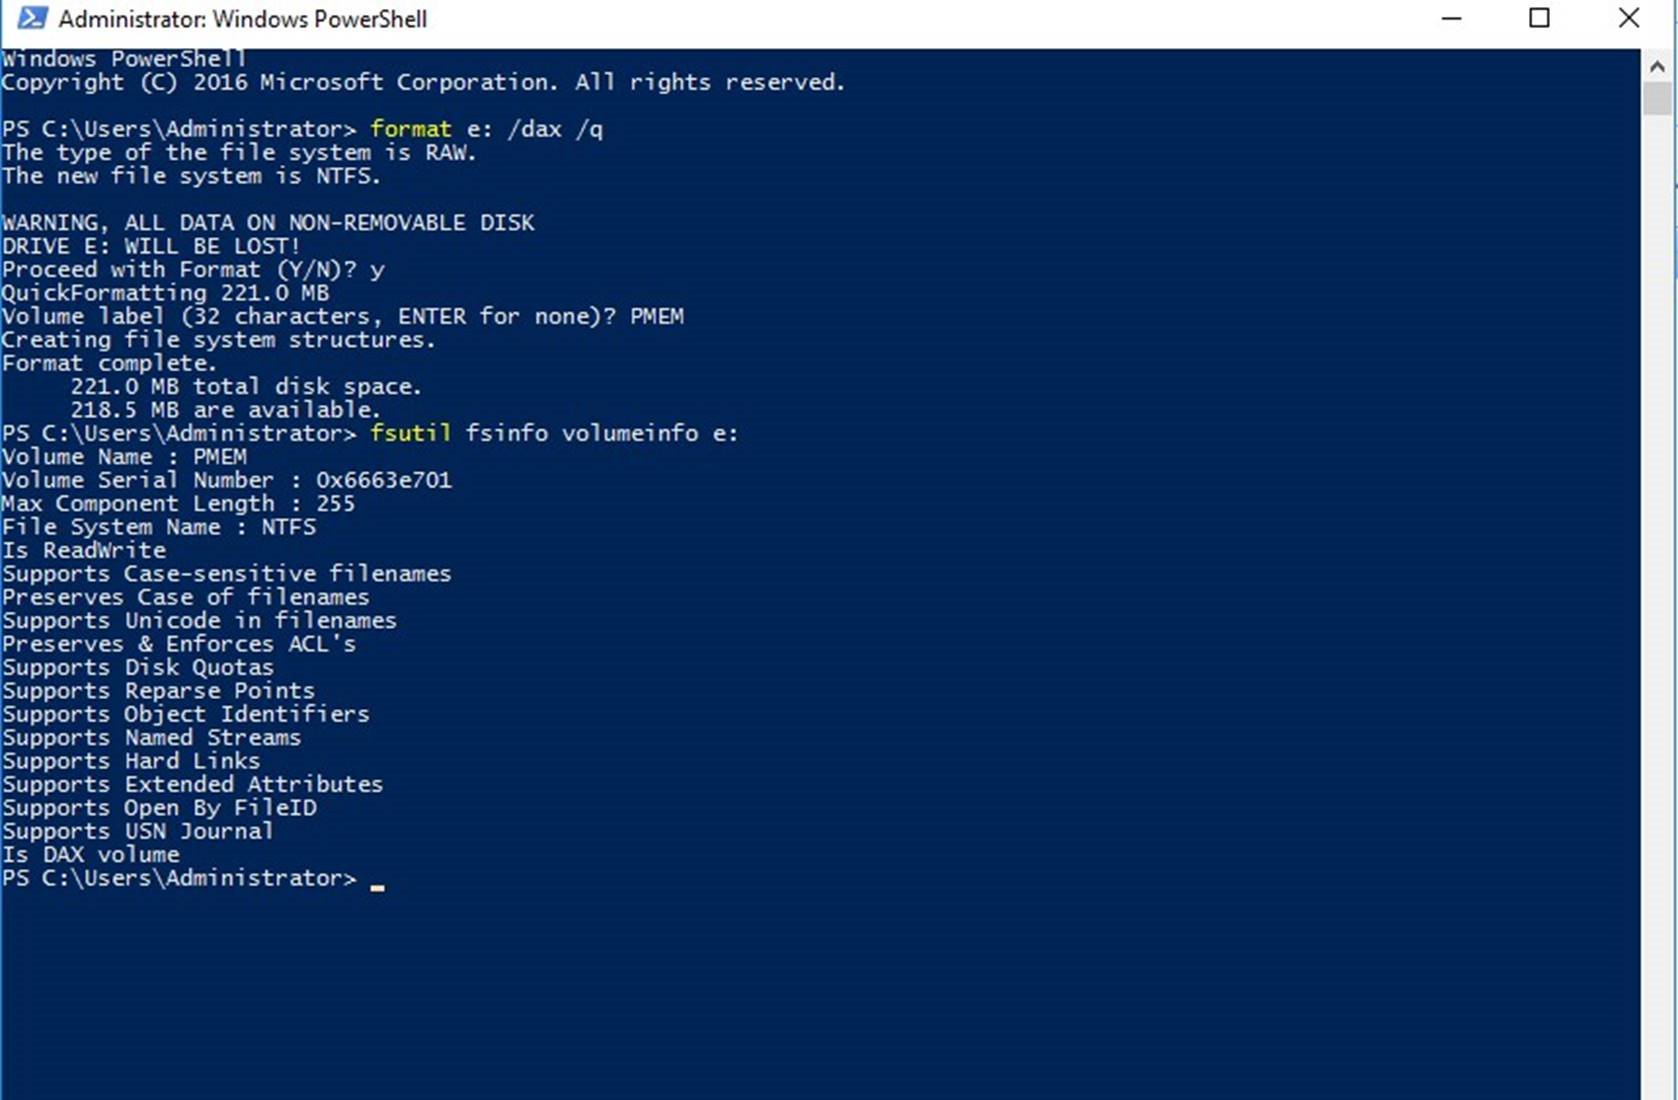
Switch back to the PowerShell console and format the new volume using the NTFS file system with /dax option
format e: /dax /q
Verify that the volume is formatted as a “DAX volume”
fsutil fsinfo volumeinfo e:
Now we can proceed with the SQL Server database configuration.
Configuring SQL Server database to use vPMem device
Open SQL Server Management Studio and connect to the SQL Server instance, select the database that will use “tail-of-log-cache” and add a log file placed on the previously created DAX-enabled volume:
ALTER DATABASE <MyDB> ADD LOG FILE (NAME = <DAXlog>,
FILENAME = ‘<Filepath to DAX Log File>’, SIZE = 20 MB
Check the folder on your vPMem backend disk to ensure that a 20MB log file was created.
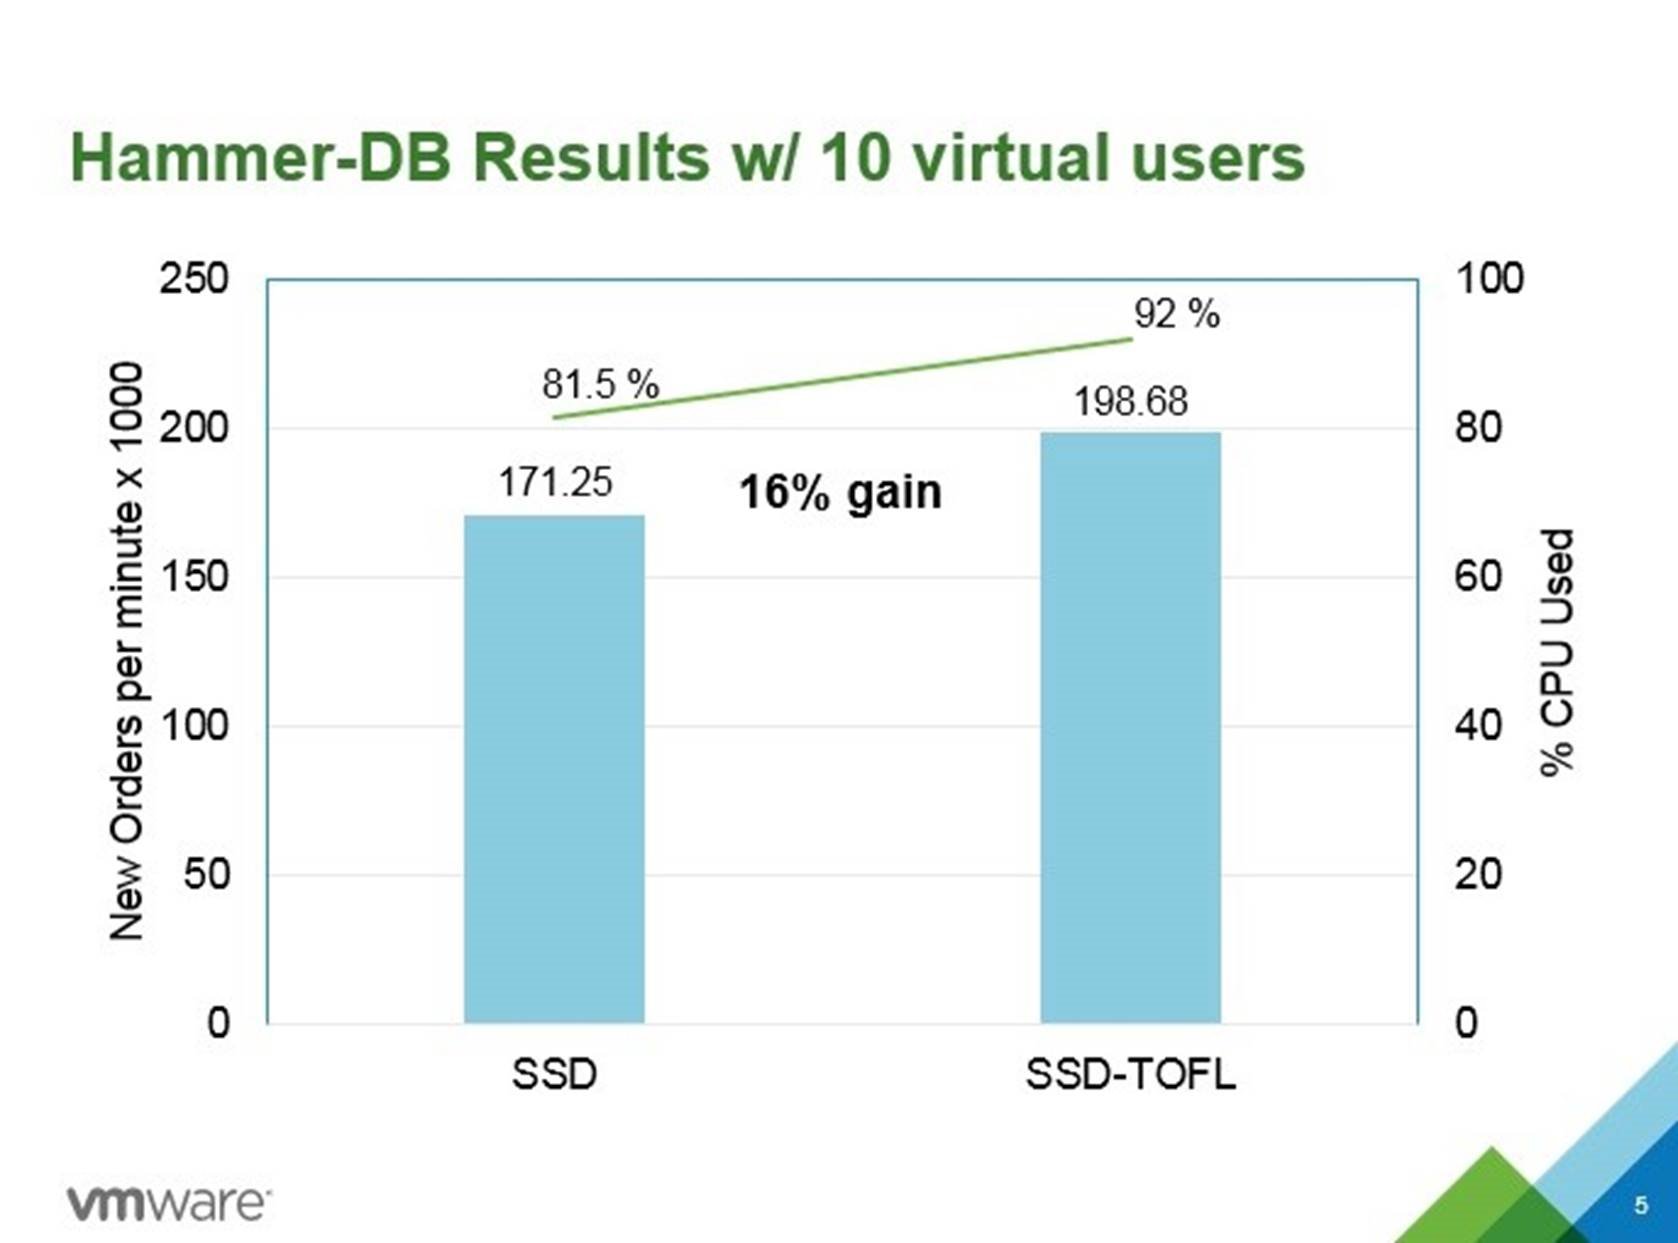
Start you preferable benchmarking tool and compare the difference! The following results were obtained in this setup
All steps described in this blogs are also depicted in the demo.
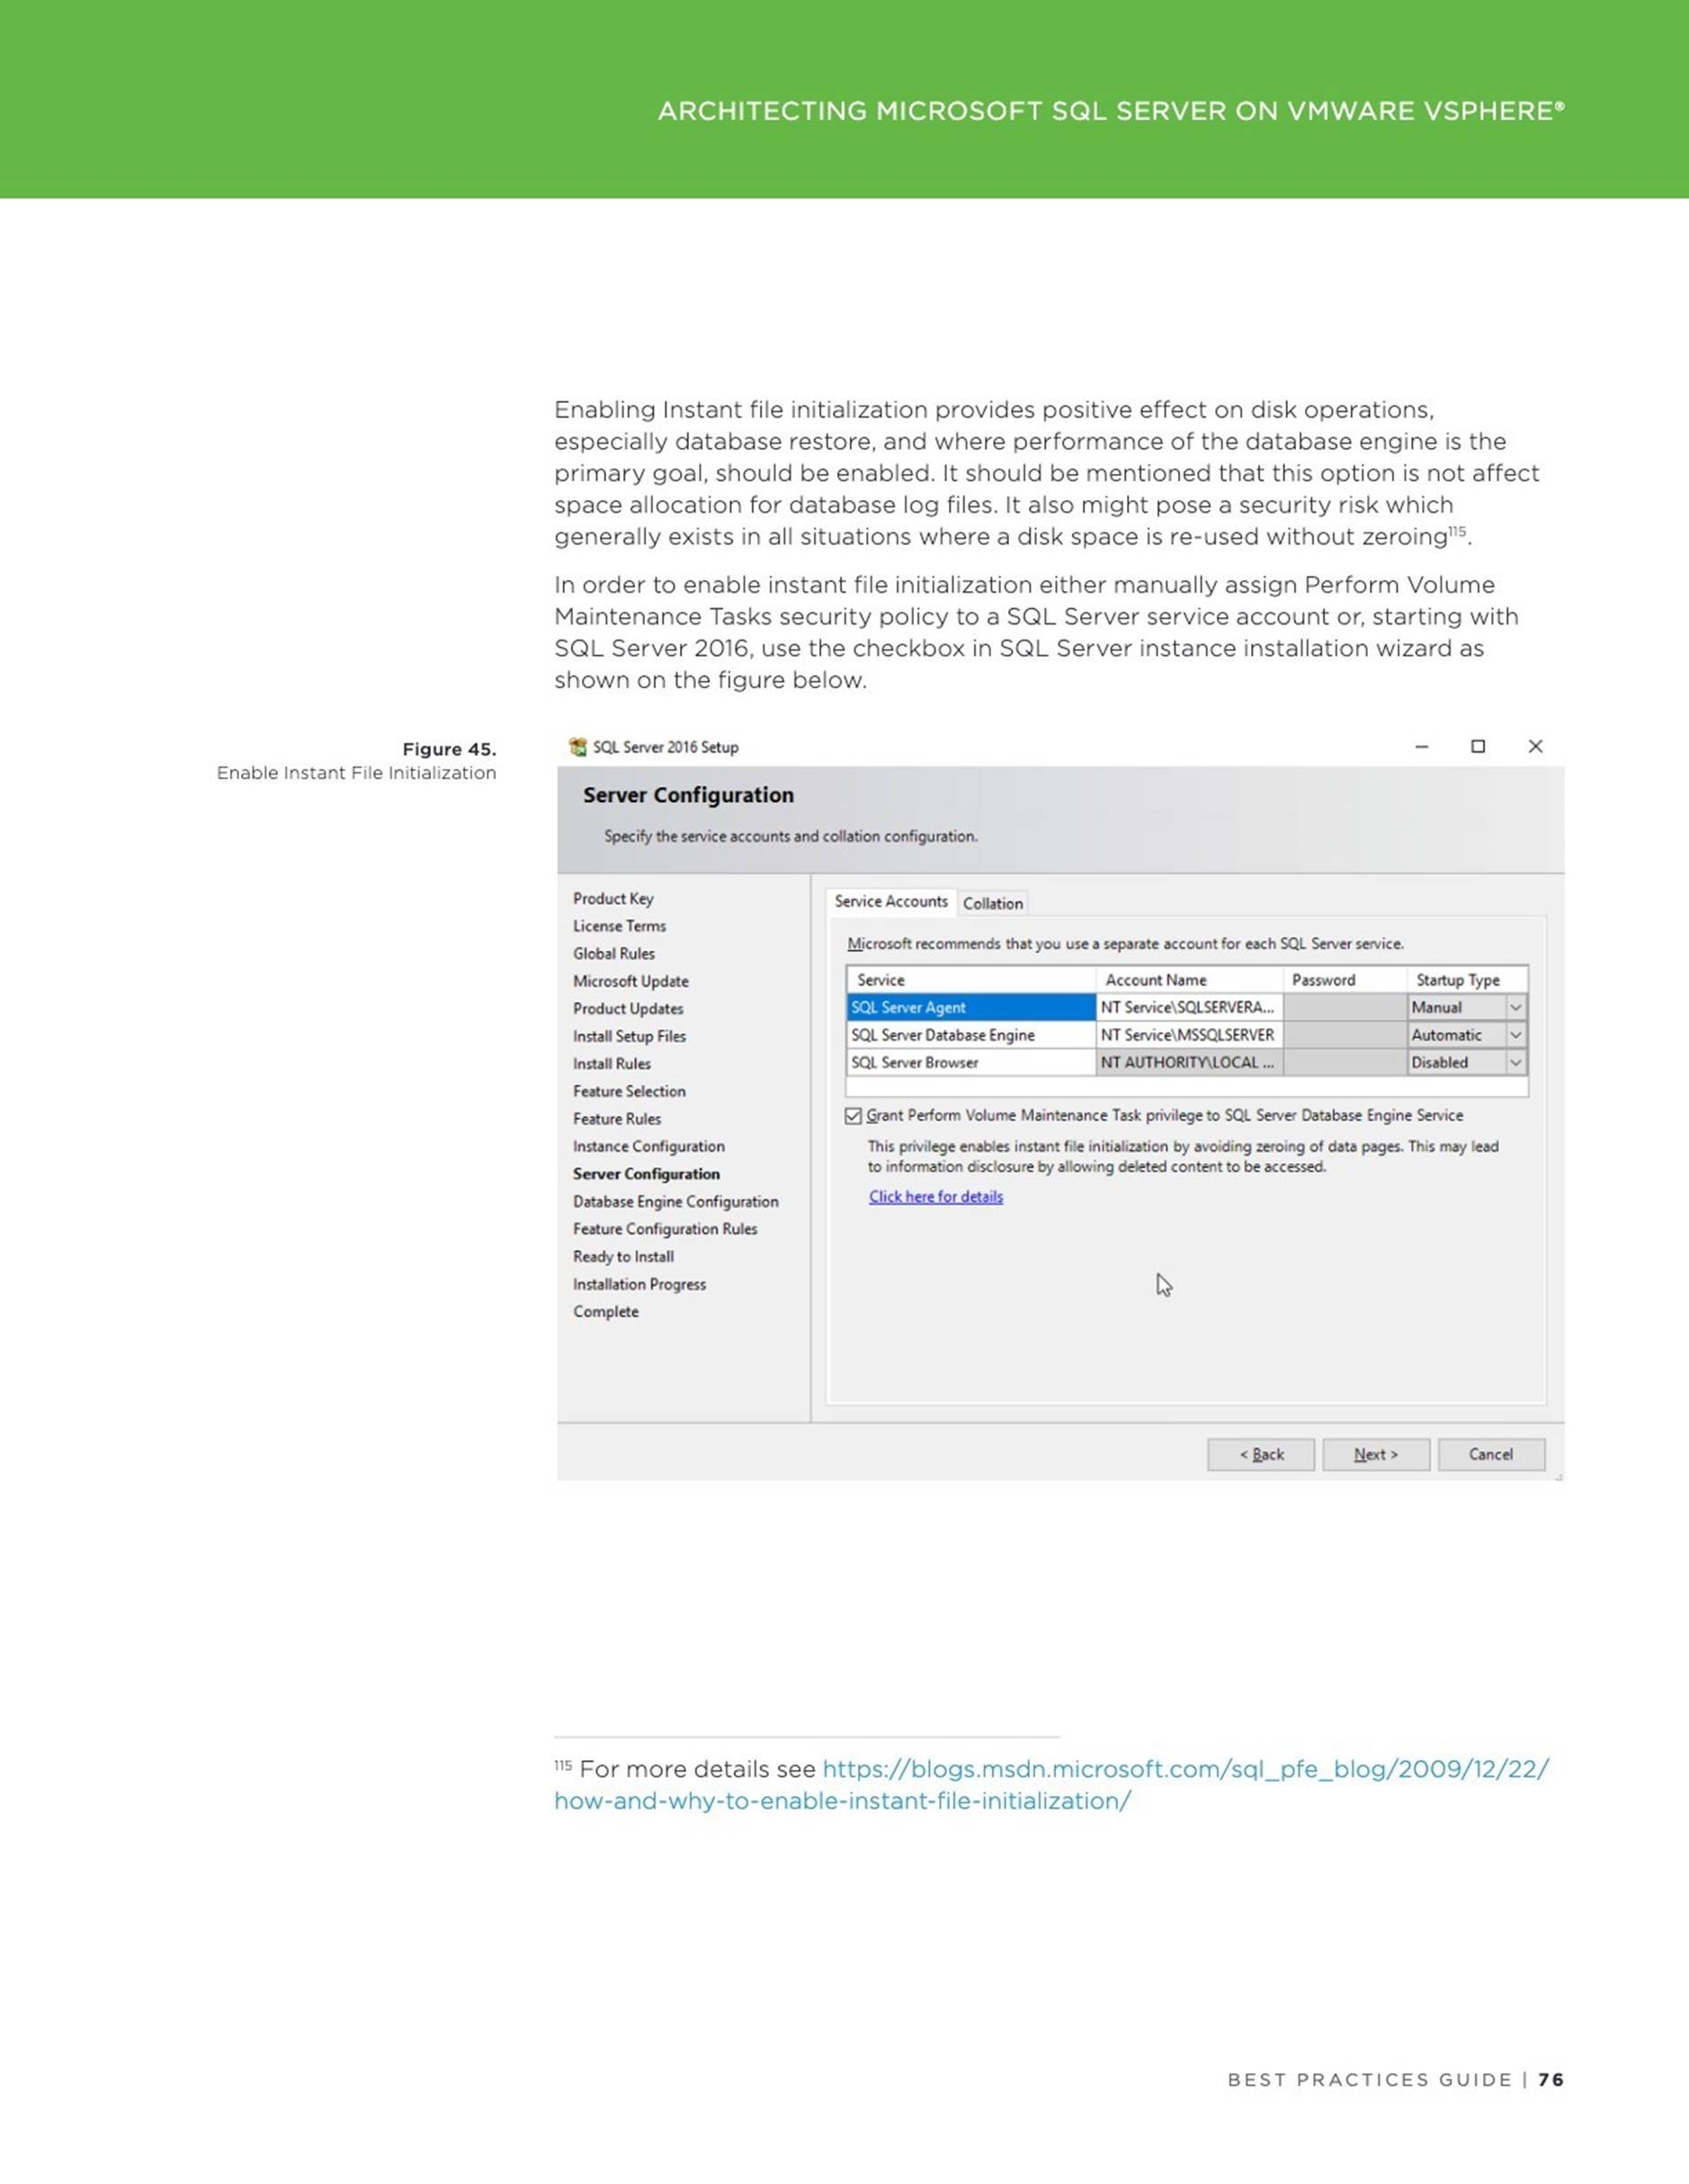
Current limitations for a VM with a vPMem device attached:
![]() VM with a vPMem device will be not protected by the vSphere HA. VM with a vPMem must be excluded from a VM level backup. If a VM was previously part of such backup, ensure to disable CBT before adding vNVDIMM to a VM.
VM with a vPMem device will be not protected by the vSphere HA. VM with a vPMem must be excluded from a VM level backup. If a VM was previously part of such backup, ensure to disable CBT before adding vNVDIMM to a VM.
![]()
VM with vPMem can be vMotioned, but a destination host must have a hardware NVDIMM device.
This configuration provides performance benefits for databases and allows to efficiently share even small in size hardware NVDIMM module between many VMs and many databases, providing very efficient way of consuming the new hardware. With a support of the persistent memory technology in vSphere 6.7, it’s looks very beneficial from SQL Server performance perspective to enhance the hardware configuration of a new server with NVDIMM devices.
Special thanks Chris Gully for helping with the hardware configuration and perfomance testing. Following DellEMC hardware platform specifications were used:
Article: https://blogs.vmware.com/apps/2018/08/using-persistent-memorywith-a-vir…
Date: 2019-05-21
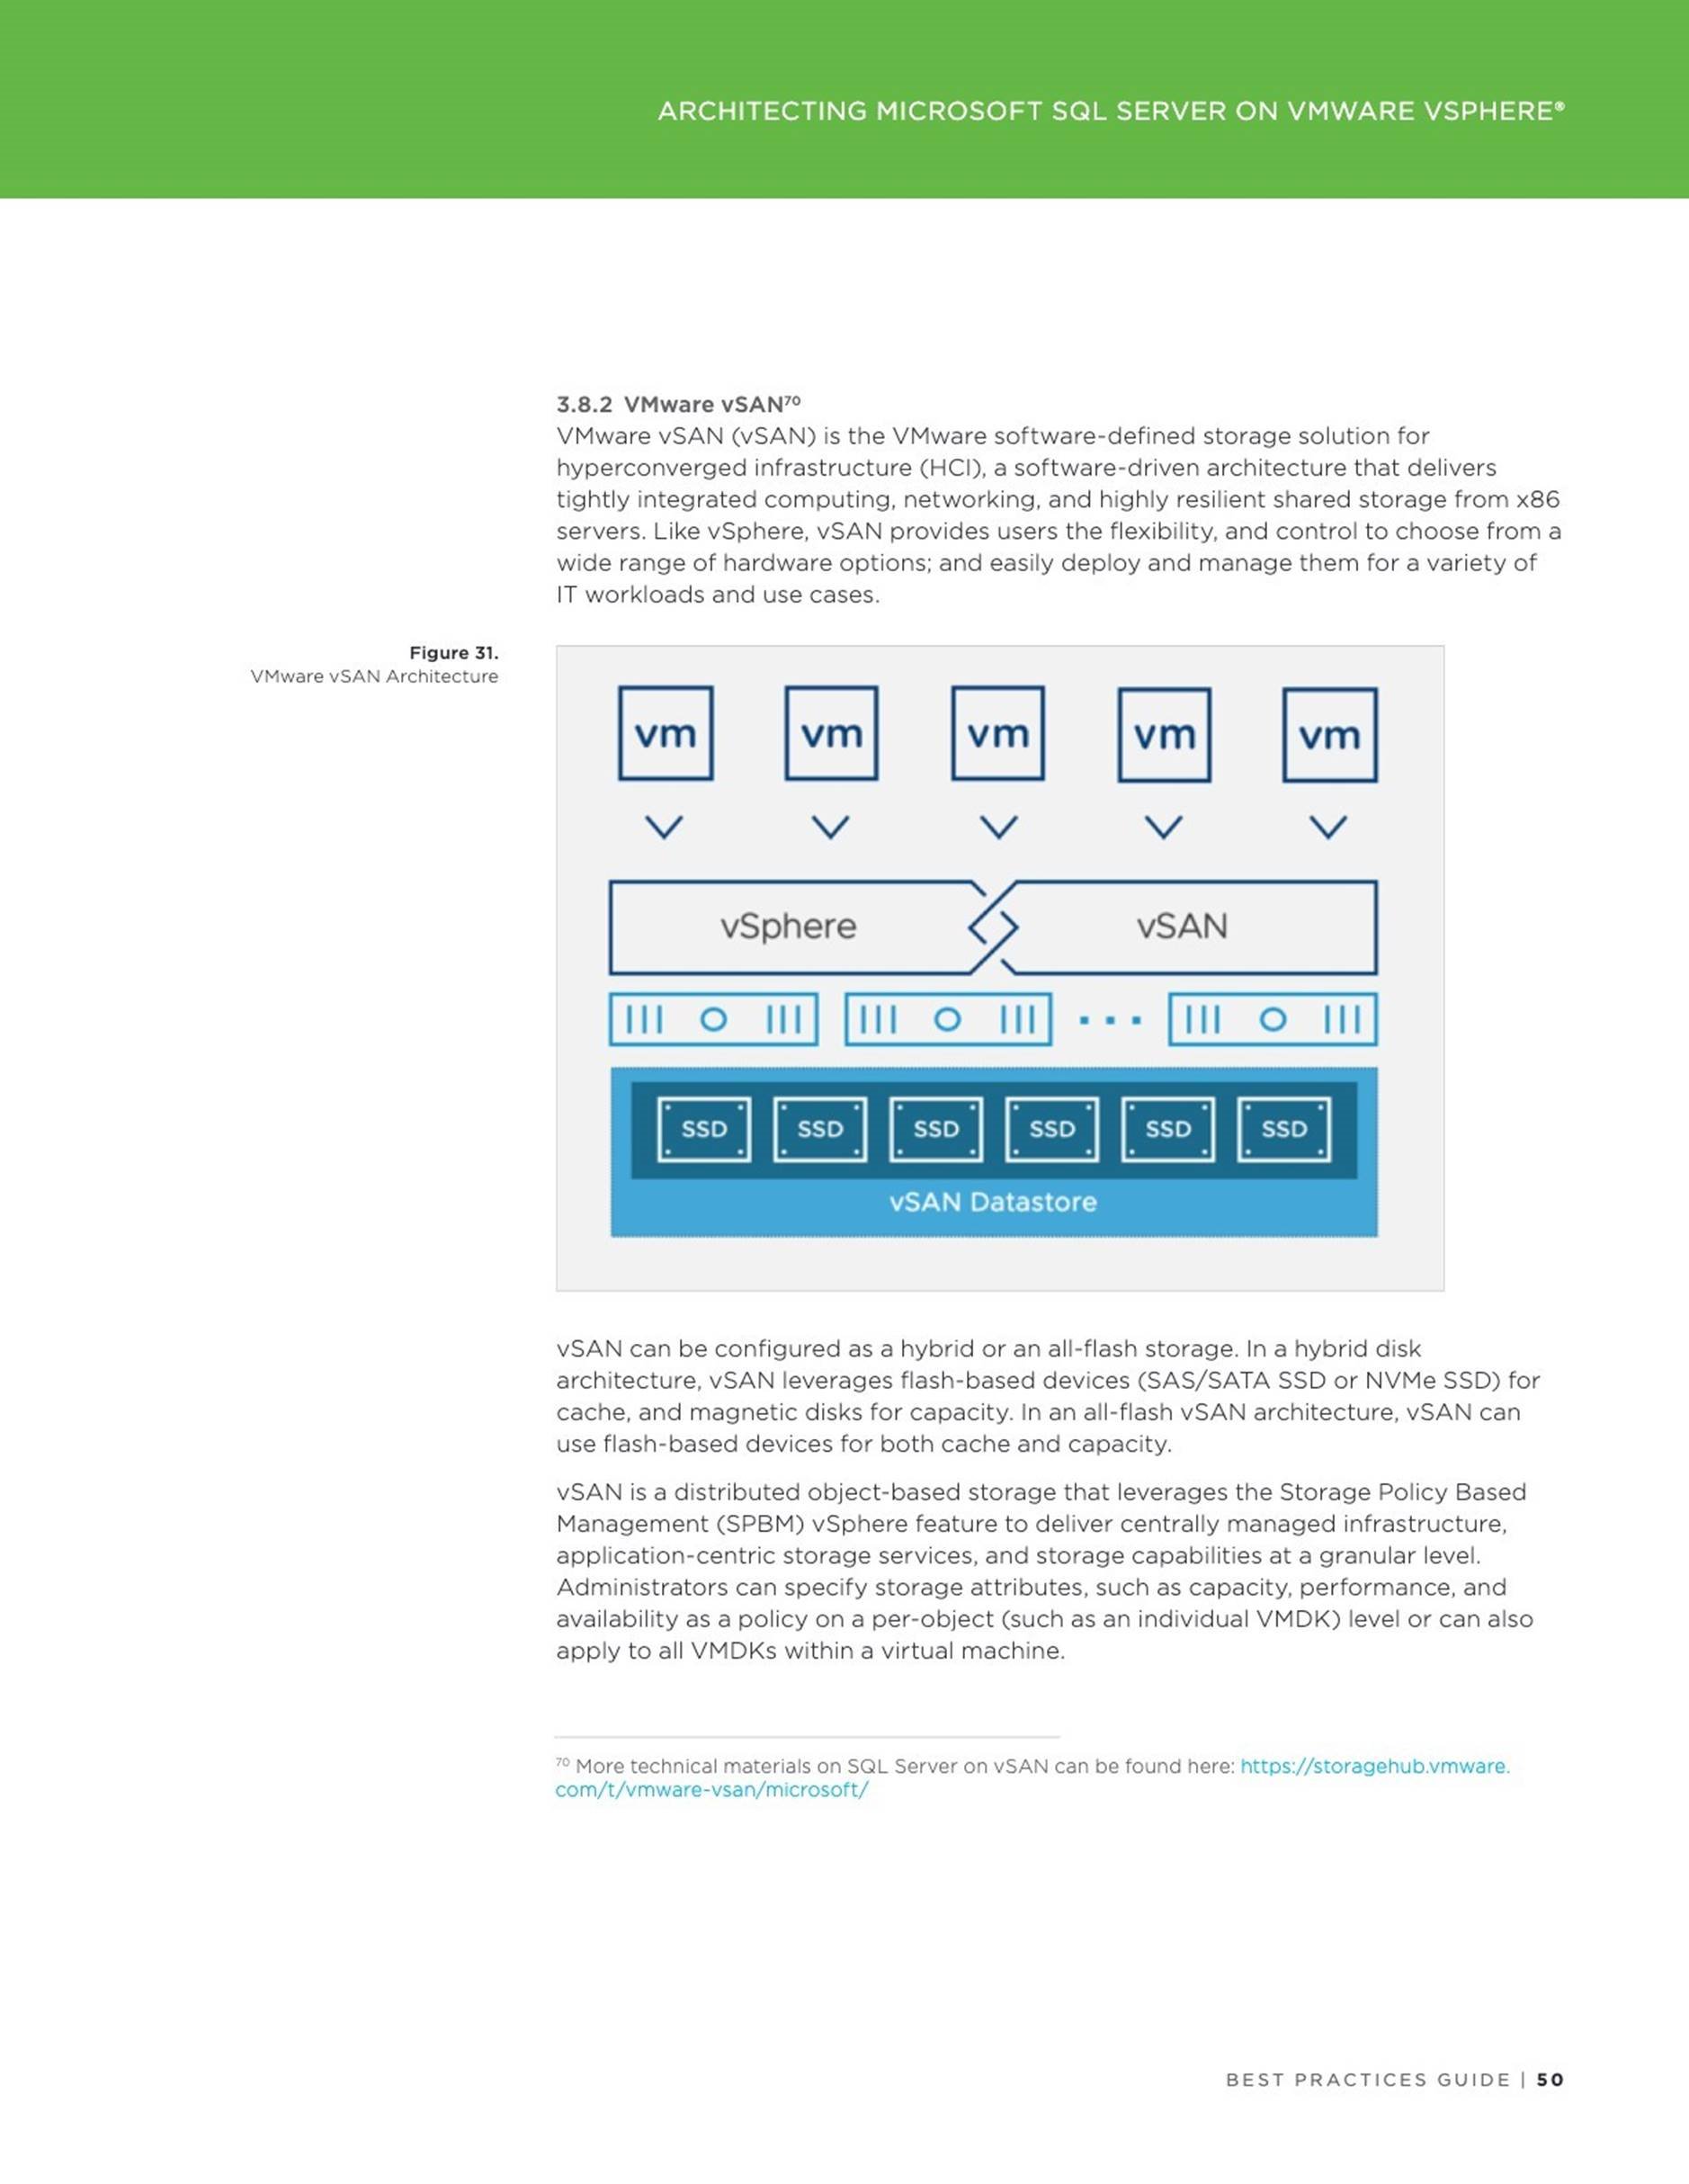
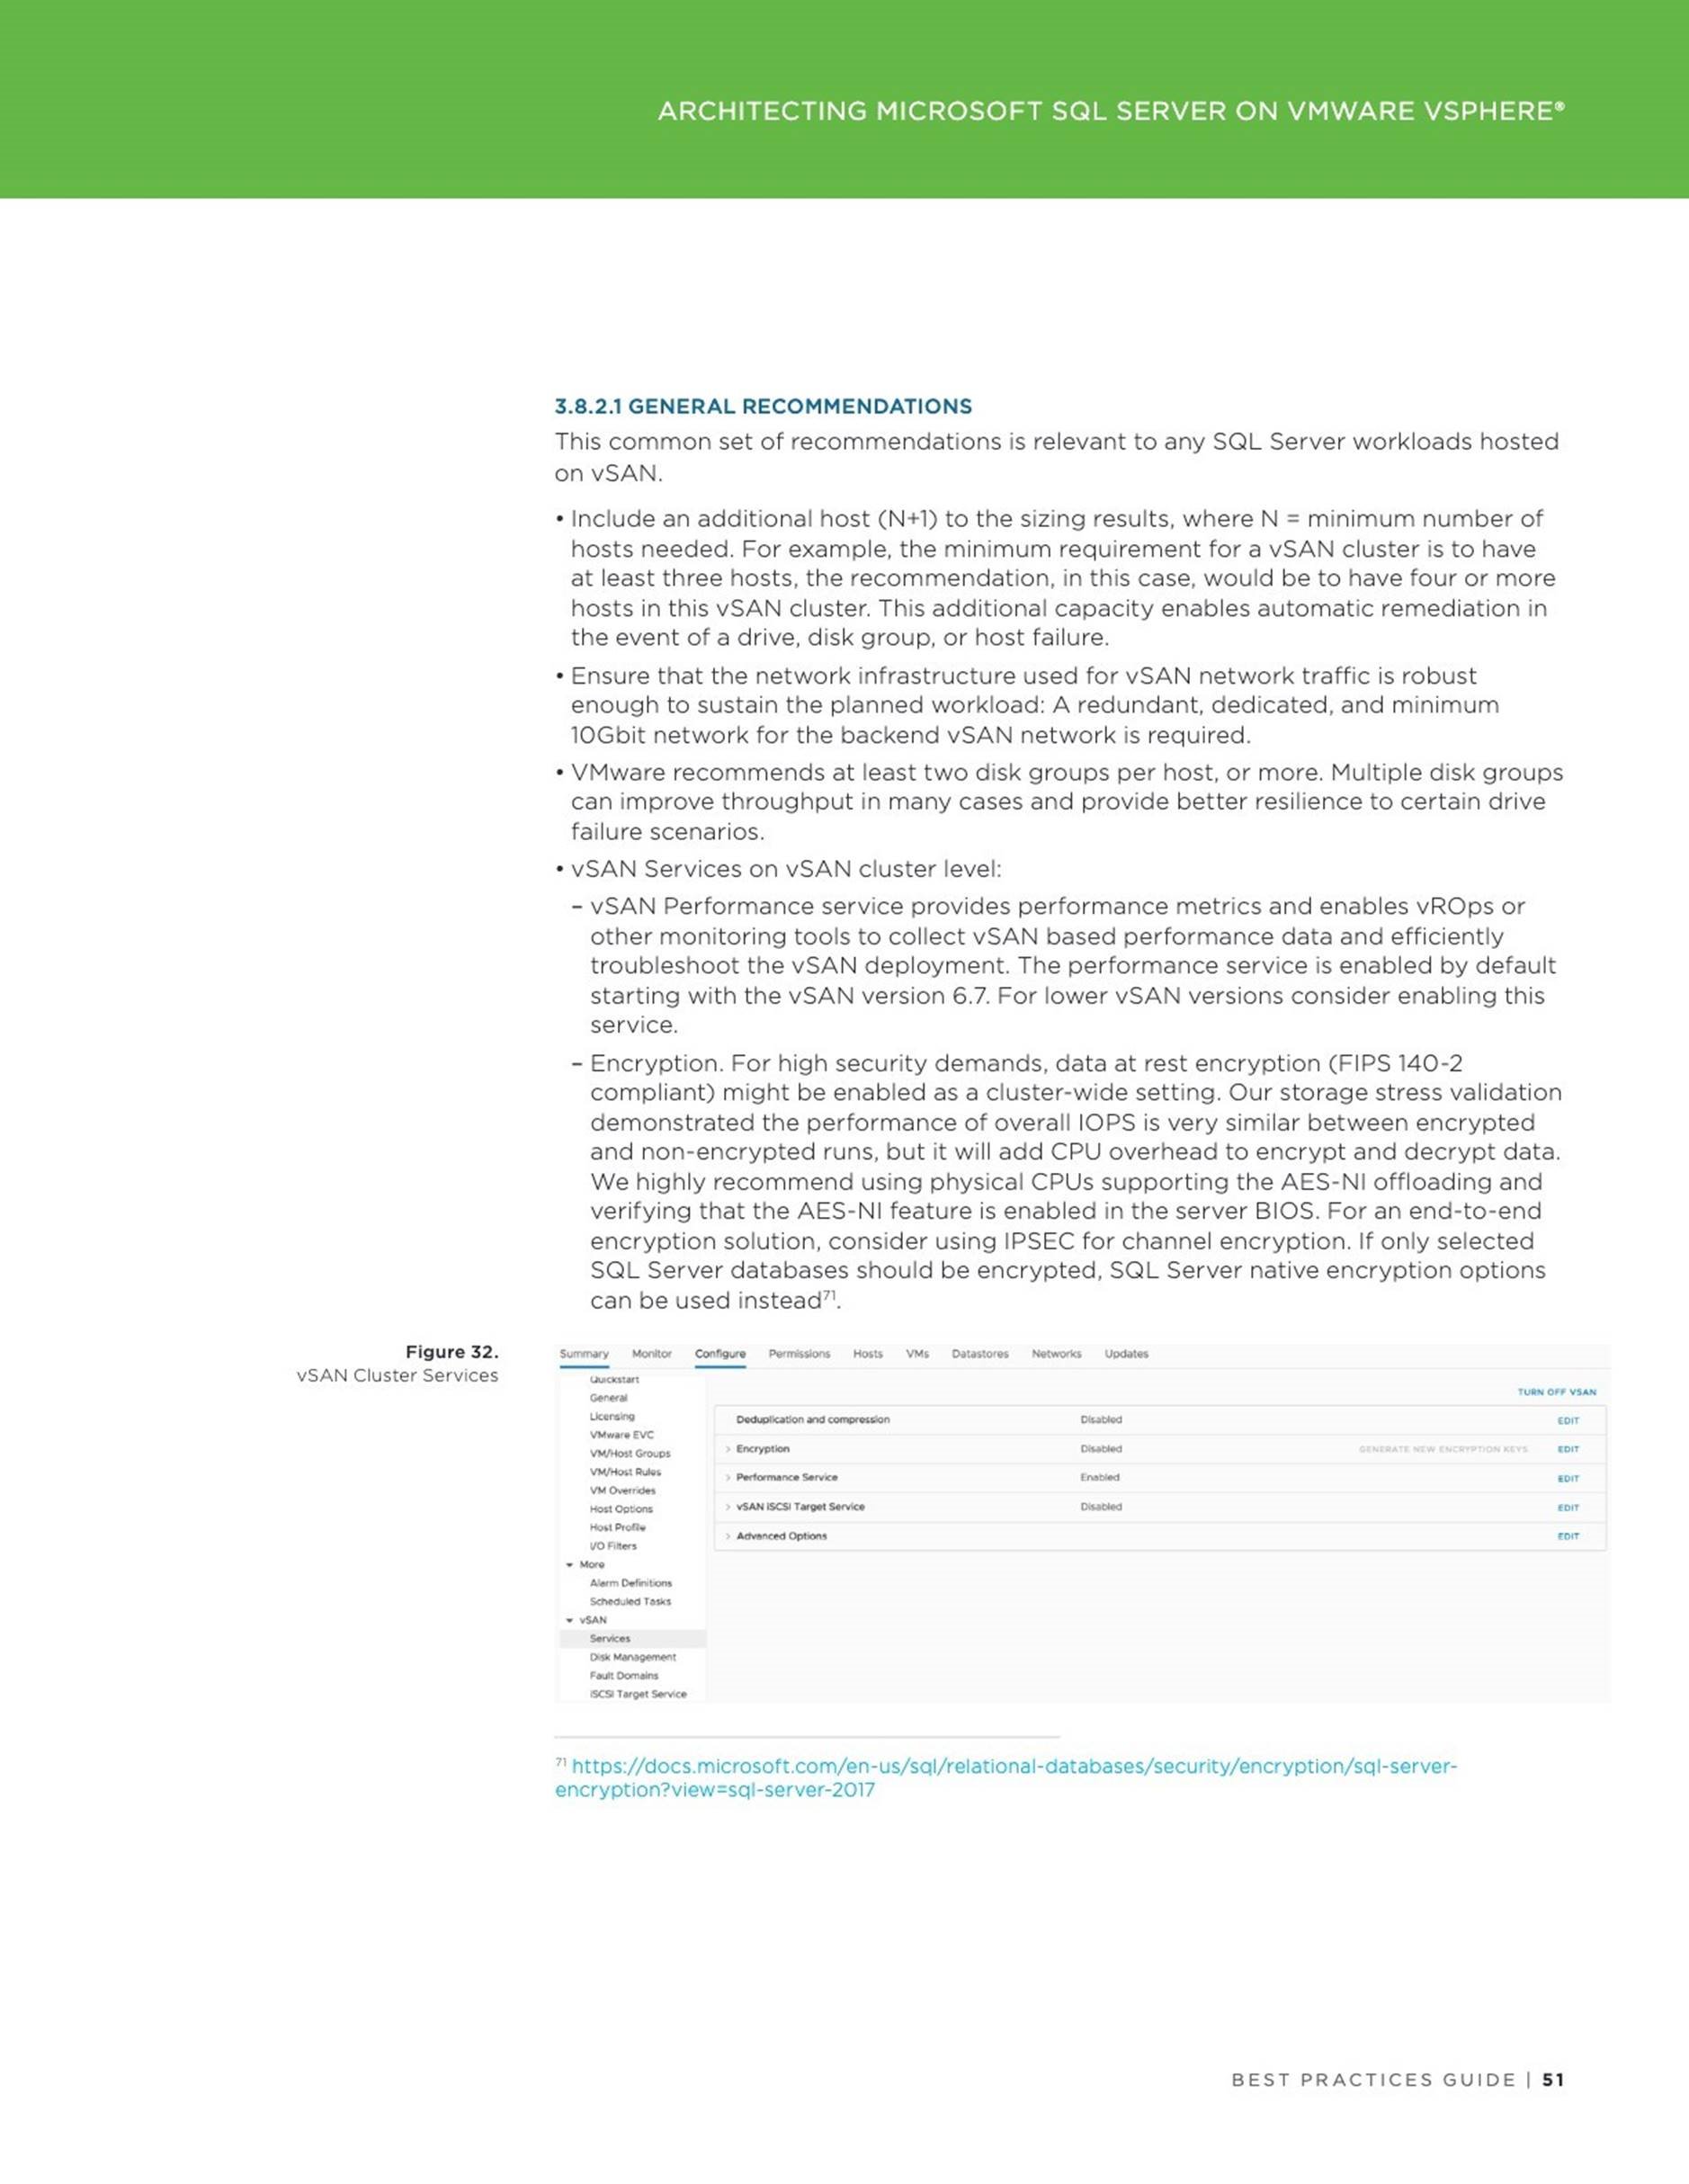
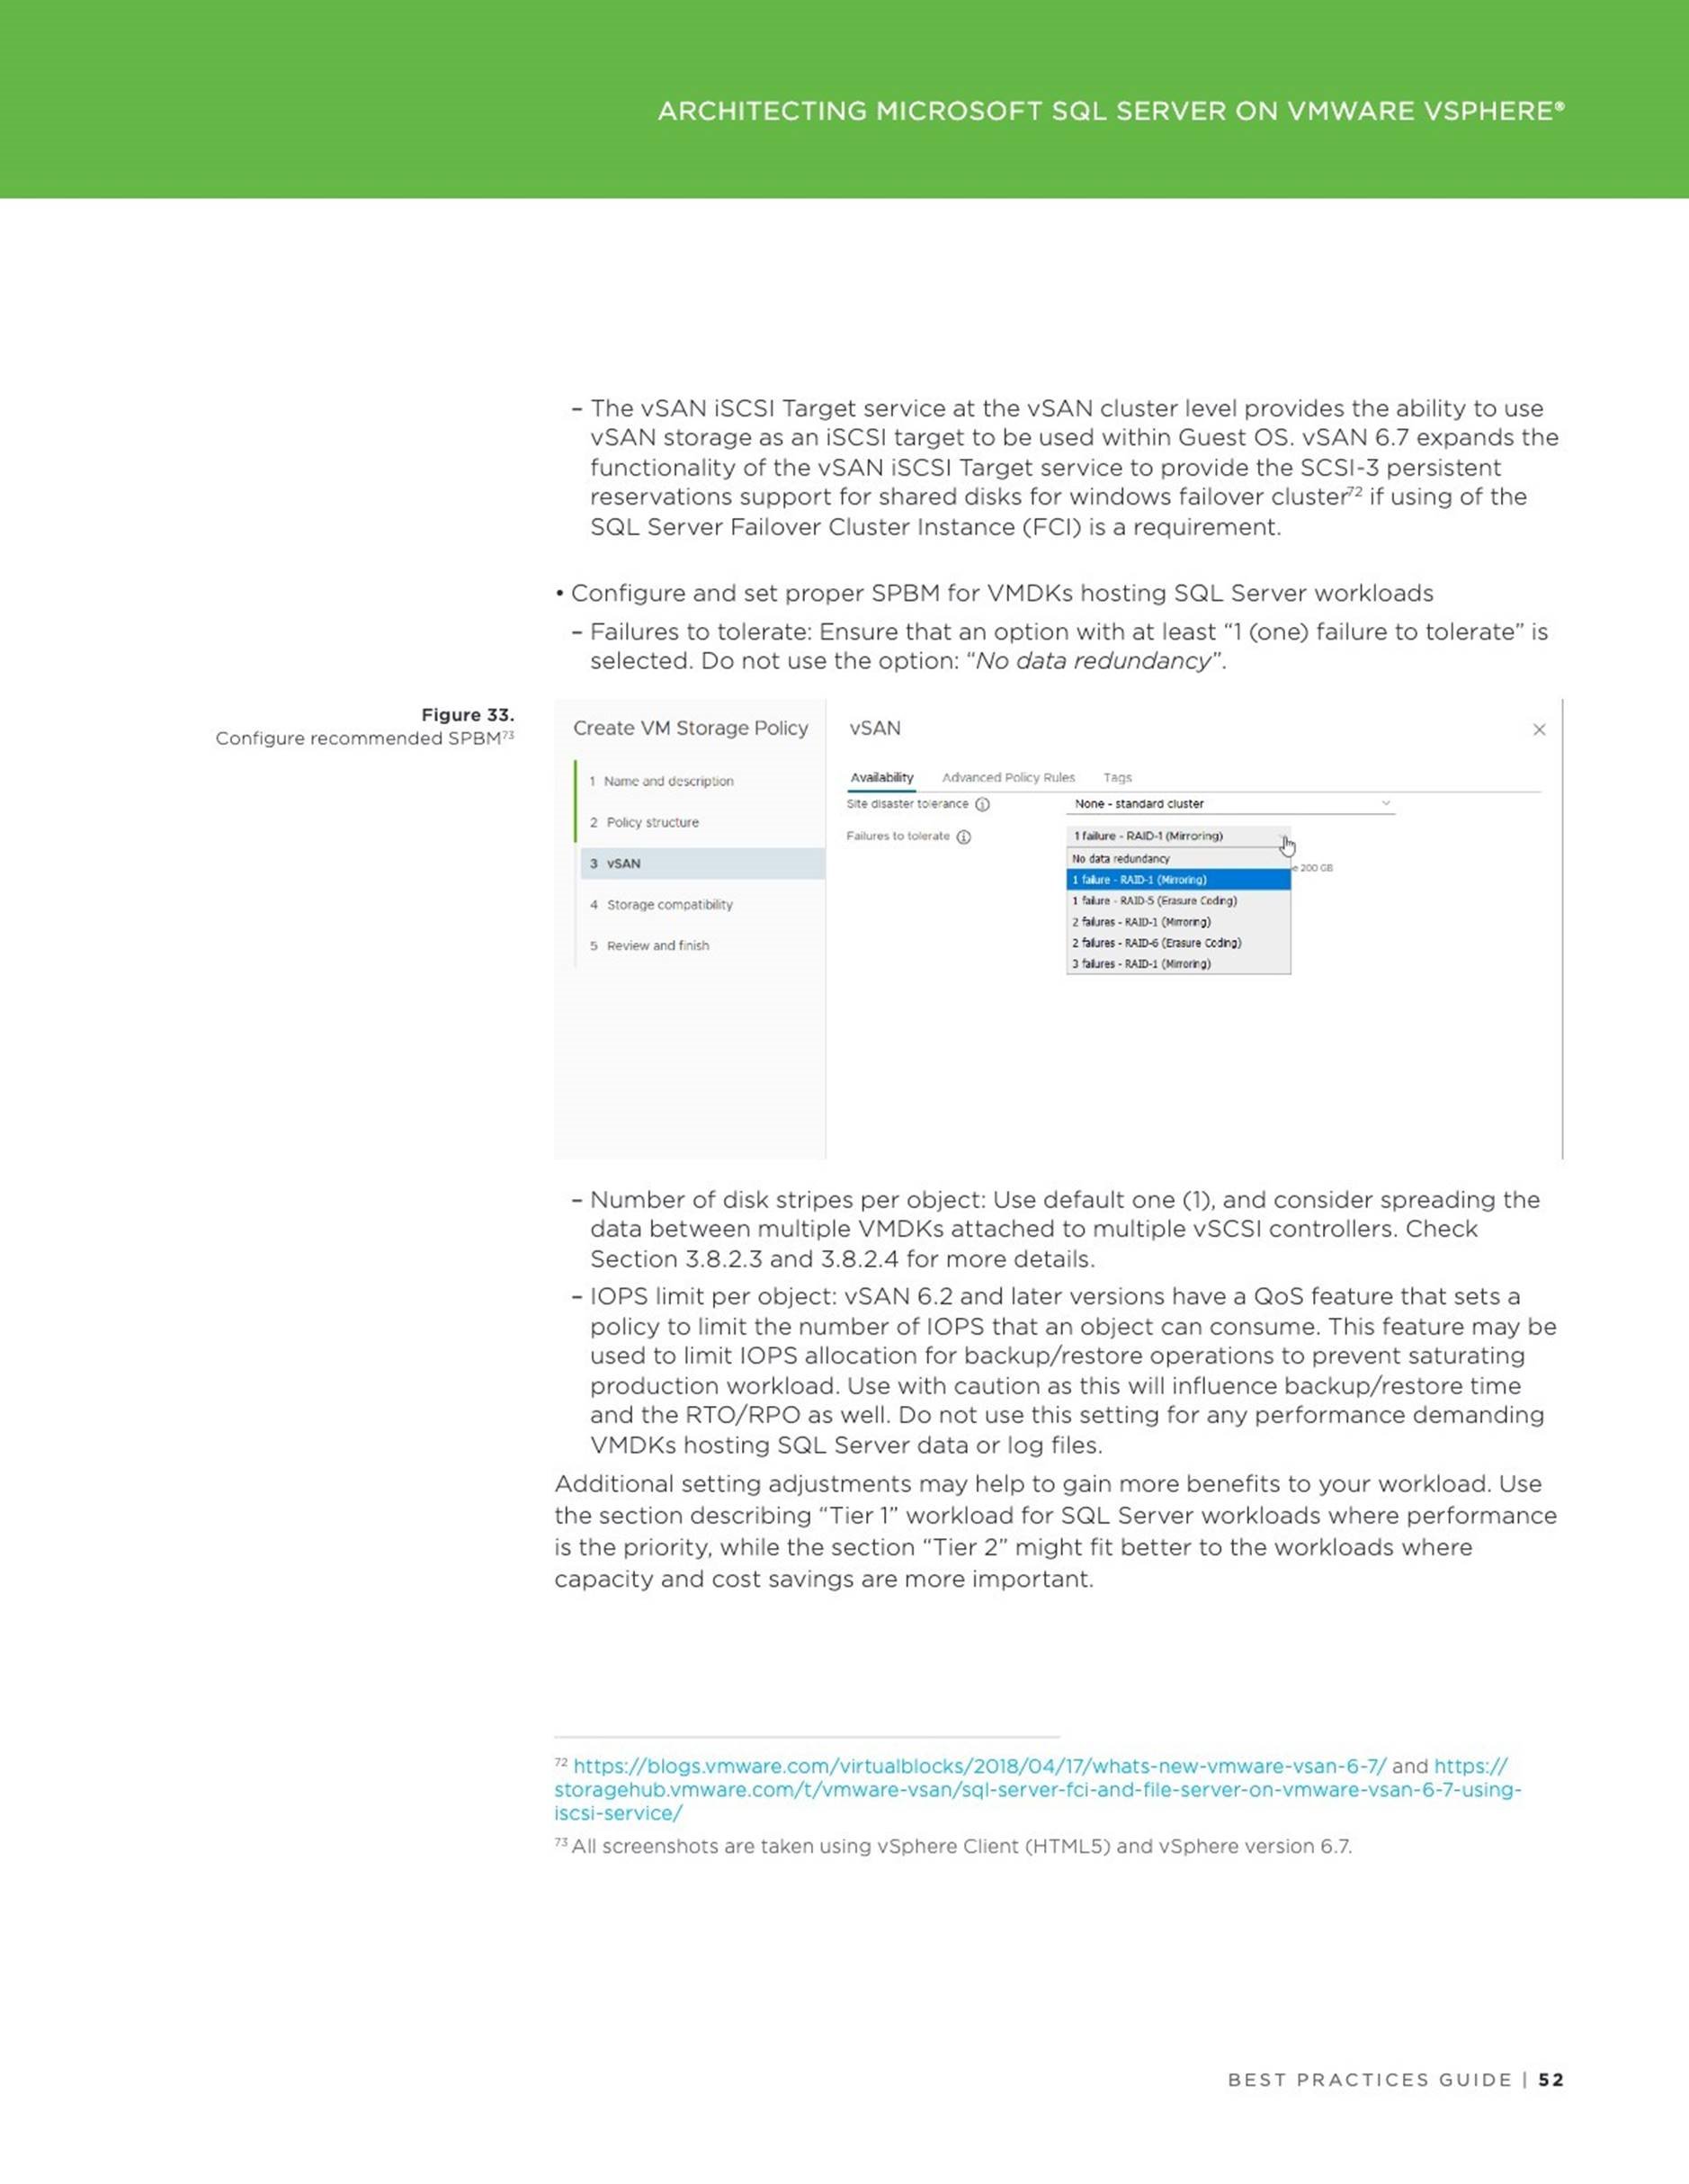
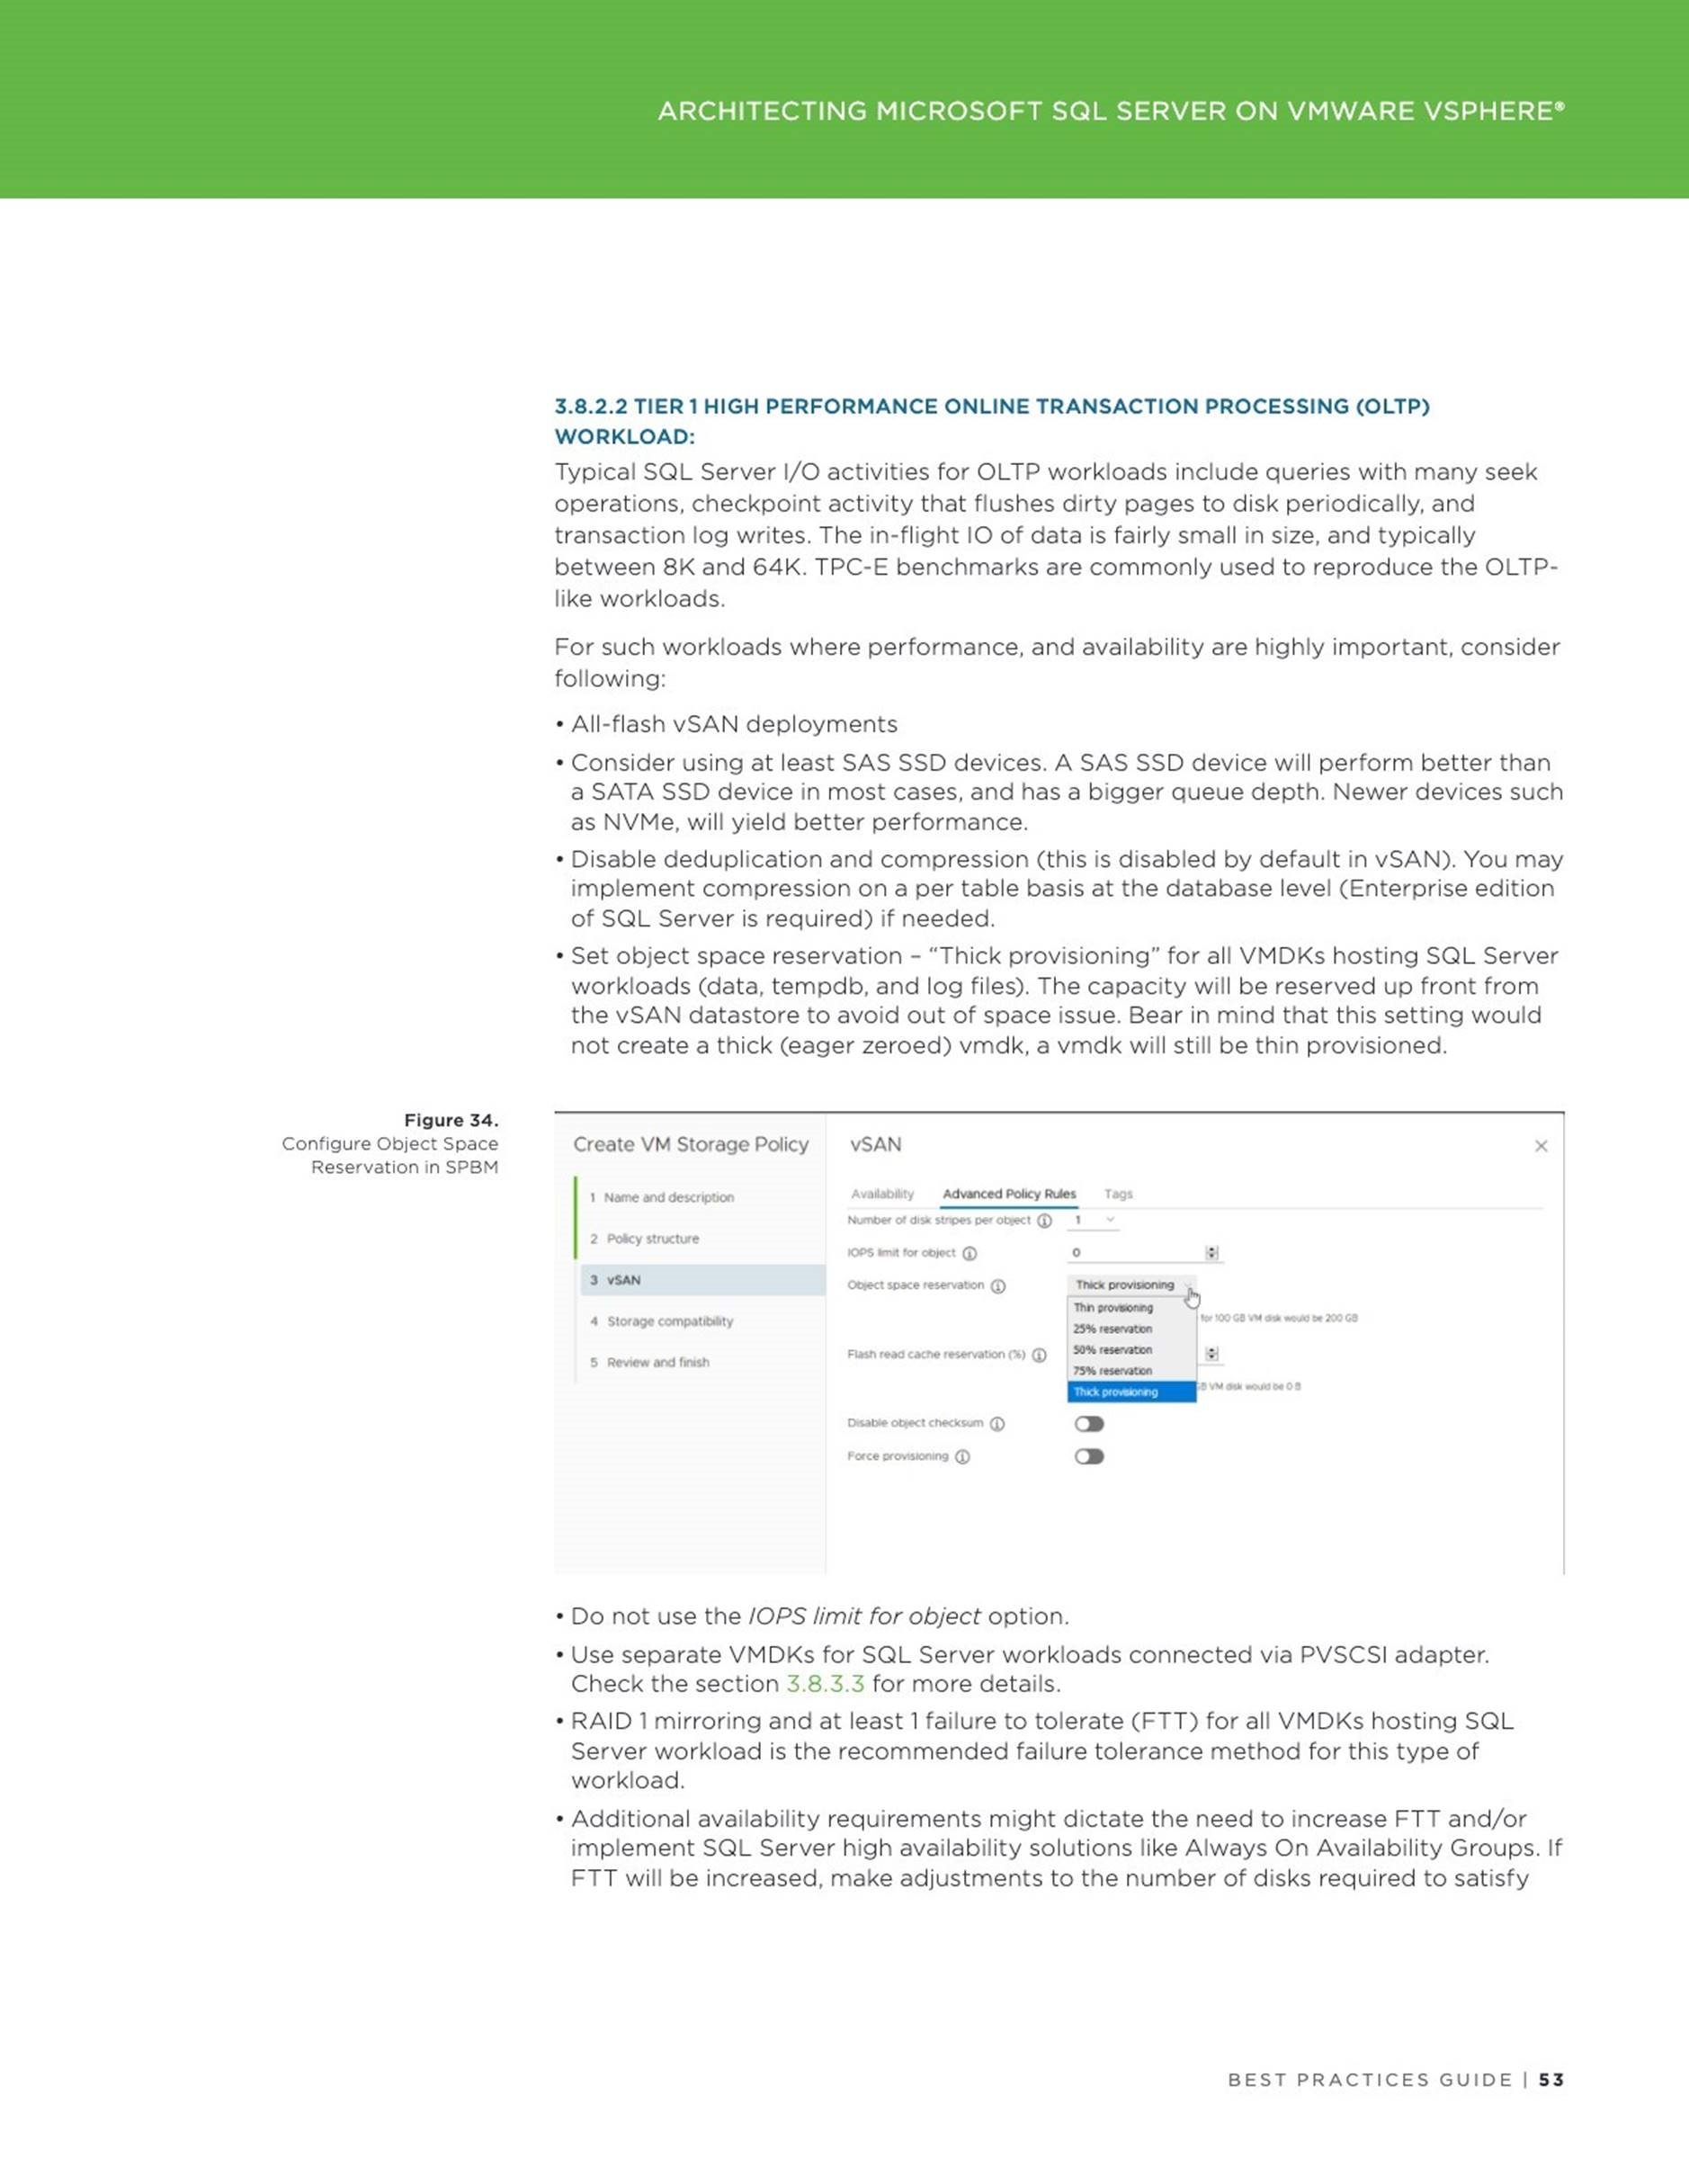
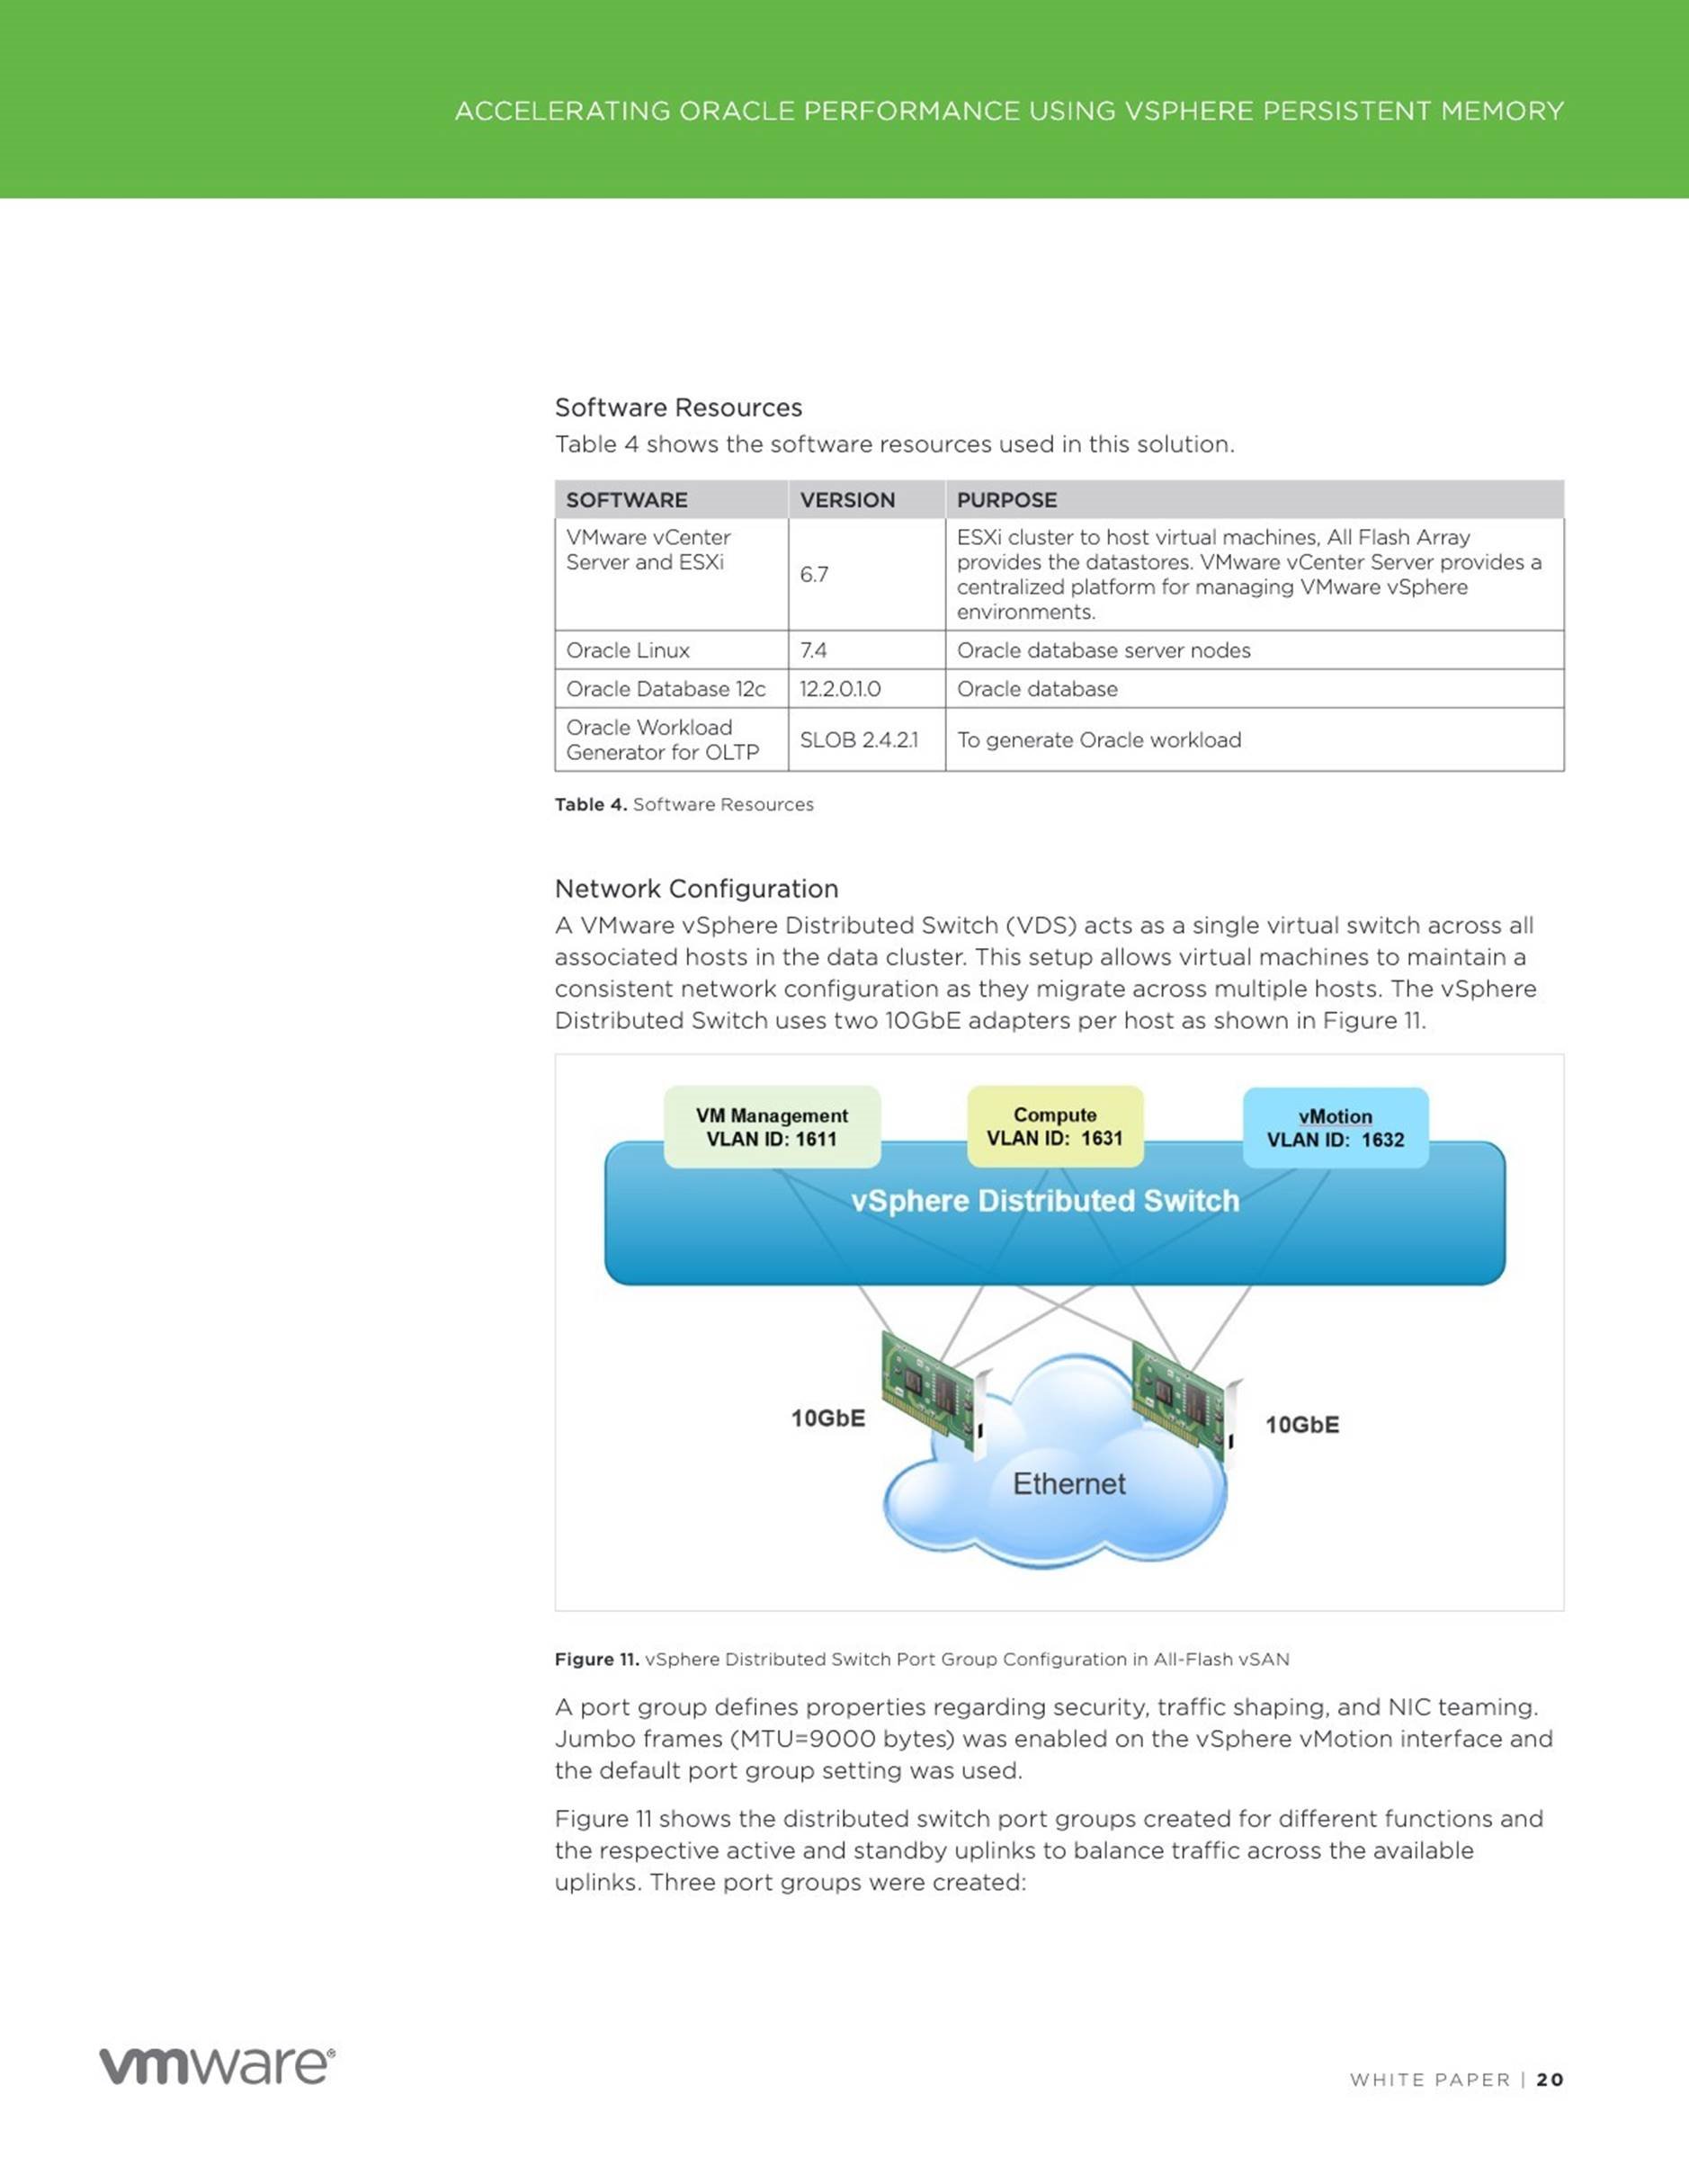
3 Architecting Microsoft SQL Server on VMware vSphere


4 Accelerating Applications Performance with Virtualized Persistent
Memory
This blog was authored by Sudhir Balasubramanian,Vas Mitra and Oleg Ulyanov.
With this post we are starting a blog series dedicated to the Persistent Memory (PMem) feature introduced in vSphere 6.7. We will cover initial configuration of the PMem in vSphere and the way how different virtualized business critical applications (like SQL Server, Oracle, SAP) can profit from using the PMem.
Before we dig deep in the application content let us review the basic – what is the Persistent Memory
Introducing Persistent Memory and Configuring ESXi host
Non-Volatile Dual In-line Memory Module (NVDIMM-N) is a persistent memory technology that uses memory DIMMs to store the data (just like DRAM) but retains the data in the event of a power lost or a system shut down, making the data persistent. The SNIA website provides a great overview and lot of resources on this technology.
Persistent Memory (PMem) technology layer provides the performance of memory (DRAM) with the persistence of traditional storage as depicted below:
PMem support is introduced in vSphere version 6.7 and can be combined with the following to increase performance of high-load applications: native PMem support in Windows Server 2016 and SQL Server 2016 SP1 and higher ; Enterprise Red Hat 7.4 or later ; SUSE Linux Enterprise 12, Service Pack 2 or later.
Exposing PMem modules to an ESXi host
Before a virtual machine (VM) will be able to consume a PMem based device, a hardware NVDIMMs must be made visible to an ESXi host. Most of configuration steps are automated and does not require user intervention, but it’s important to know where to find relevant information.
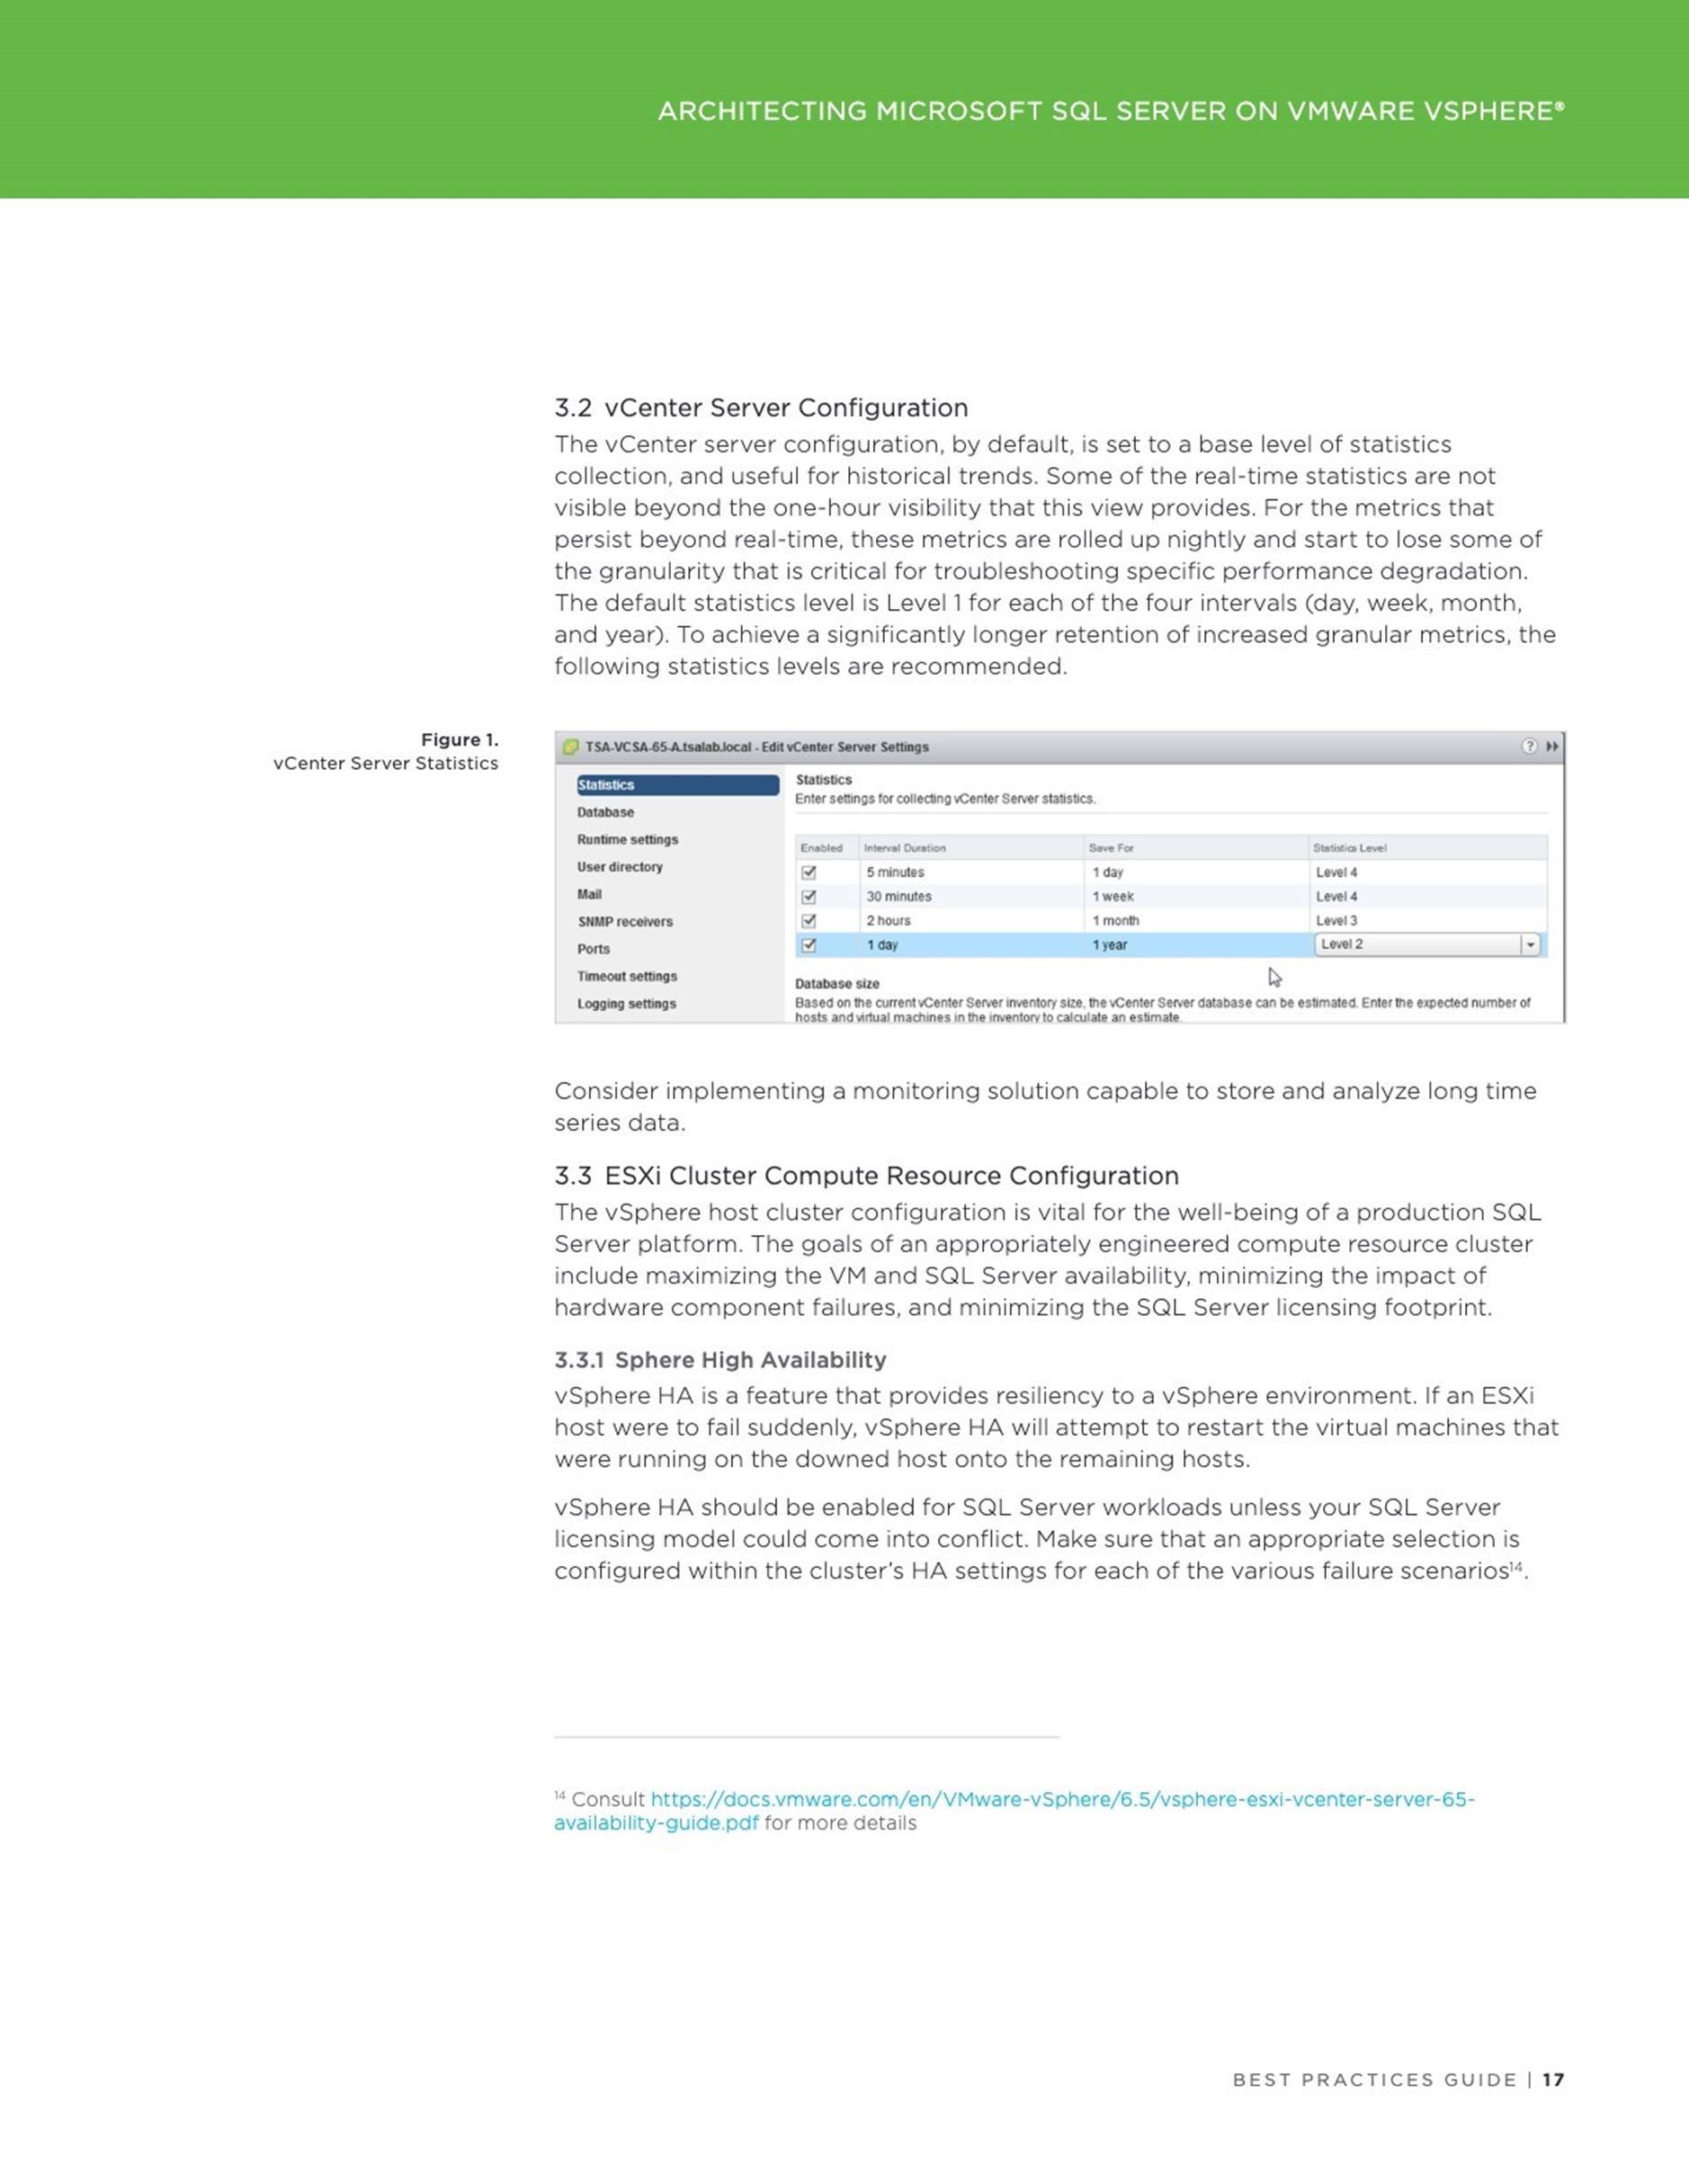
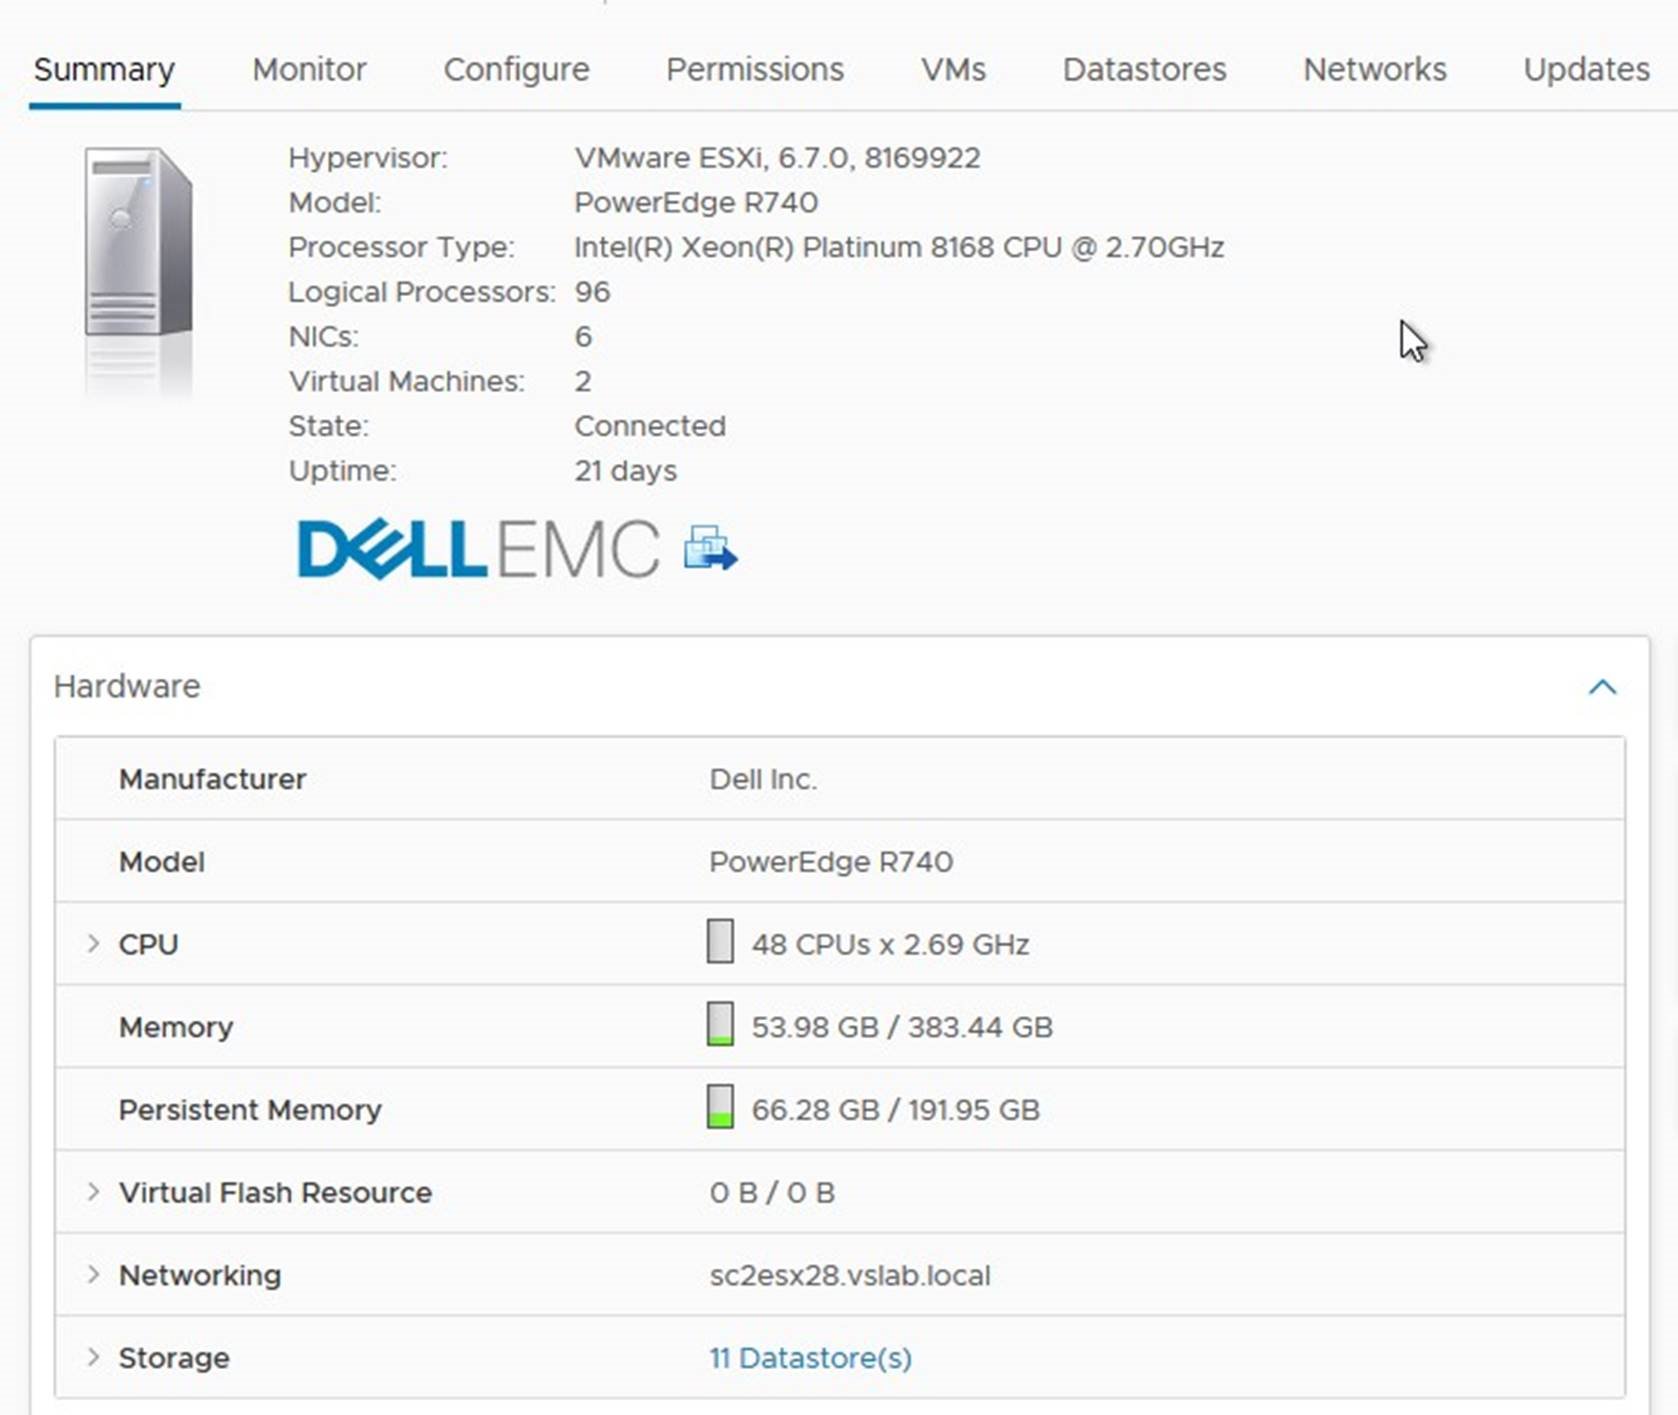
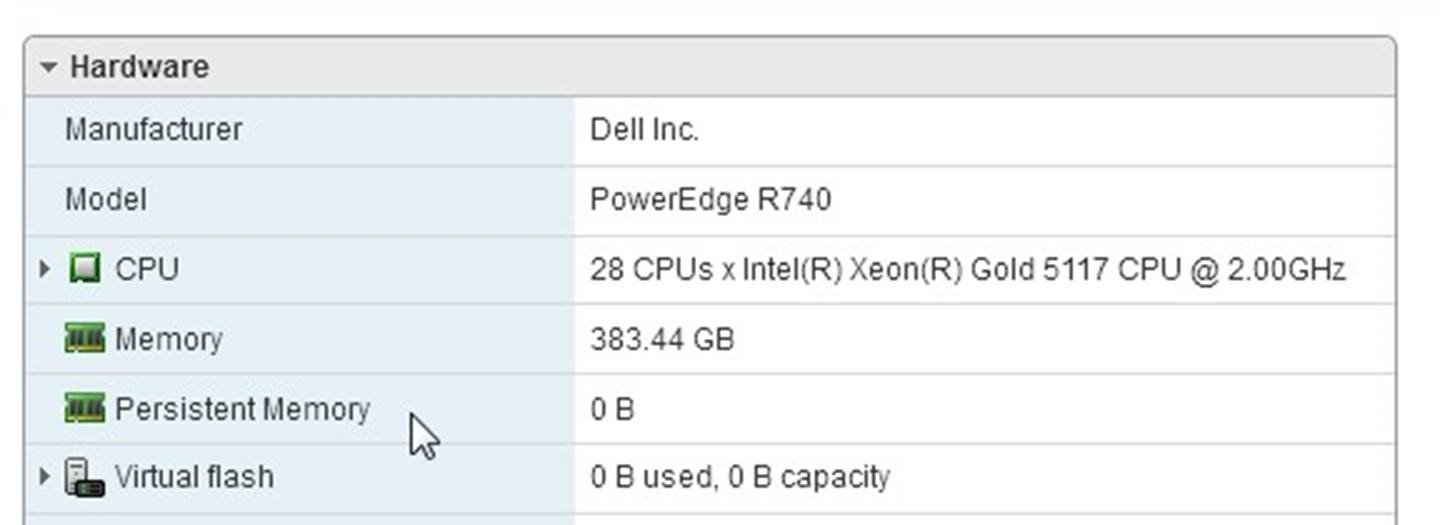
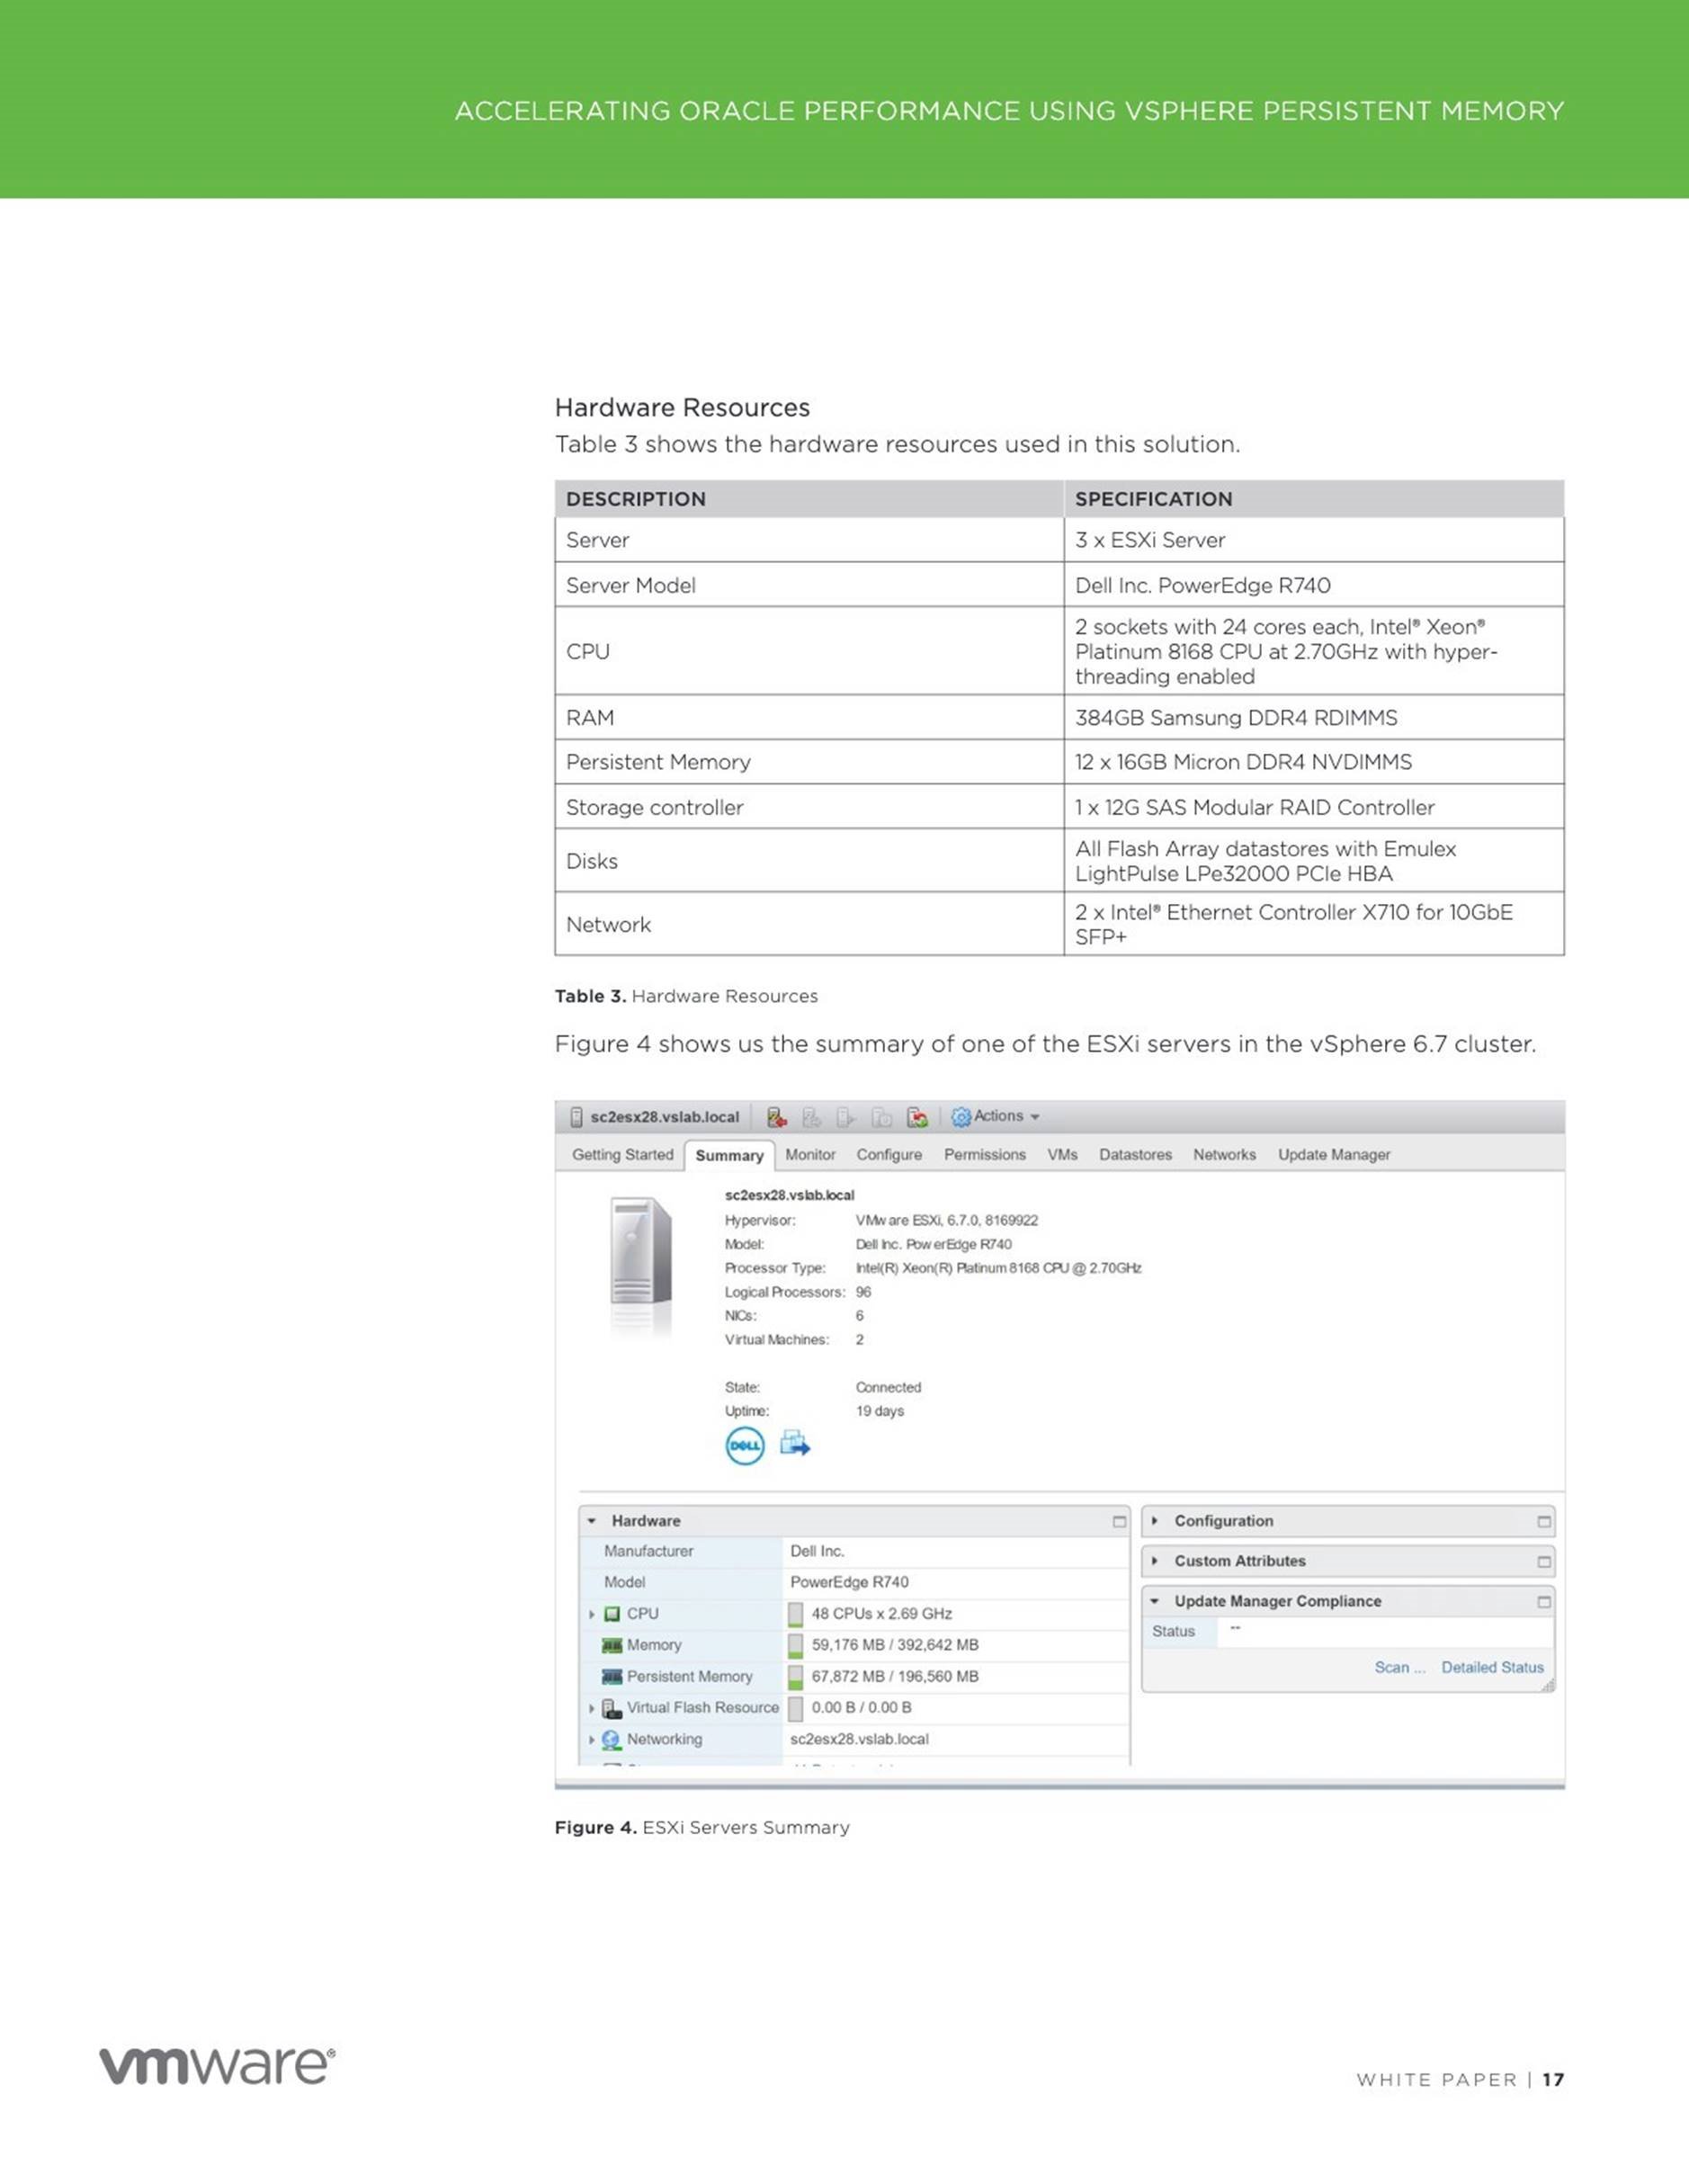
vSphere Clients (both Flash and HTML5 based) can be used to monitor the presence of PMem modules on the host. It can be done by checking the Summary Tab, and expanding the hardware frame with focus set on the ESXi server as shown below:
Host configuration menu does not have PMem related information in vSphere Clients now.
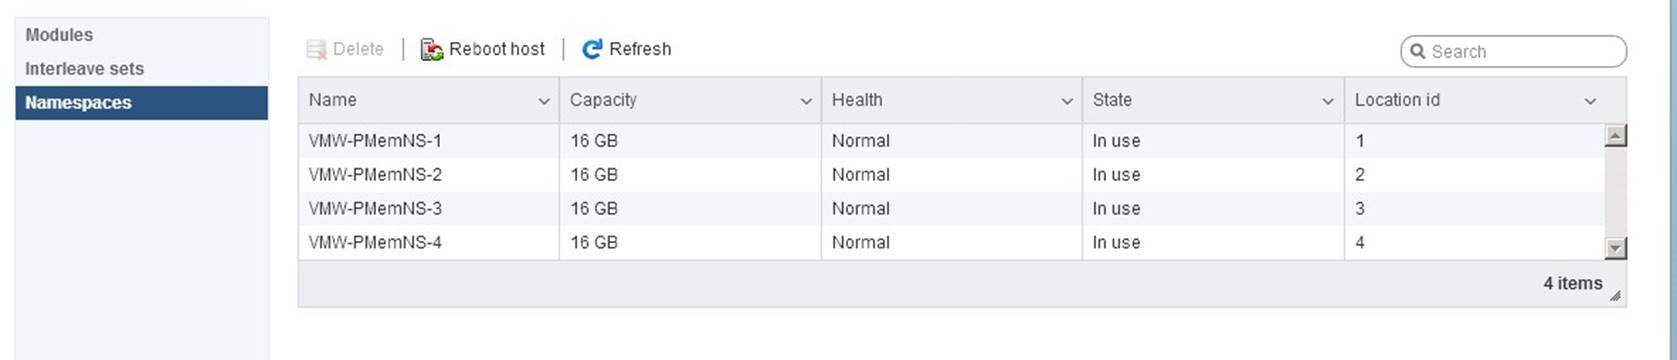
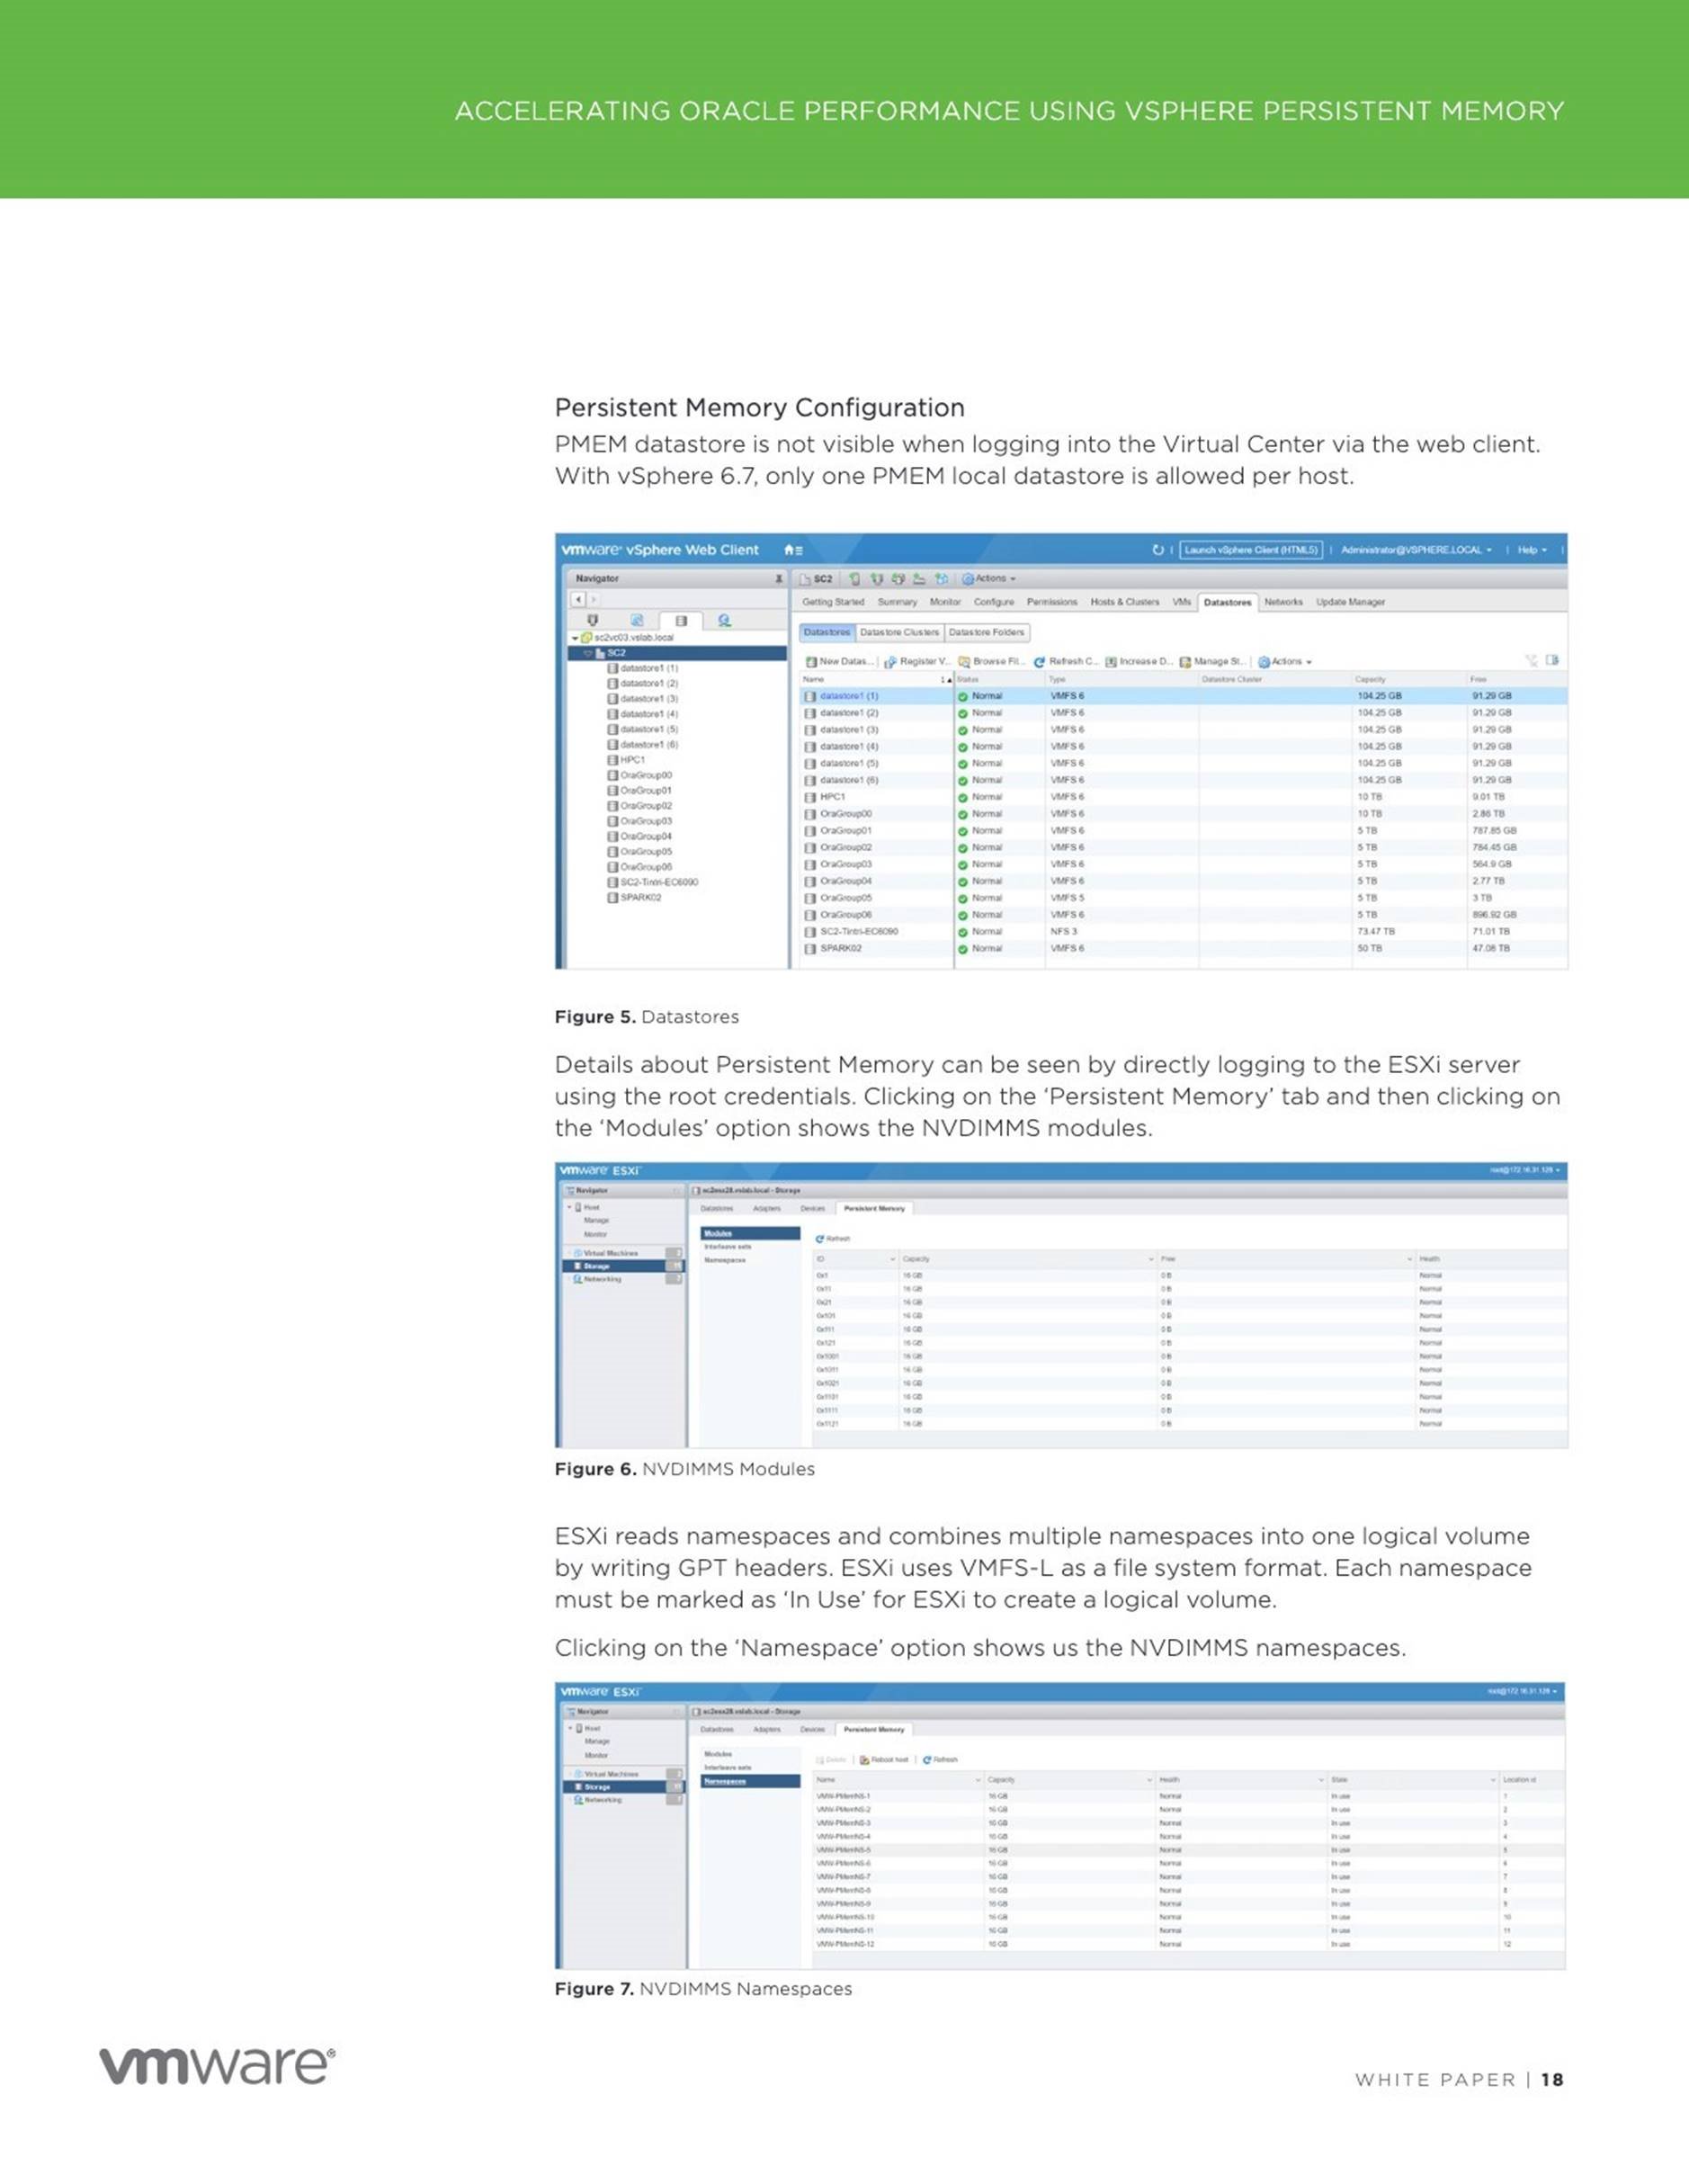
Much more details will be available after logging directly to an ESXi host with the VMware Host Client. Use a browser with the ESXi host name or IP address and credentials with the root level access to the host. If hardware NVDIMMs are present on the server, a new tab will be available on the ESXi host configuration page – “Persistent Memory”, containing three sub-tabs providing the information about available NVDIMMs:
ESXi hypervisor reads namespaces and combines multiple namespaces into one logical volume by writing GPT headers. ESXi uses VMFS-L as a file system format. Each namespace must be marked “In Use” for ESXi to create a logical volume. Refer to the troubleshooting section if this is not the case:
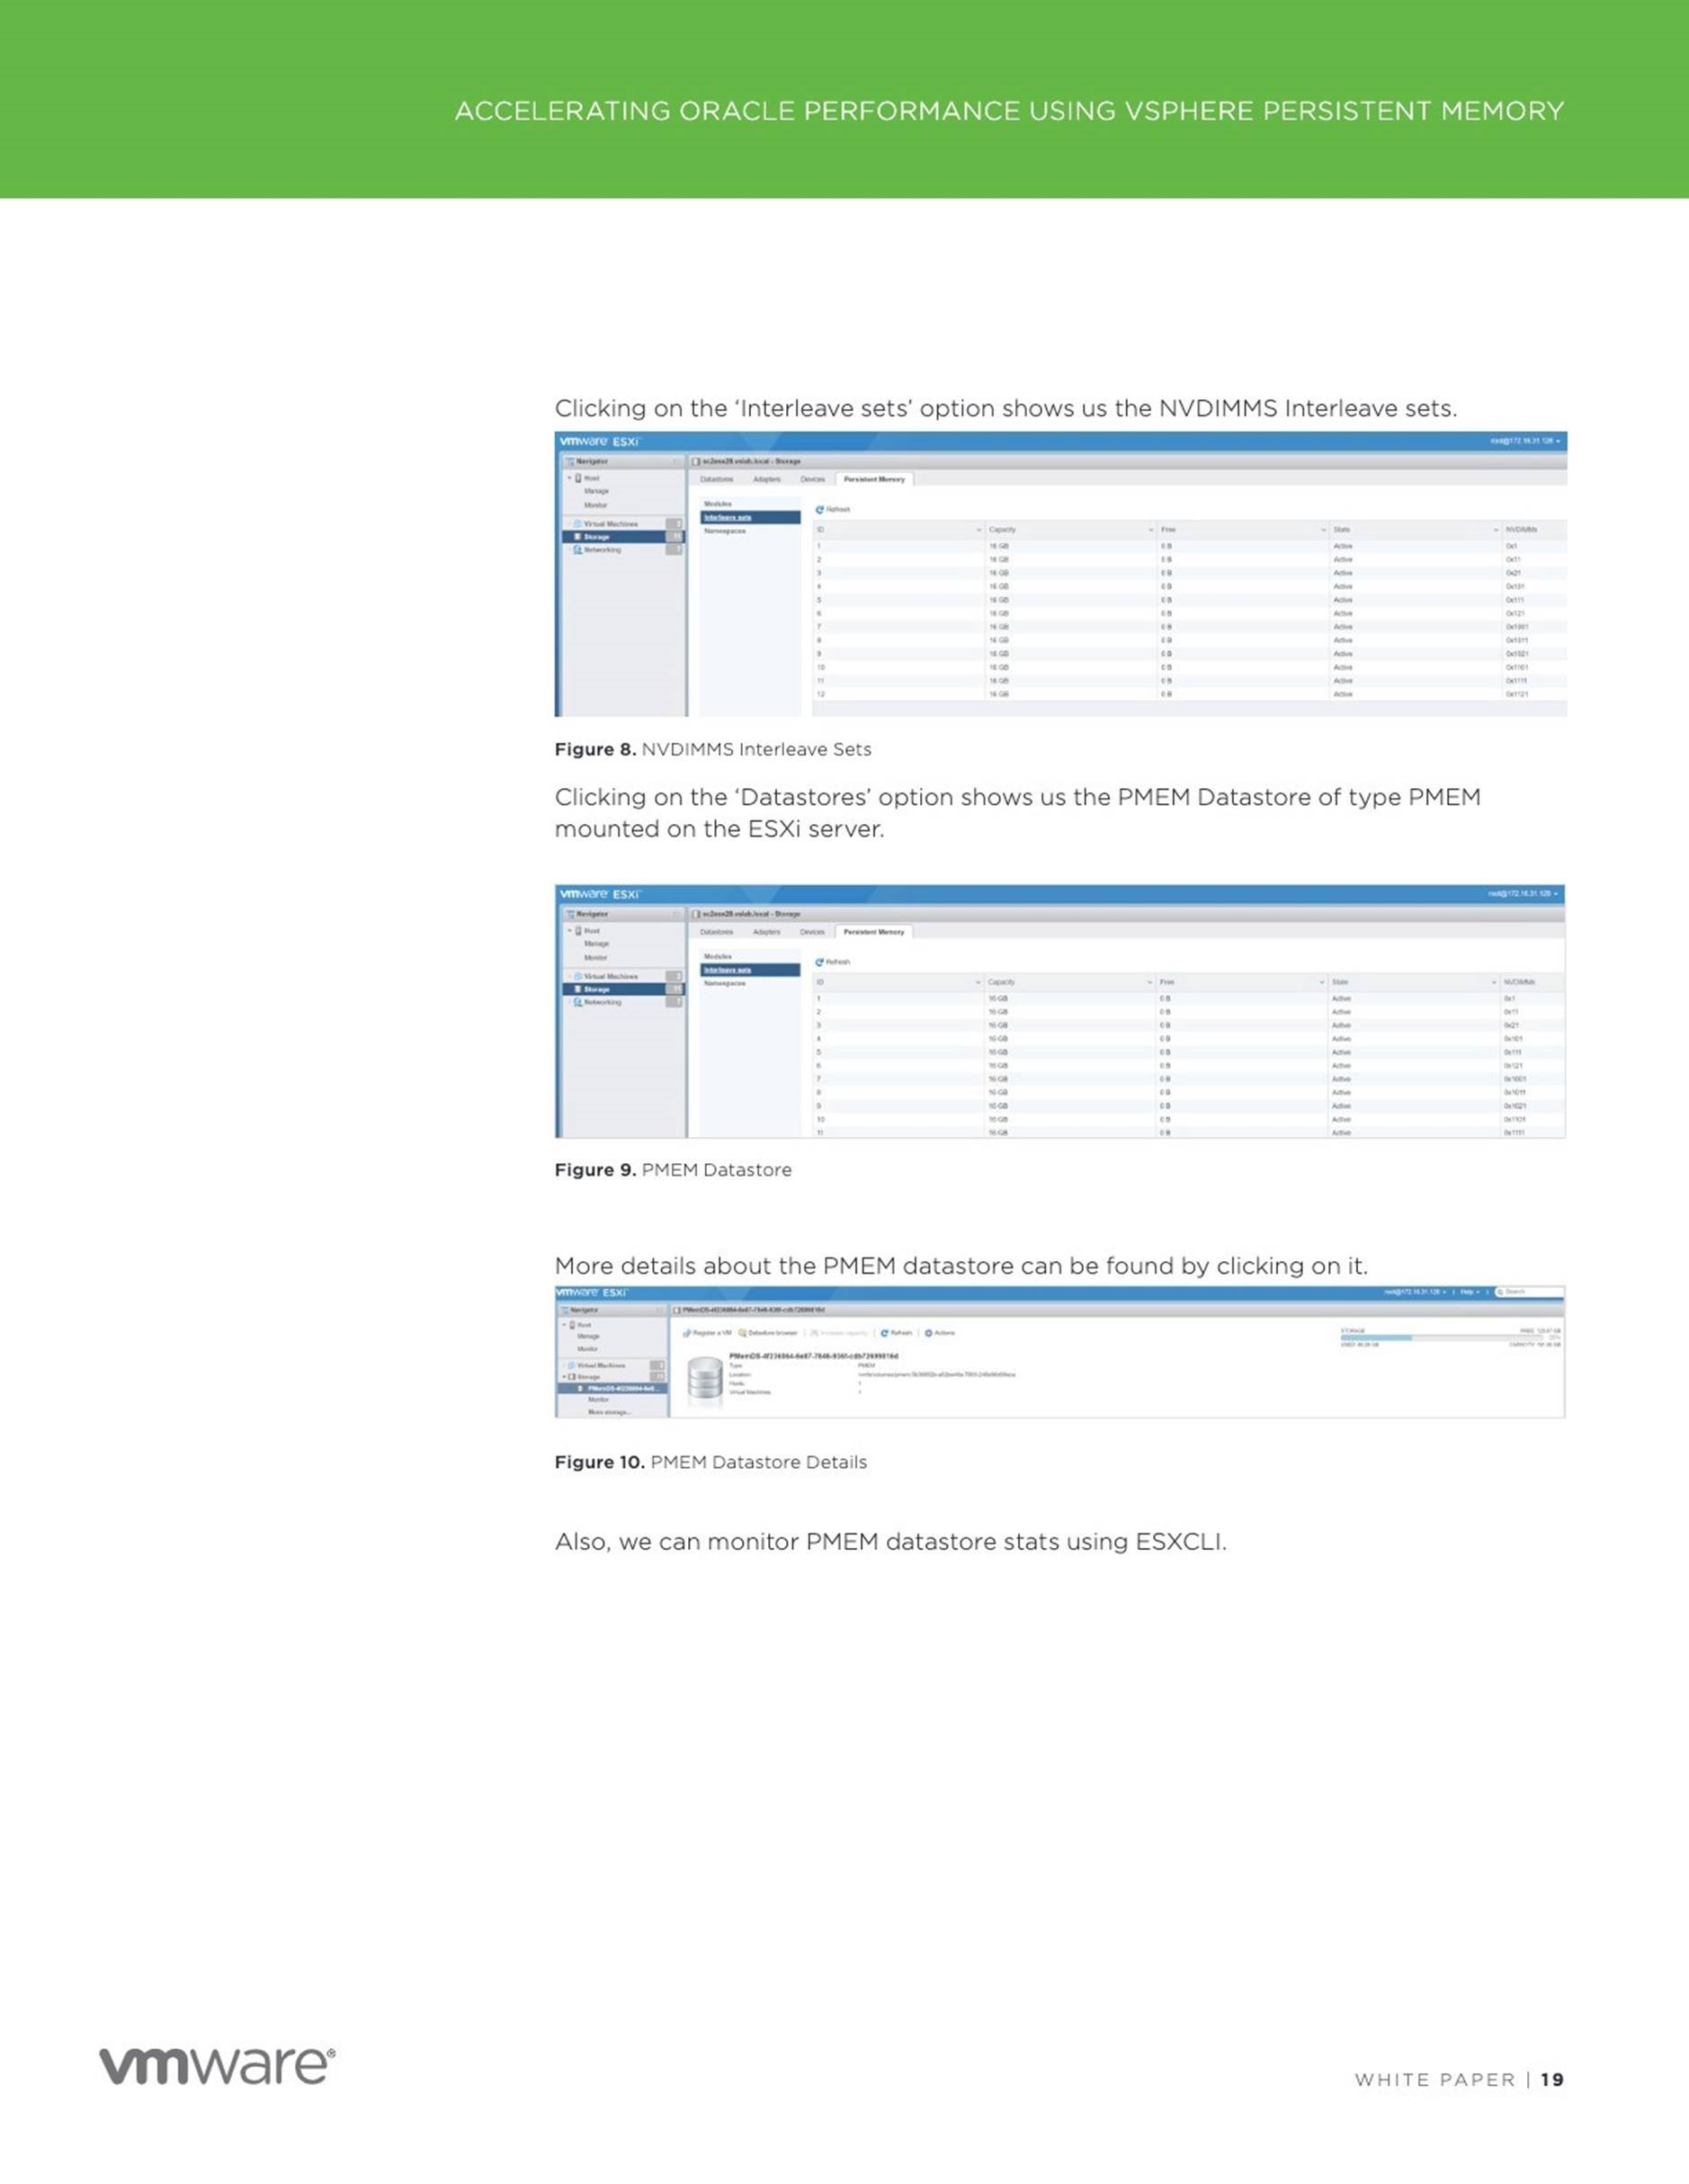
The result of the valid hardware configuration will be a datastore with the type “PMEM”, automatically created and ready to be consumed.
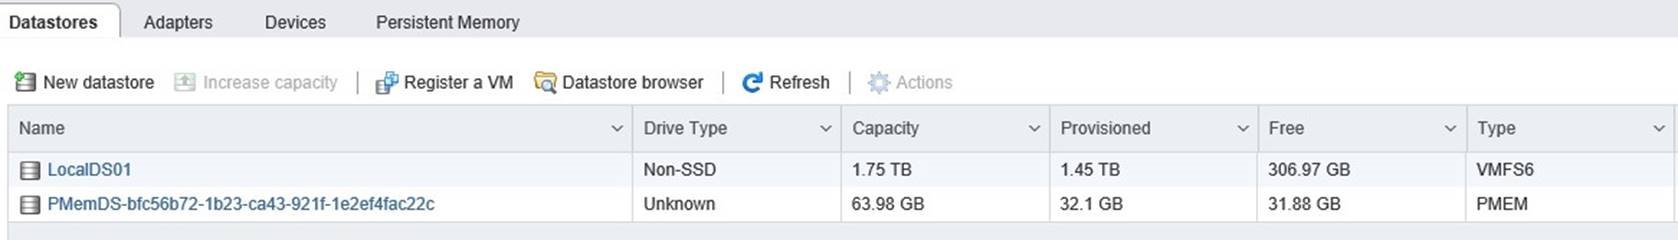
Note: A “PMEM” backend datastore is recreated after each reboot of the host. Before reboot, ALL VMs must be migrated of the host.
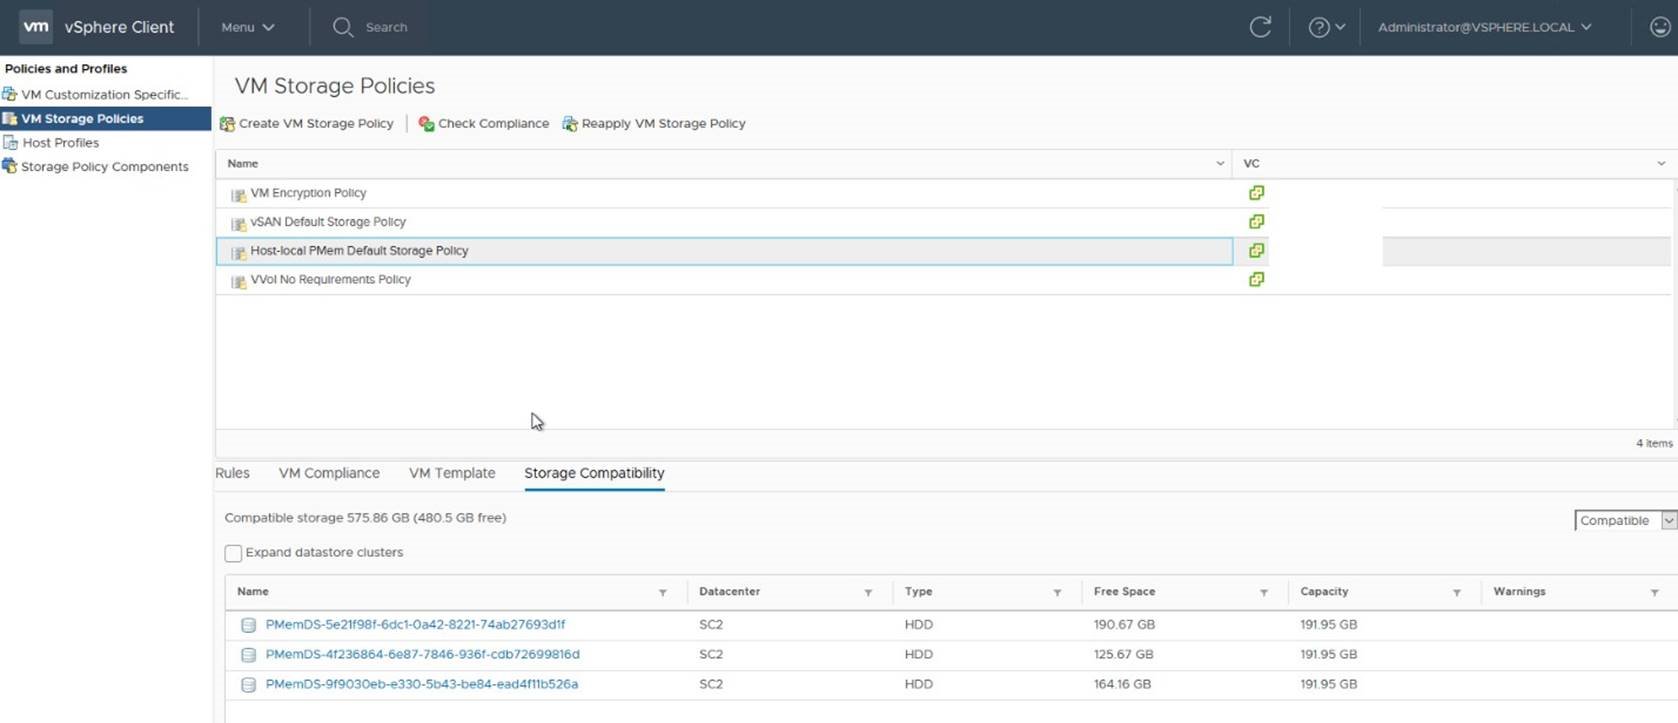
In vSphere Clients all available PMem datastores can be listed by navigating to the Policies and Profiles from the main menu and then selecting the VM
Storage Policies section and choosing Storage Compatibility in policy details:
Note following:
![]() VM with a vPMem device will be not protected by vSphere HA. More details can be found in the vSphere Resource Management Guide on the page 47.
VM with a vPMem device will be not protected by vSphere HA. More details can be found in the vSphere Resource Management Guide on the page 47.
![]() VM snapshot is not supported.
VM snapshot is not supported.
VM with a vPMem device must be excluded from VM level backup. If a VM was previously part of such backup, ensure to disable CBT before adding vNVDIMM to a VM.
Troubleshooting PMem
In rare cases, the PMem datastore will not be created automatically. It can be validated by using the hardware frame on the summary page of the ESXi host, showing 0 B Persistent memory present:
Navigating to the “Persistent Memory” – “Namespaces”, some namespaces are shown as “Not in use”.
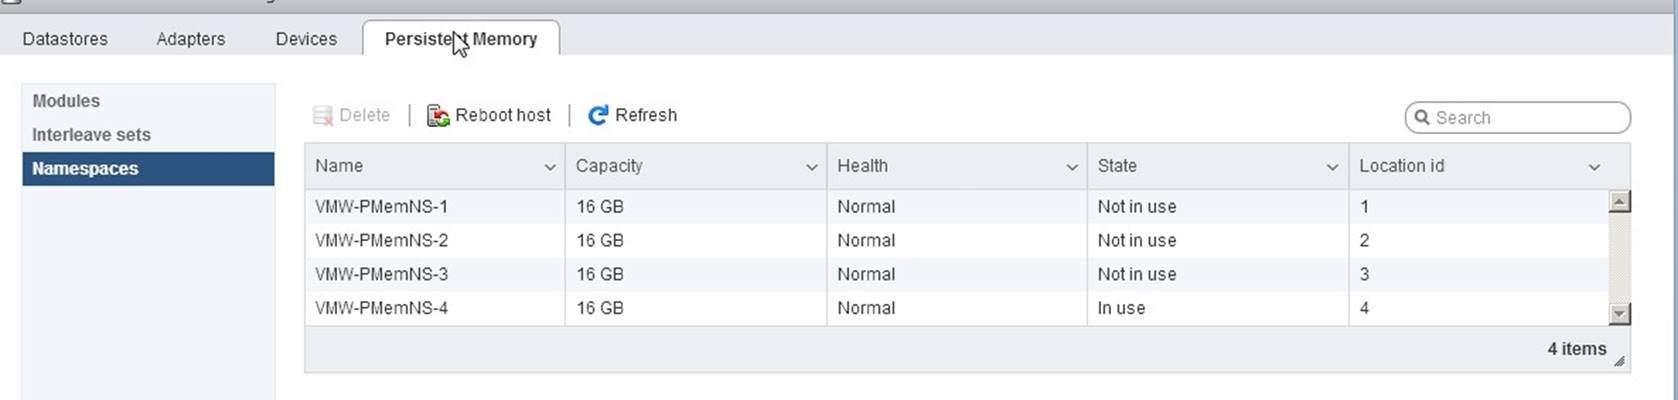
In this case, all namespaces must be removed by using the “Delete” button and a host needs to be restarted. After restart, all namespaces were correctly processed. Such configuration was observer on a dual boot physical server with multiple operating system installed and NVDIMMs being owned by another instance of the operation system.
Using the PMem
Persistent memory (PMem) can be consumed by virtual machines in two different modes:
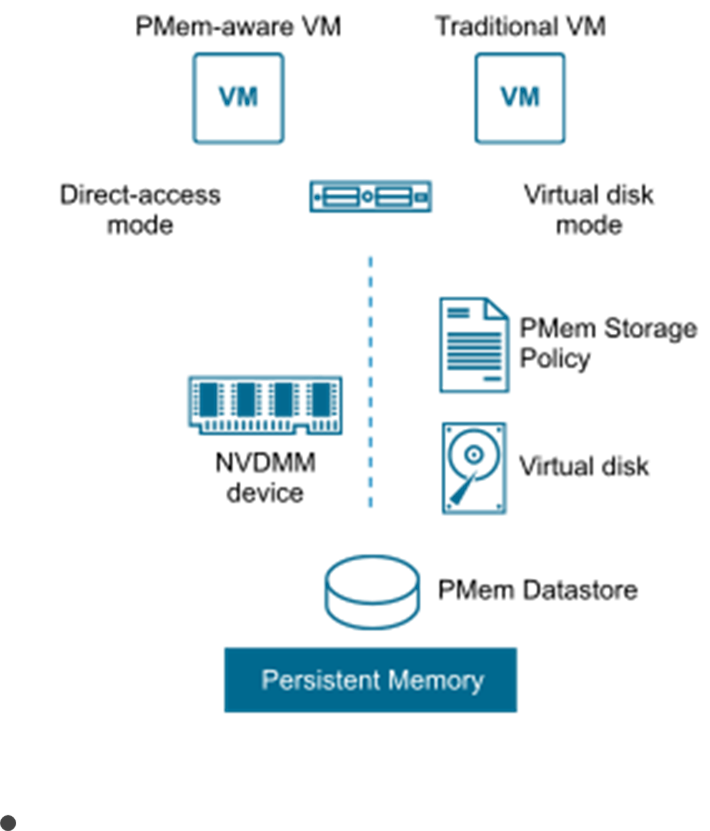 Virtual Persistent Memory (vPMem) or Direct-access mode. The hardware NVDIMM is exposed to a guest operating system as a virtual NVDIMM device. This enables a guest OS to use the PMem in byte addressable random mode. Support from the operation system and application is required.
![]() Virtual Persistent Memory Disk (vPMemDisk) or Virtual disk mode. The PMem can be accessed by the guest OS as a virtual SCSI device, and the virtual disk is stored on the PMem datastore. Any operating system can consume such device as a usual disk.
Virtual Persistent Memory Disk (vPMemDisk) or Virtual disk mode. The PMem can be accessed by the guest OS as a virtual SCSI device, and the virtual disk is stored on the PMem datastore. Any operating system can consume such device as a usual disk.
Both modes could be profitable for a virtualized application. In future posts we will see how applications can utilize virtual PMem using both modes mentioned above.
Article: https://blogs.vmware.com/apps/2018/07/accelerating-applicationsperforma…
Date: 2019-05-21
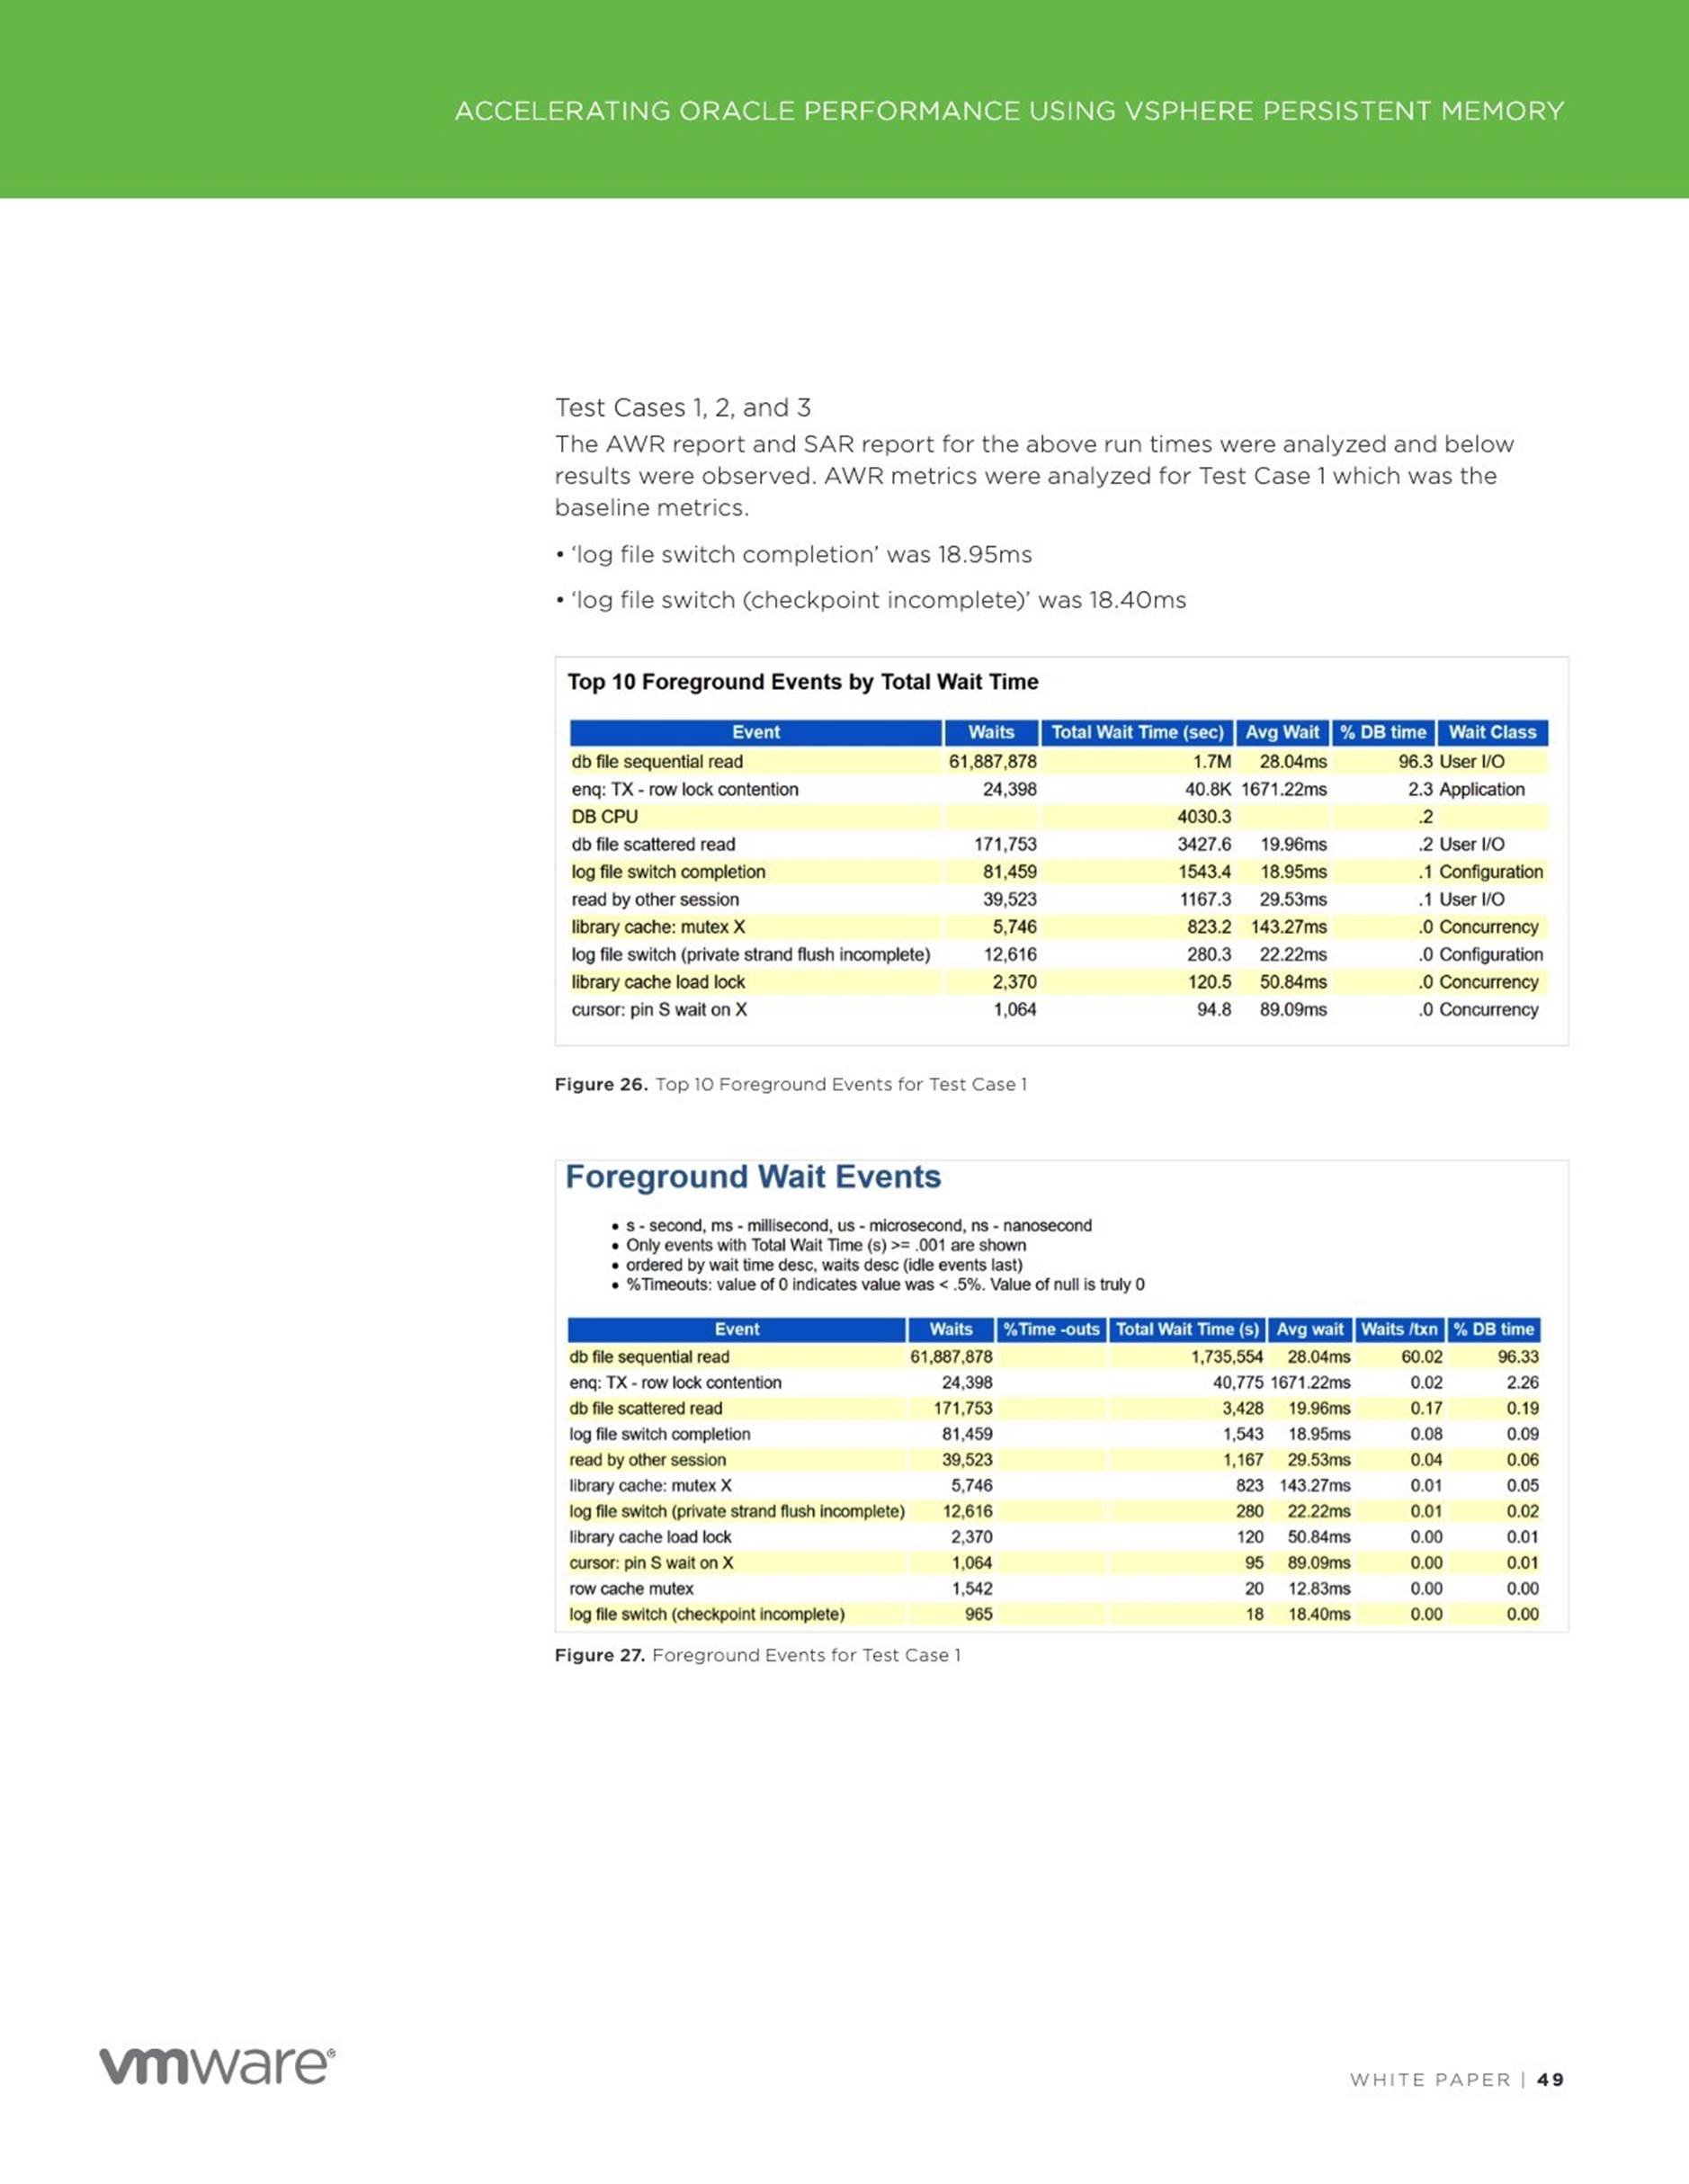
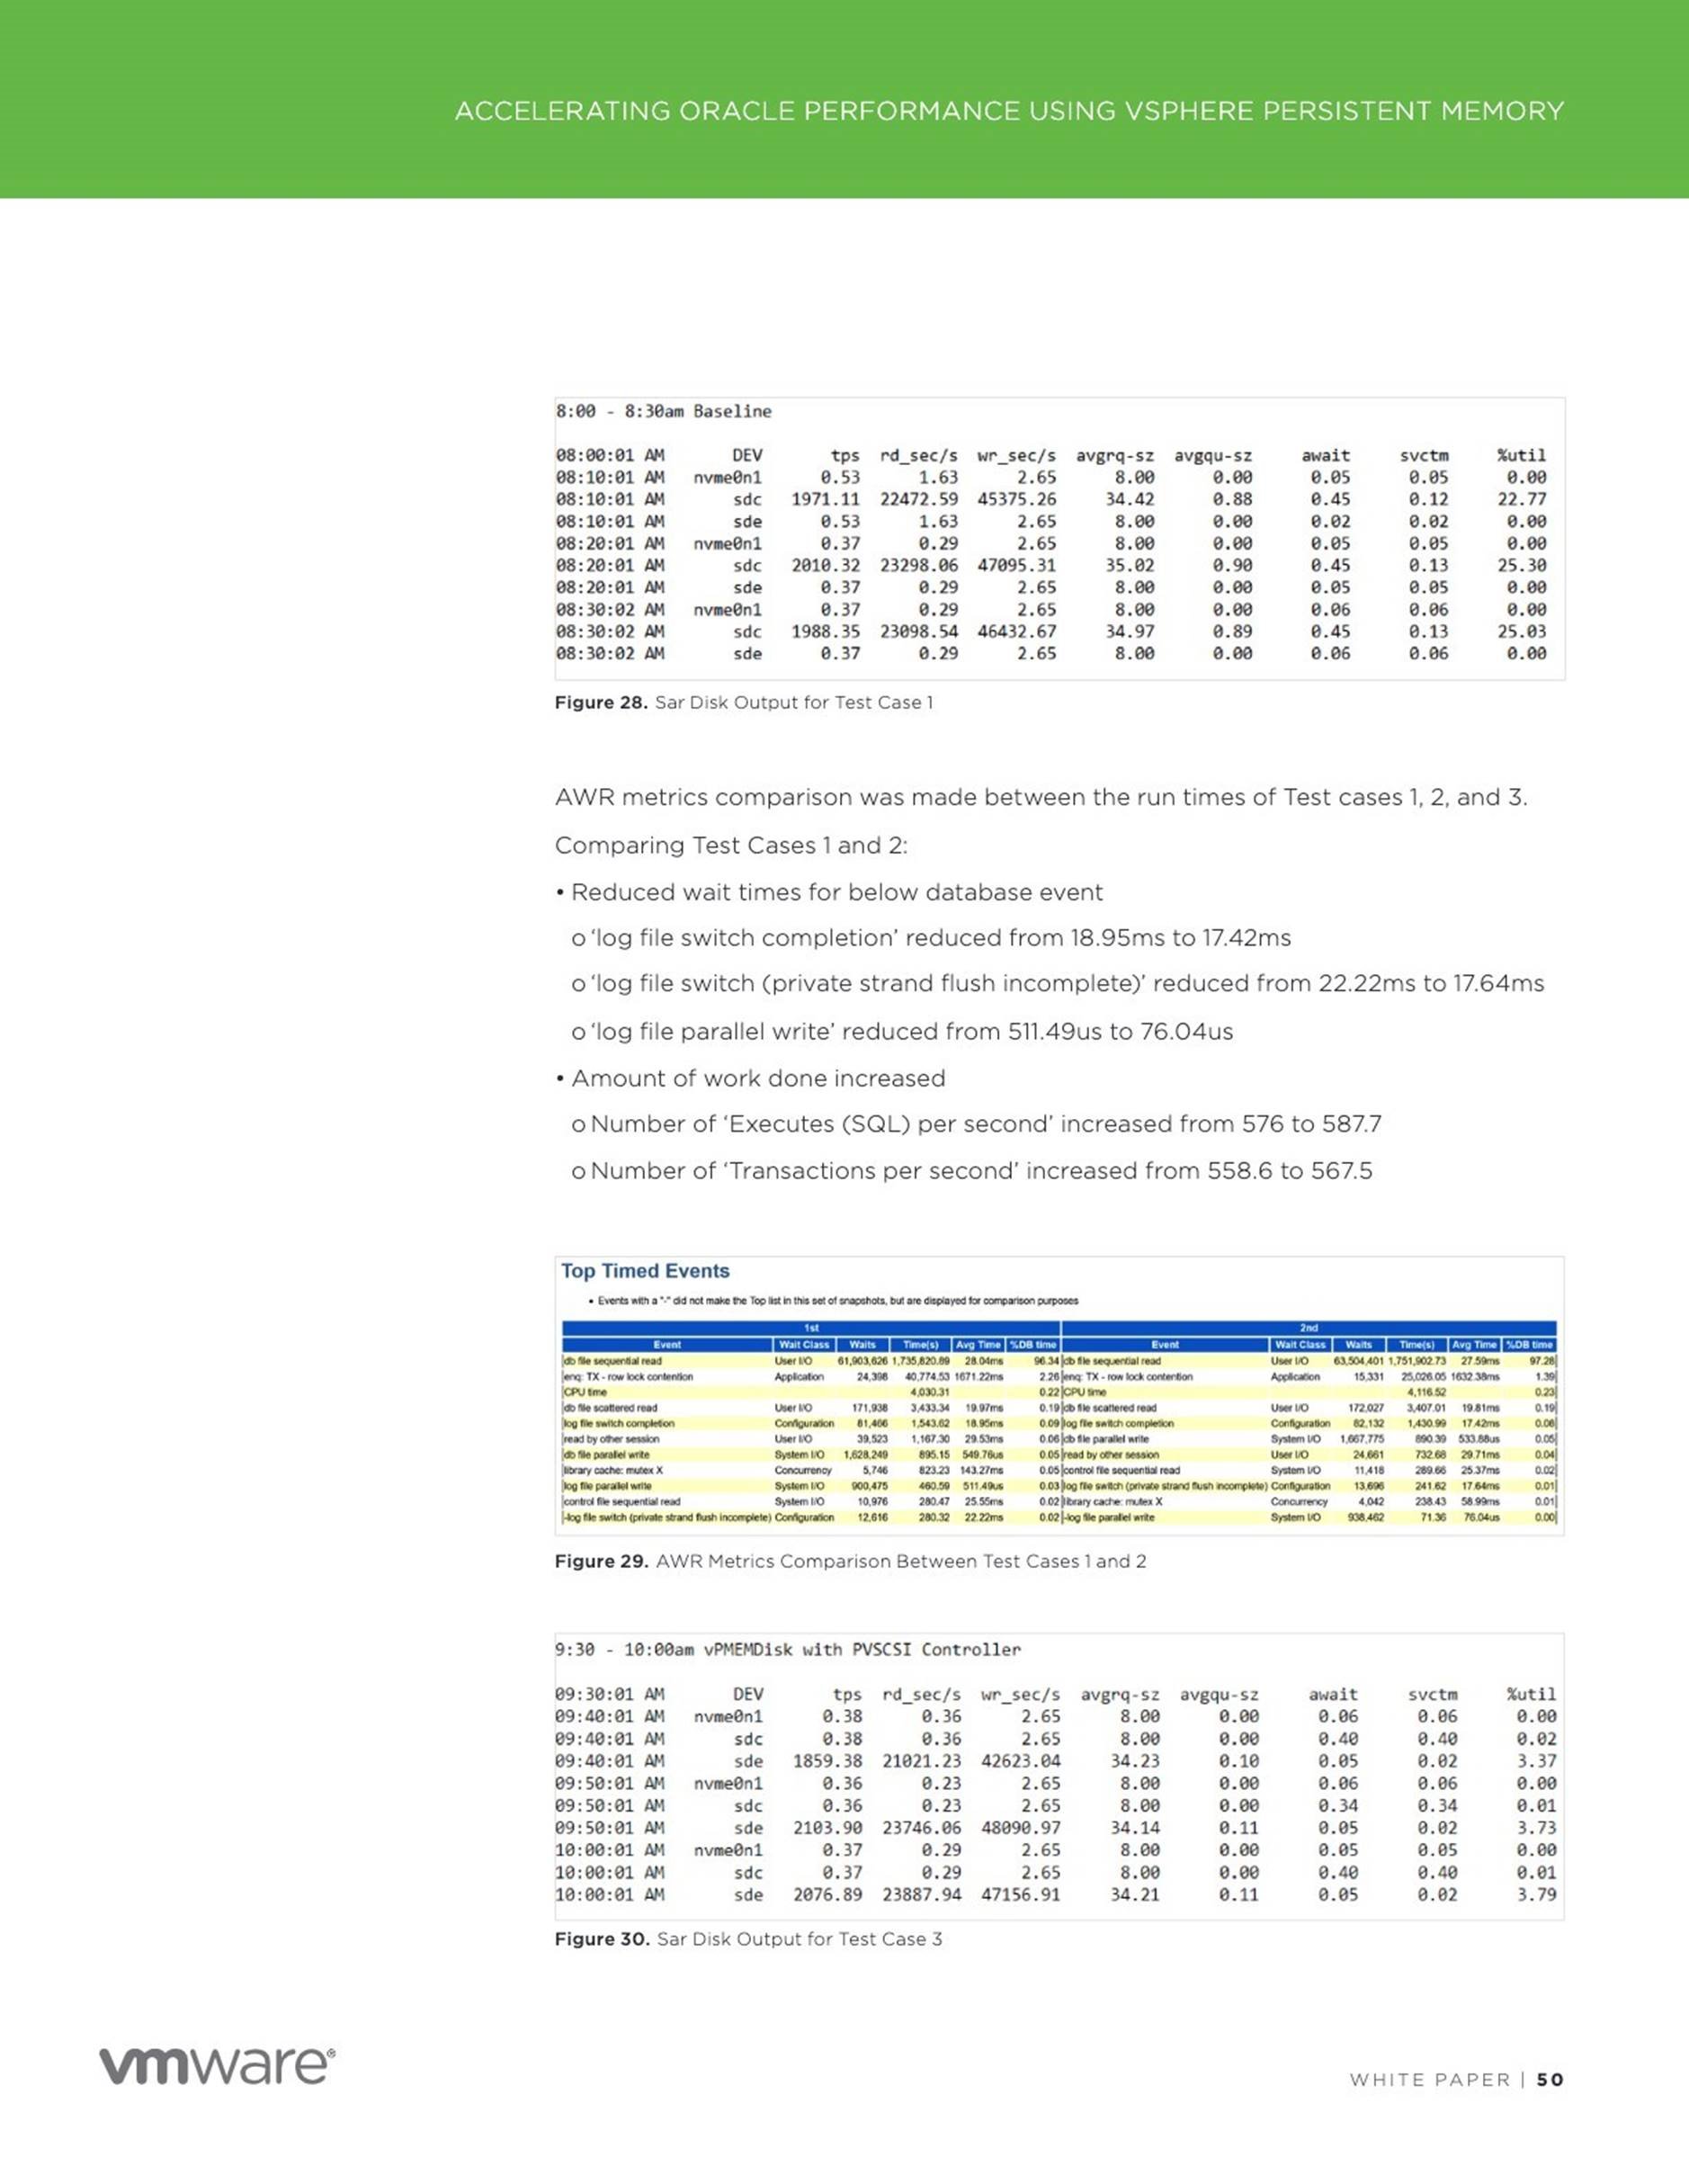
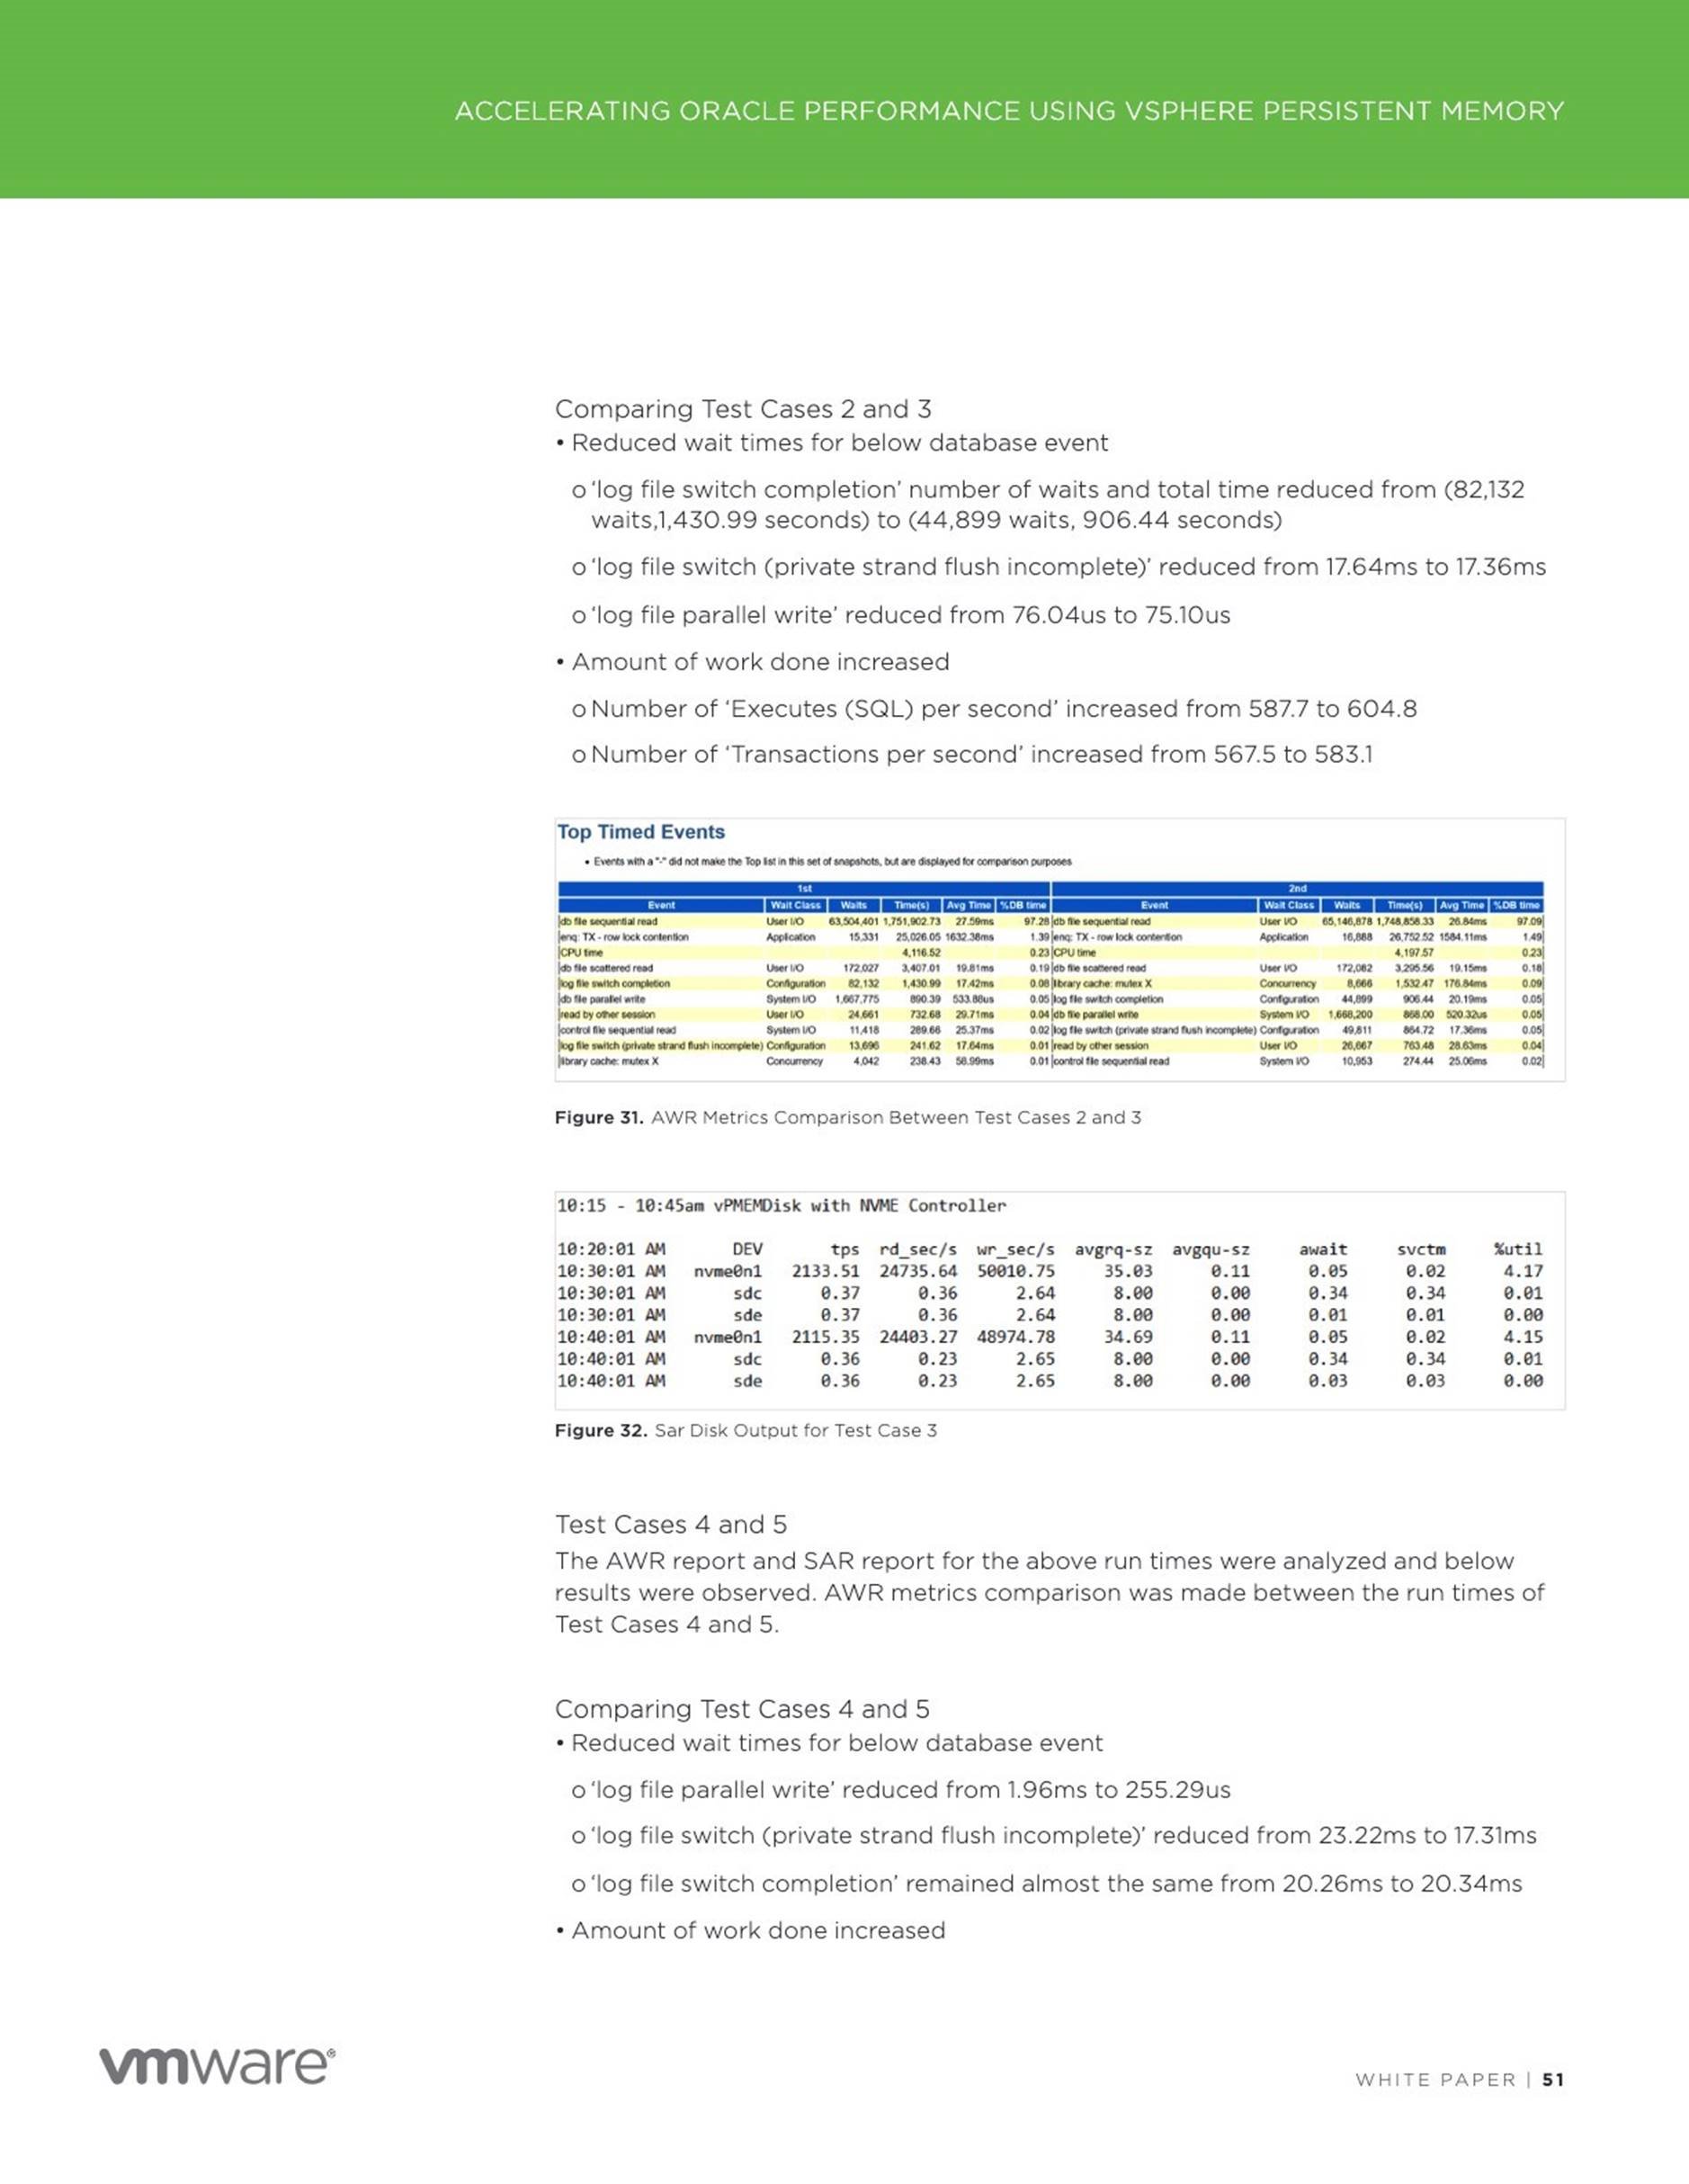
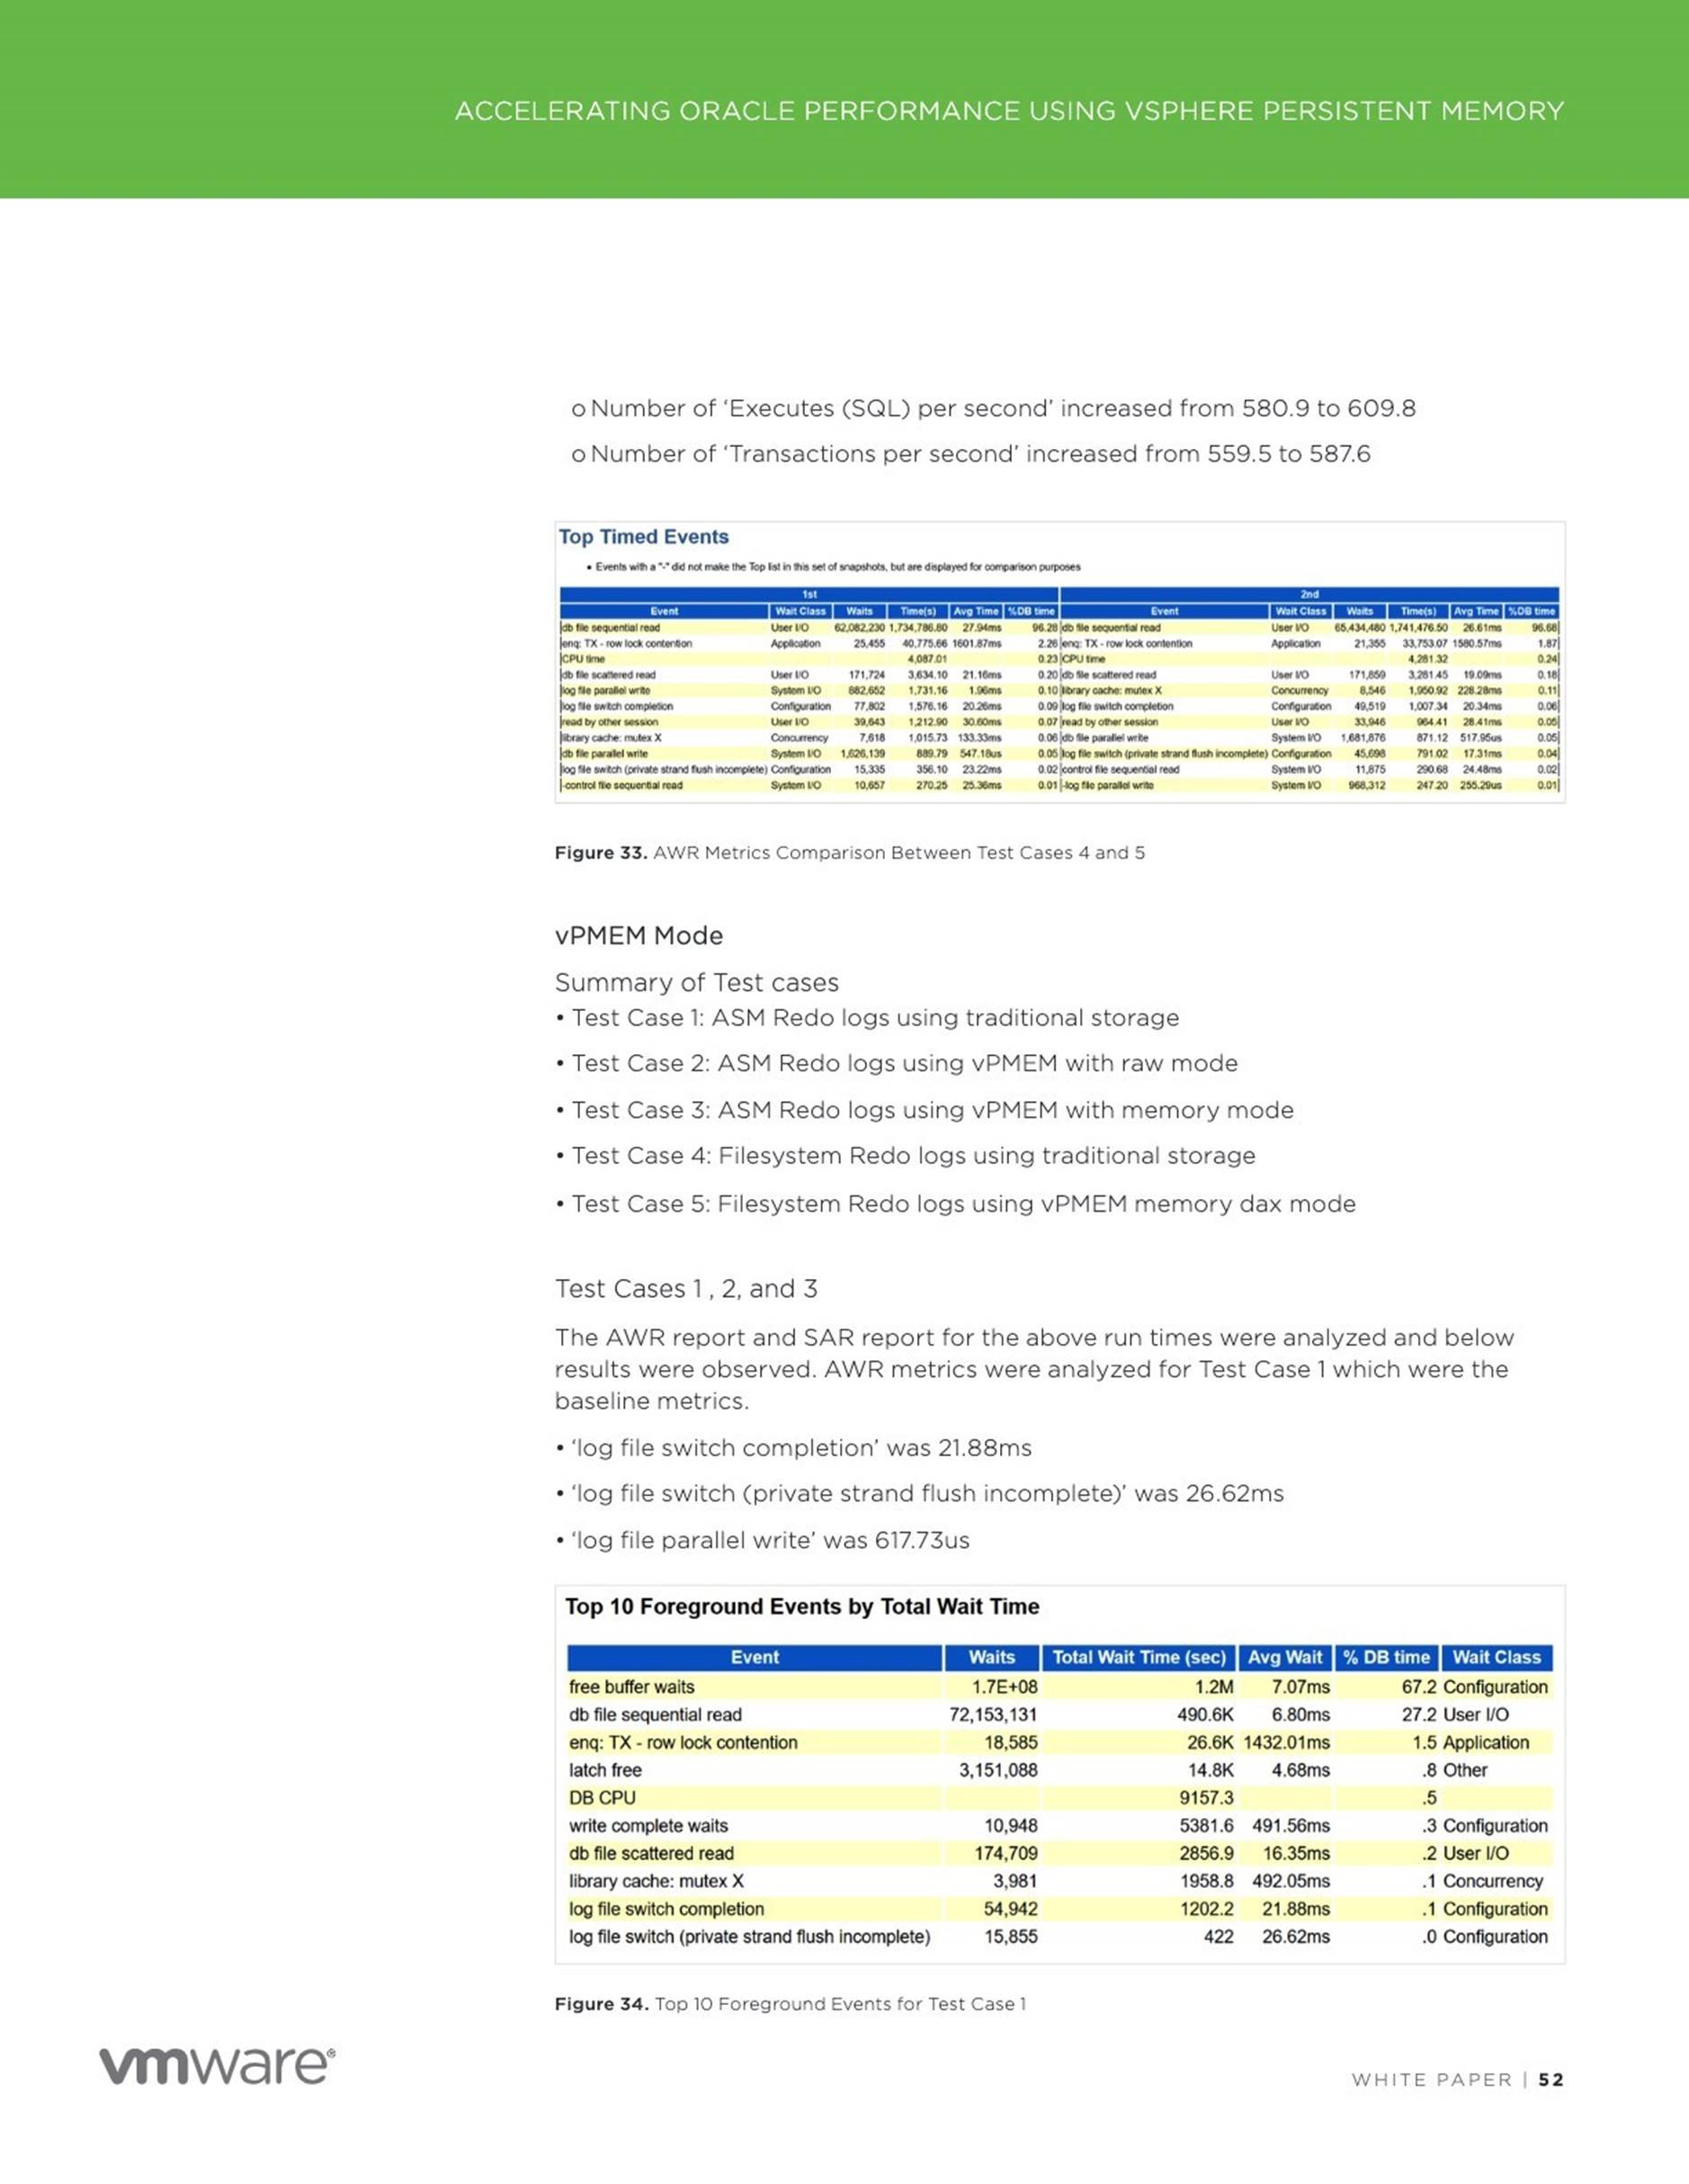
5 Accelerating Oracle Performance Using vSphere Persistent Memory
(PMEM)

6 Proof-of-Concept: Live Migration of Non-Prod SAP HANA on
Persistent Memory on vSphere

7 Extending Memory Capacity with VMware vSphere and Intel Optane
Memory Technology
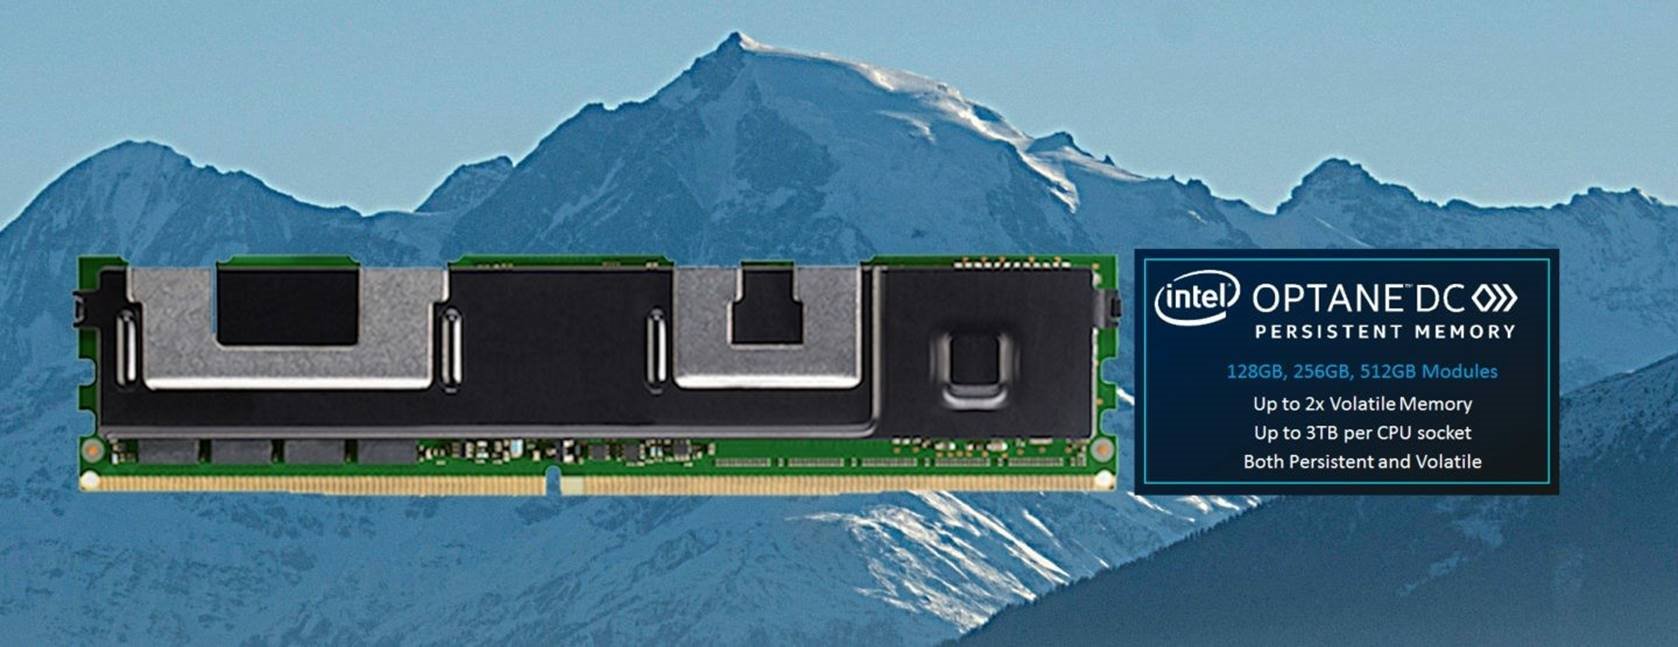
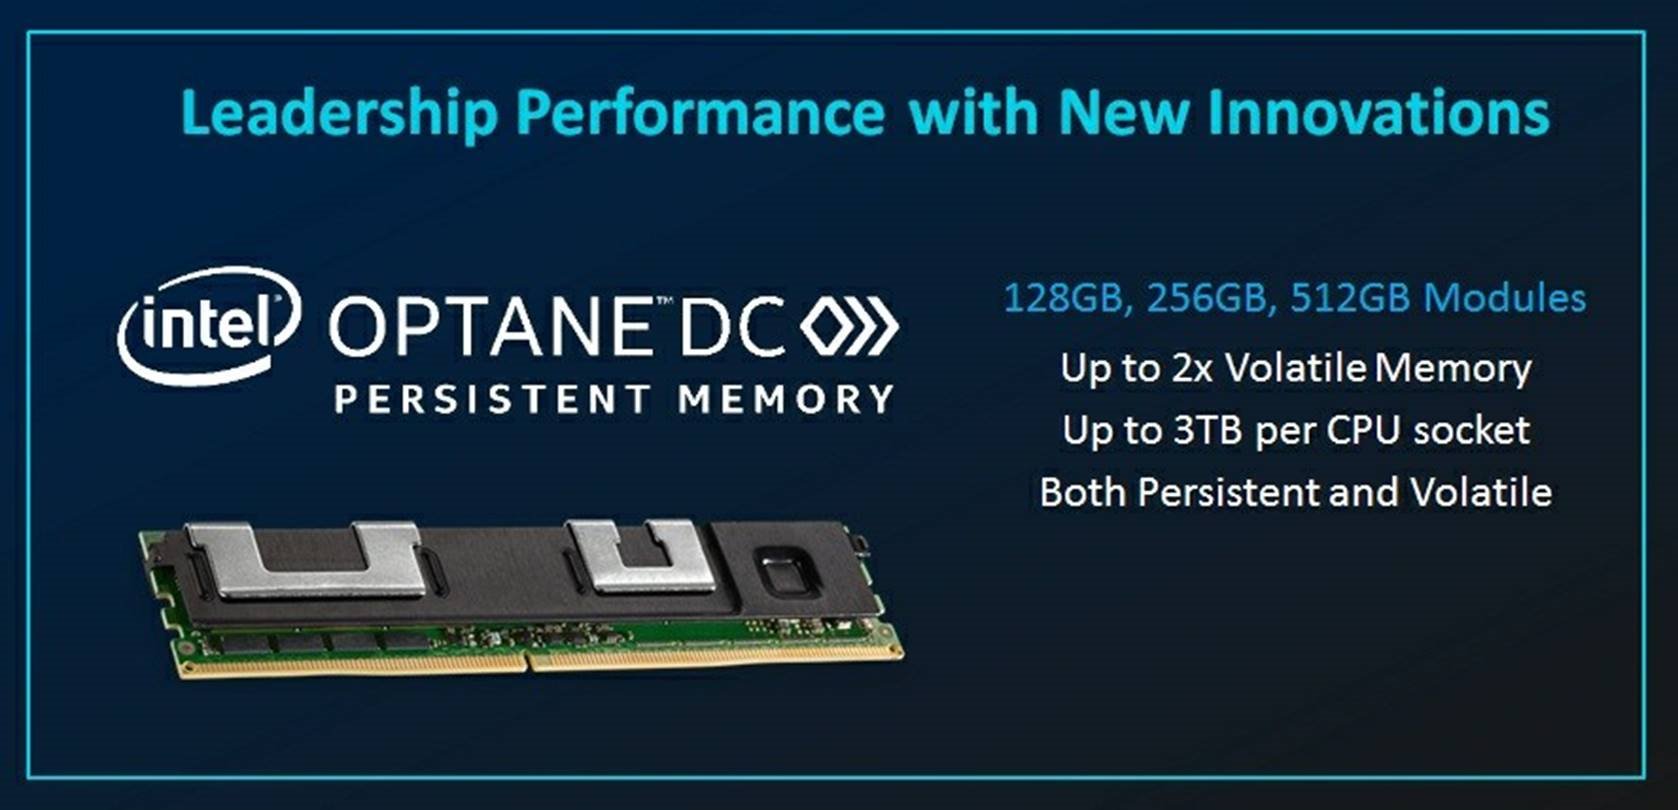
Next year, as part of a major server refresh, we should see productization of a new technology known as Intel® Optane™ DC Persistent Memory technology. This memory technology, supported on new Intel® Xeon® Scalable processors code-named “Cascade Lake,” represents a new class of memory and storage technology architected specifically for data center requirements. It offers a unique combination of high-capacity, affordability, and persistence. By so using this upcoming technology to move and maintain larger amounts of data closer to the processor, workloads and services can be optimized to reduce latencies and enhance performance.
My colleagues and I have been working on this technology with Intel since 2012; now our prototype labs are full of samples and it is pretty cool. Here are the key points that drew us initially to Intel® Optane™ DC Persistent Memory and which we believe are most relevant for VMware’s customers:
|
✱ |
No exotic hardware connectors required: the technology will be available in memory modules that will plug into the DIMM slots of the new Intel based servers alongside standard DRAM. |
|
✱ |
Supports a standard load/store memory access model with byte-level granularity. |
|
✱ |
Provides persistence for new applications and virtual machines. (This is a very exciting development for changing the memory storage paradigm and VMware vSphere should be your choice for embracing these new applications.) |
|
✱ |
Provides a volatile mode for an easy uplift to existing workloads with no changes to software. |
As we have discussed at VMworld, VMware is leading the charge to change the storage/memory paradigm with virtualization of byte-addressable persistent memory to new applications. That work will really payoff for future platforms with Intel Optane DC Persistent Memory. (We will re-post the details here later.) But, today, let’s focus instead on the newly announced volatile mode of this technology: “Memory mode.” When used in memory mode, the new Intel memory technology can greatly increase the memory capacity available to software in a platform when compared with the capacity of DRAM. This increase in capacity requires no changes to your existing software, operating systems, or virtual machines.
For example, consider a server with two processor sockets (“2-socket server”) with 24 DIMM slots running VMware vSphere. If all the DIMM slots are populated with 64-GiB DIMMs, then the maximum volatile memory capacity is
1536-GiB. If instead, those DIMM slots were populated with a mixture of 512-
GiB memory modules of Intel Optane DC Persistent Memory and 64-GiB DRAM DIMMs using a future version of vSphere, the maximum volatile memory capacity could be 6144-GiB — without needing to make any changes to your virtual machines.
Of course, your mileage may vary and there is not a free lunch: although the latency of the Intel memory technology is good, nothing today can beat the latency of DRAM. But Intel makes up the difference in many cases by using DRAM in the other memory DIMM slots as a cache for the most frequentlyaccessed data, while the Intel Optane DC Persistent Memory provides large memory capacity. The caching is handled transparently by the Intel Xeon
Scalable processor’s memory controller.
The net effect is that this is a very viable technology for memory-capacitybound workloads. It can consolidate a larger number of virtual machines on a server than possible in the past without any changes to the virtual machines. It also allows running virtual machines with much larger DRAM requirements. For VMware’s customers, this means flexibility. You can dynamically repurpose server hardware for any workload, including performance-intensive machine learning and analytics applications. Not having to dedicate speciallyconfigured servers for certain workloads allows you to maximize your infrastructure investments, doing more with fewer servers.
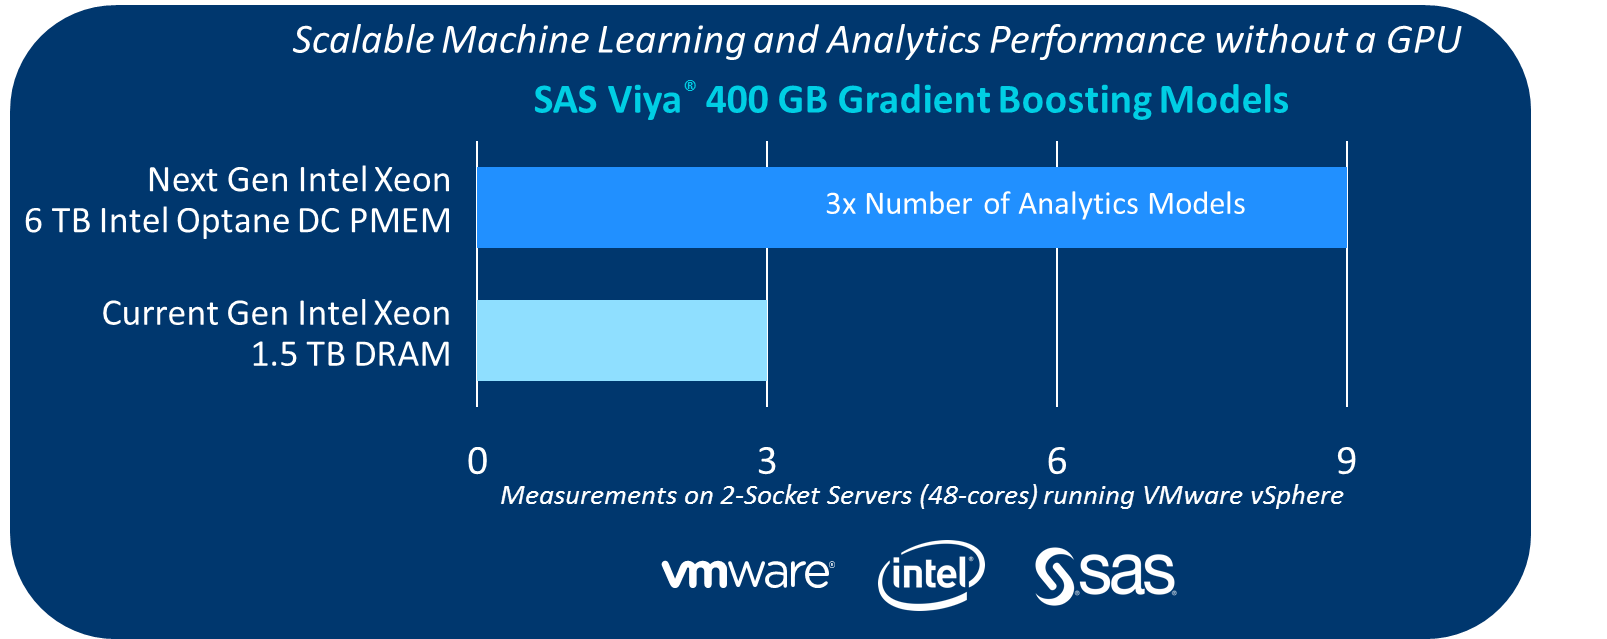
Extending Virtualized SAS Analytics Capacity
Rather than taking just our word for the benefit to VMware’s customers, VMware and Intel partnered with SAS, the global leader in enterprise analytics, to demonstrate the value. SAS provides a unified, open analytics platform replete with cutting-edge algorithms and AI capabilities.
Specifically, we performed tests using SAS® Viya®, which is a cloud enabled, in-memory, analytics engine that provides quick, accurate and reliable analytical insights. The scalability of SAS Viya made it the right choice to measure the number of models that could be simultaneously executed on each of two systems configured below. Please note that the “Cascade Lake” test system is configured with twelve 512-GiB Intel Optane DC Persistent Memory DIMMs for a total volatile capacity of 6-TiB.
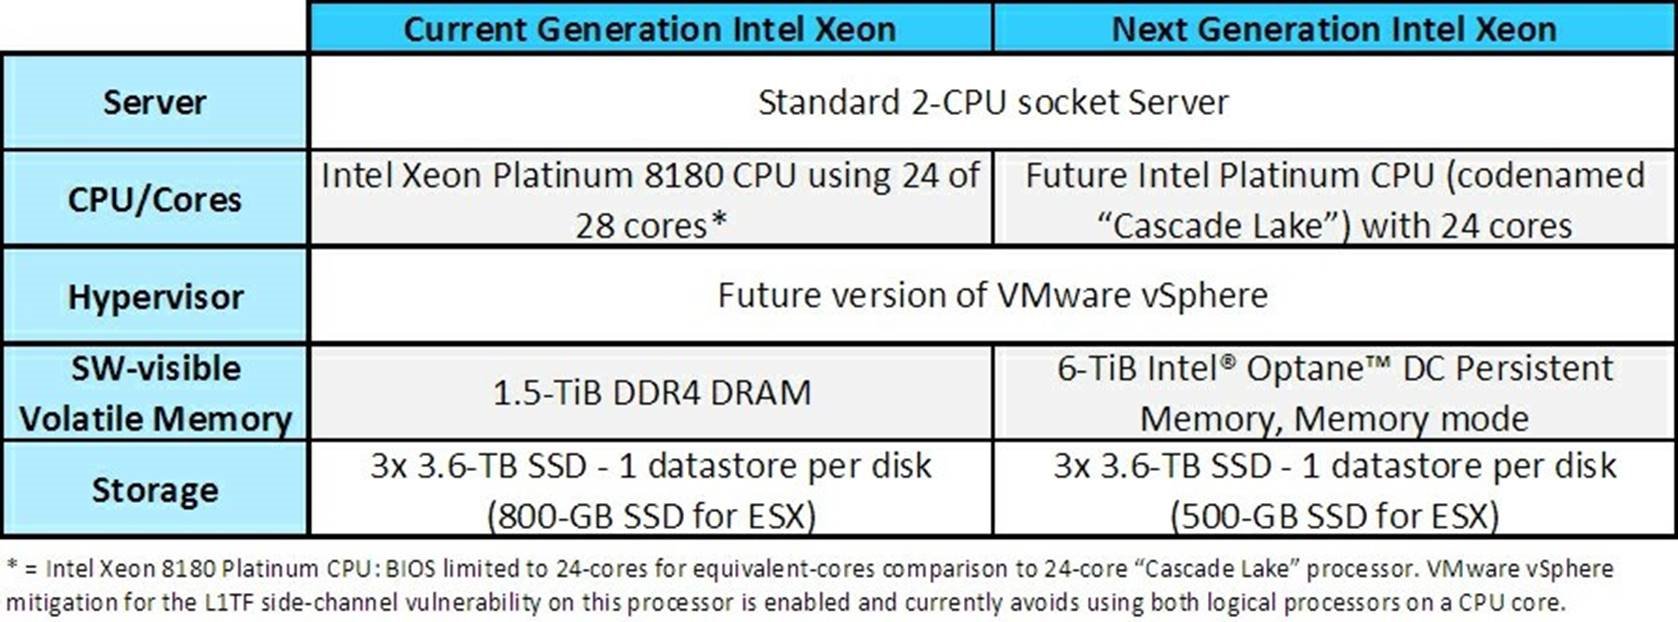
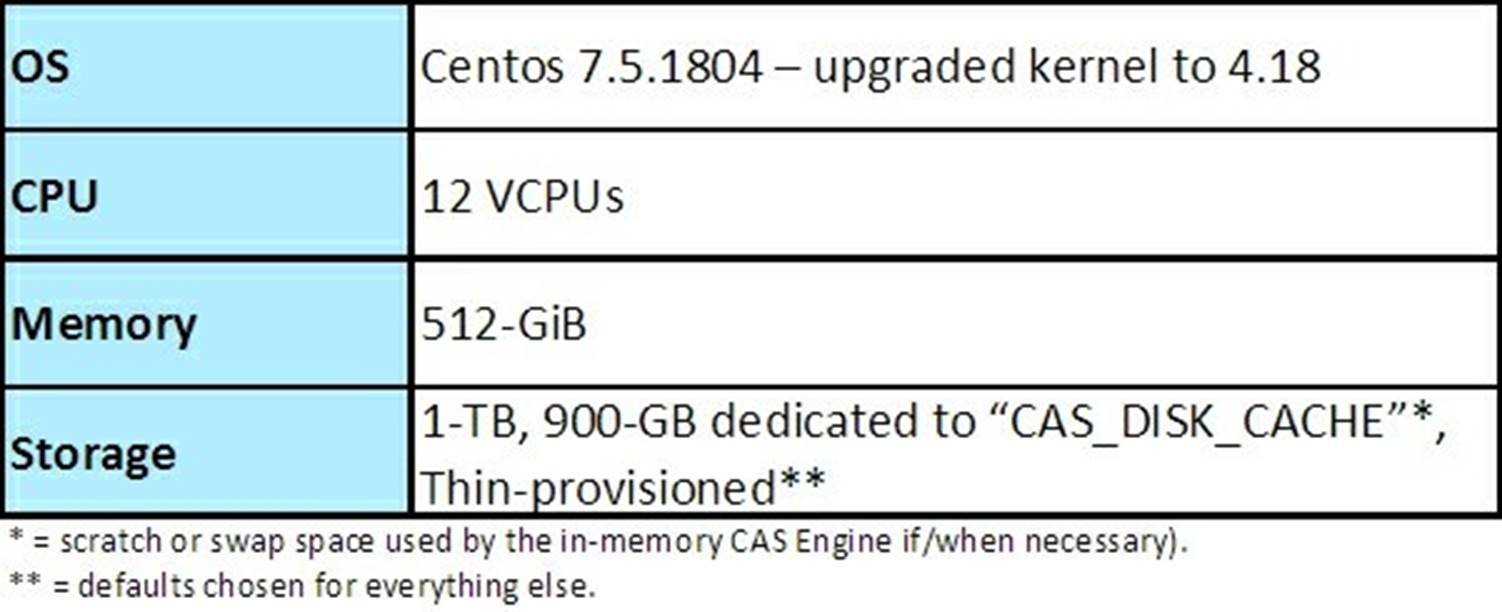
A future version of VMware vSphere was installed on each host. Identical VMware virtual machines (VM) for the SAS® Viya® 3.4 workload were created with the below configuration. Each VM consumes 400-GiB of raw data for the analytics task. Most of the remaining memory on each VM is consumed by the application and related meta data. The VMs and models were run concurrently in batch for each test scenario (i.e., varying number of simultaneous modeling jobs) on both servers.
The Results: Unlocking the Power of AI and
Analytics
Today’s 2-socket server configured with 1.5-TiB of memory can normally run only up to 3 virtual machines concurrently (1 VM per disk/datastore) because more VMs would require more memory than is practical to populate. On a server using Intel’s “Cascade Lake” processors with 6-TiB of Intel Optane DC Persistent Memory in memory mode, our testing shows that we can run the same 3 VMs, or double, or triple the number of VMs – up to nine virtual machines (3 VMs per disk/datastore) while meeting an analyst’s turnaround expectations.
Our measurements shown in the chart above means that more predictive models can run concurrently on tomorrow’s 2-socket server with virtualization than today’s. Let’s use an example to show why this can lead to better analysis.
Today, an analyst focused on the probability of an individual contracting Type 2 Diabetes in a given population would have to create a one-size-fits-all predictive model because of the memory limitations of the current generation servers. This would be adequate, on average, but the analyst would have some difficulty properly predicting the tail-ends of this kind of distribution.
But, in the future, using the next generation Intel Xeon Processor and its new memory technology, the analyst can do finer-grain modeling of the outcome probability with the same class of server platform by creating a separate model for each combination of age group, gender, socioeconomic status, and geographic location, etc. And SAS® Viya® makes it simpler to automatically create an independent model for each target segment and virtualize the modeling job, thus increasing accuracy and relevancy in the analysis.
Modeling more variables can provide more accurate predictions for better decision support. Healthcare providers can use this information for preventative purposes for at risk individuals or to know who will develop diabetes and why? This can make a significant difference for both the individual’s health as well as the economy.
Closing Thoughts
The results show that a future version of VMware vSphere using the memory mode of Intel Optane DC Persistent Memory can triple the number of virtualized SAS analytics workloads that can run on a standard 2-socket server. Previously, you would need a 4-socket server to run these many models concurrently. Note again that no changes were made to the VM to extract this benefit. Your workloads may see the same benefit. We think it is worth investigating further.
You won’t have to wait long for these processor and memory capabilities from
Intel in 2019. When Intel launches Intel Optane DC Persistent Memory,
VMware intends support at launch of both memory and persistent modes.
Acknowledgements
Many experts in the VMware vSphere engineering team provided the foundation for support of this new technology aided by our fantastic prototypes team and qualified by our talented Hardware-Enablement and
Quality Engineering teams. Generating the results and helping to write this blog required help from many external folks also:
|
S A S |
Michael Ingraham, Jeff Owens, Oskar Eriksson, Mitzi Krellwitz, Karina Estrada |
|
I n t e l |
Suleyman Sair, Mike Ferron-Jones, Karthik Narayanan, Arakere Ramesh, Kristie Mann, Jack Vargas, Michael Strassmaier, Yashmeet Khopkar, Omid Meshkin, Victor Lee, Fal Diabate. |
Links
|
✱ |
Type 2 Diabetes is a gradual affliction that surpises many when it starts having a noticeable effect on their health. So, some friendly advice from a Type 1 Diabetic of 40 years: get tested now. See www.diabetes.org |
Article: https://octo.vmware.com/vmware-and-intel-optane-dc-pmem/
Date: 2019-05-21
8 Virtualized Persistent Memory with VMware vSphere 6.7 and HPE
ProLiant Gen10 Servers
HPE and VMware have been delivering innovative solutions for our joint customers to further their virtualization and hybrid cloud journeys. Recently, we announced VMware Cloud Foundation support with HPE Synergy allowing customers to better build and operate their private cloud environments at scale.
Today, I am glad to welcome Bret Gibbs from HPE to share with us the joint work our engineering and product teams have been doing in enabling persistent memory architecture for customers to leverage new levels of performance for business applications.
Guest blog by Bret Gibbs, HPE Persistent Memory Product Manager

VMware announced the latest version of the industry-leading virtualization and cloud platform – vSphere 6.7 in April 2018. VMware vSphere 6.7 brings a lot of great new features and innovations but there’s one that I’m particularly excited about – vSphere Persistent Memory. What’s so exciting about persistent memory support on VMware and even more importantly, how can it help you with your business operations? Well, let’s talk about the game-changing performance that persistent memory technology brings to your virtualized data center and how your business applications and VMs use this technology for faster business operations.
First, let’s start with some of the basics. Persistent memory is the convergence of memory and storage with technology that runs on the memory bus used for very fast storage operations. How fast? This technology taps into the low nanoseconds of latency on the memory bus which can be up to 1000x faster than devices on the PCIe bus. Latency – a measurement of response time – directly impacts a technology’s ability to deliver faster performance for your business applications running on your server technology. Technology such as NVDIMM-N, which is a non-volatile DIMM combining DRAM, flash and a backup power source, allows you to address smaller storage bottlenecks in your data center that measure into the low 100s of GBs. For larger capacity needs, there’s HPE Scalable Persistent Memory which combines terabyte-scale DRAM performance combined with flash and backup power to address larger needs for things such as larger database files, faster analytics and of course faster deployment of VMs using operations such as vMotion. We have even larger capacity persistent memory on the horizon to address even larger storage bottlenecks in the future.
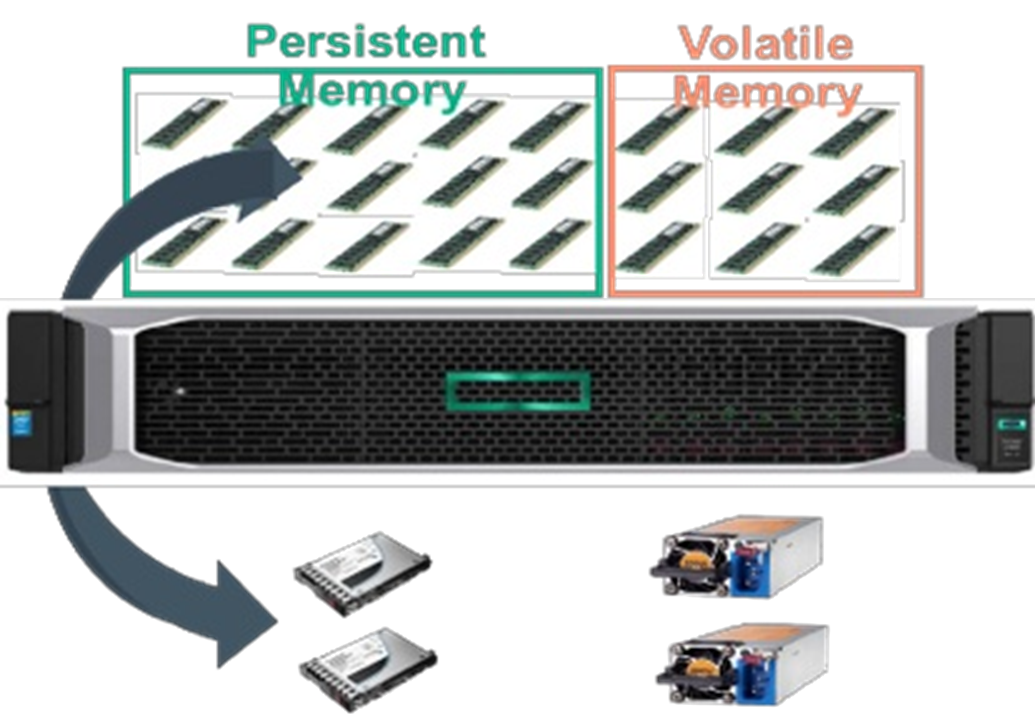
HPE Scalable Persistent Memory HPE NVDIMMs
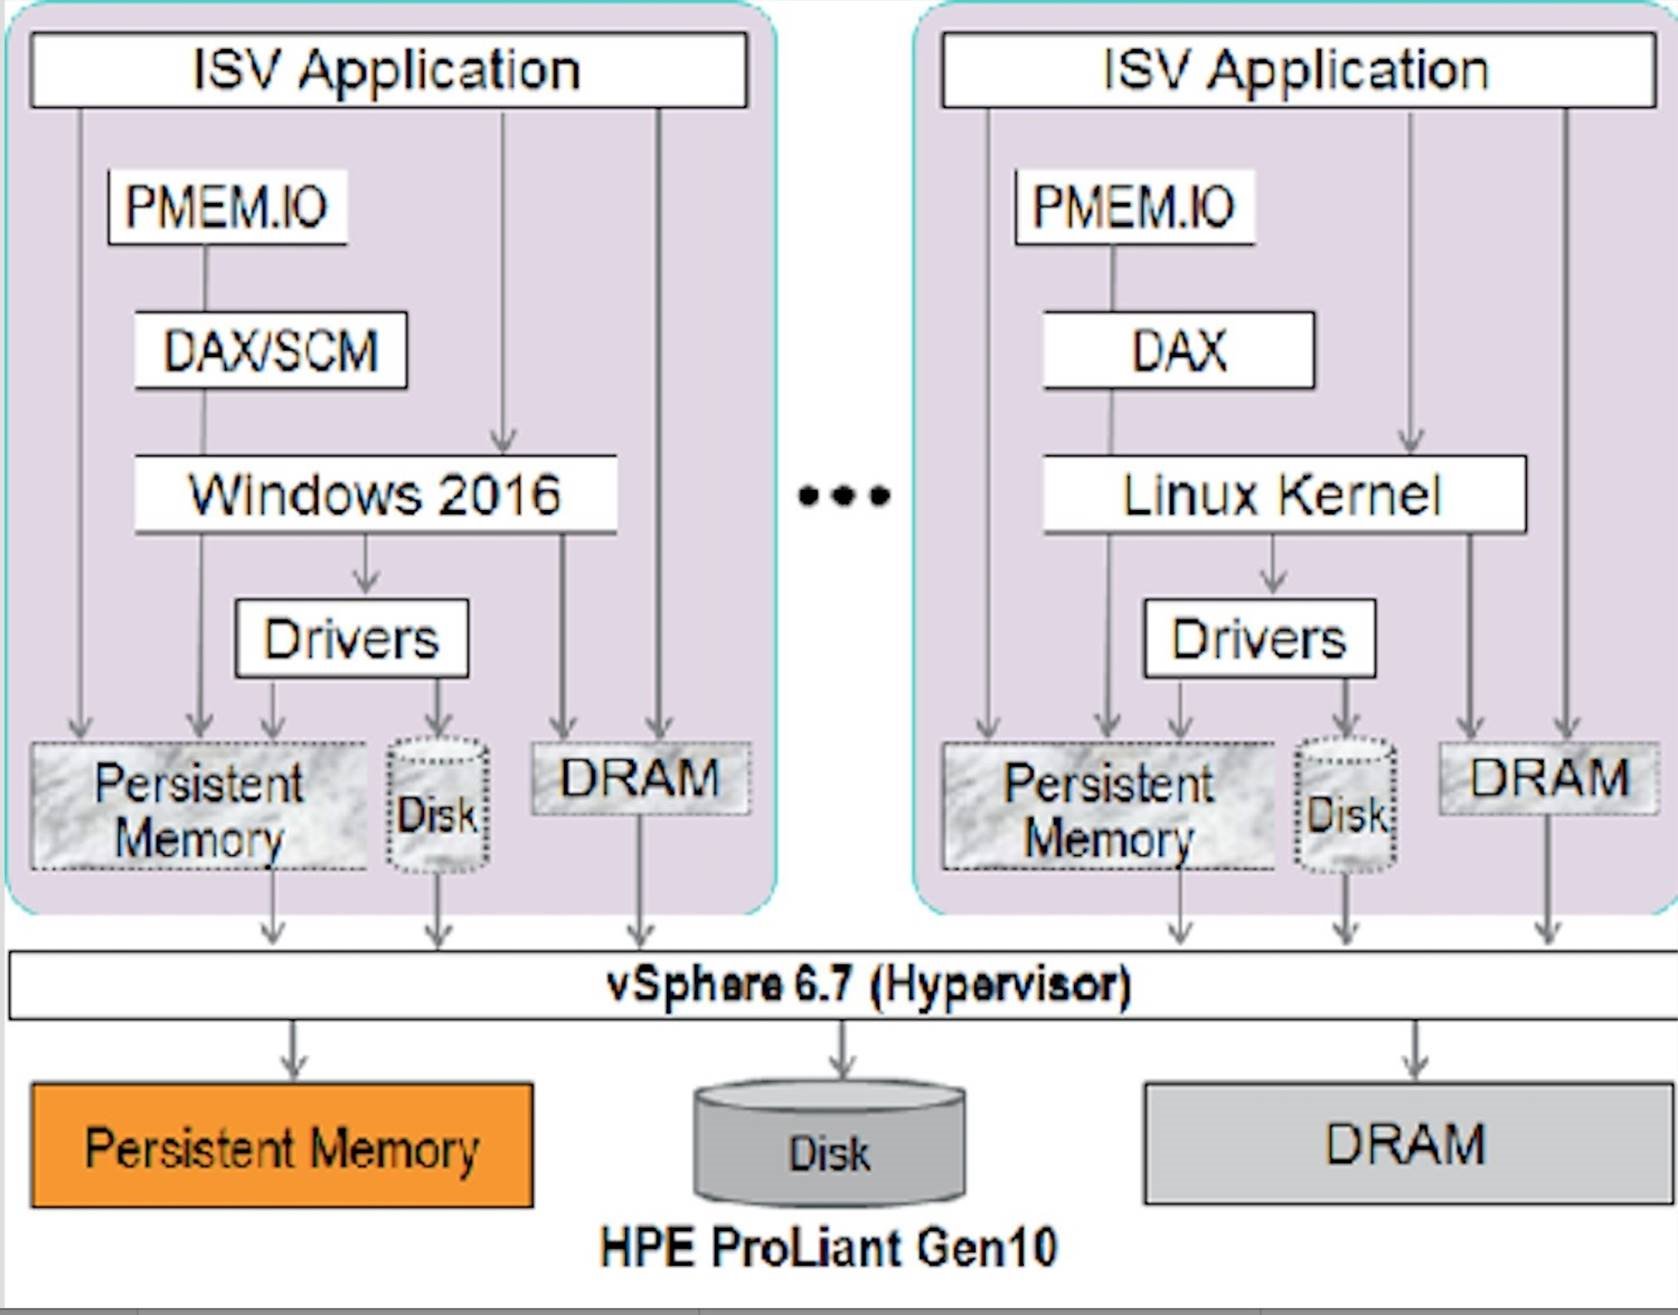
The software ecosystem is equally as important as the hardware when it comes to bringing new levels of performance to your business applications. HPE and VMware have partnered together over the last few years to fine tune the deployment of this technology to the virtualized data center. vSphere 6.7 presents the Persistent Memory through the hypervisor seamlessly with little overhead and presents virtualized persistent memory to be used by your VMs resulting in faster application performance. In the diagram below, we see how two different virtual machines running different OS can leverage persistent memory without any changes made to the OS or the application.
HPE and VMware are working together on software application demos to show how VMware virtualized data centers running on HPE technology tap into the same levels of performance as bare metal deployments. In particular, databases, analytics and virtualized data center functions such as vMotion can realize great performance benefits from this technology. Take a sneak preview of one of the newest demos we developed to highlight the tremendous benefits of this technology on a virtualized Oracle database with vSphere 6.7, delivering 2.3M IOPS, 30GB of bandwidth and virtually no latency. Yes, that’s right. No latency! Check out the demo.
Additionally, HPE and VMware have worked closely together on several other demos listed here:
![]() SQL Tail of the Log running on vSphere that shows up to 3x higher performance with 1/3 the latency and up to 8x higher performance in sequential concurrent writes compared to SSDs and NVMe SSD respectively:
SQL Tail of the Log running on vSphere that shows up to 3x higher performance with 1/3 the latency and up to 8x higher performance in sequential concurrent writes compared to SSDs and NVMe SSD respectively:
https://blogs.vmware.com/tap/files/2018/05/SQLToLVMwareDe mo.mp4
We will showcase additional new demos that we are working on together around HPE Discover Las Vegas June 2018 timeframe! Stay tuned!
HPE and VMware will continue to work together to guide you on how to deploy and take advantage of new innovations like persistent memory technology in your virtualized data center. Innovation is in our DNA and we are always looking for ways to improve our offerings to help you with your business operations. Come see us at HPE Discover Las Vegas from June 19-21 at the
Sands Convention Center and hear directly from the experts on HPE Persistent Memory technology and VMware vSphere. HPE is the #1 global leader in server virtualization solutions based on VMware technology and we will continue to work together to bring meaningful innovation to your virtualized data center.”
Thanks Bret for the post! Refer to the VMware and HPE Alliances page for more details on all our joint solutions. Follow me @bhumikp
Article: https://blogs.vmware.com/tap/2018/05/14/hpe-persistent-memoryvmware-vsp…
Date: 2019-05-21