
A Closer Look at the VM DRS Score
Overview
With vSphere 7, we released the greatly improved Distributed Resource Scheduler (DRS) logic. This article explains more details about the new DRS algorithm, with a focus on the VM DRS Score construct.
DRS works to ensure that all workloads in a cluster are happy. ‘Happy’ meaning workloads can consume the resources that they are entitled to. This depends on a lot of factors like cluster sizing, ESXi host utilization, workload characteristics, and the virtual machine (VM) configuration with a focus on compute (vCPU/Memory) and network resources. DRS achieves VM happiness by calculating and executing intelligent workload placements and workload balancing across a cluster.
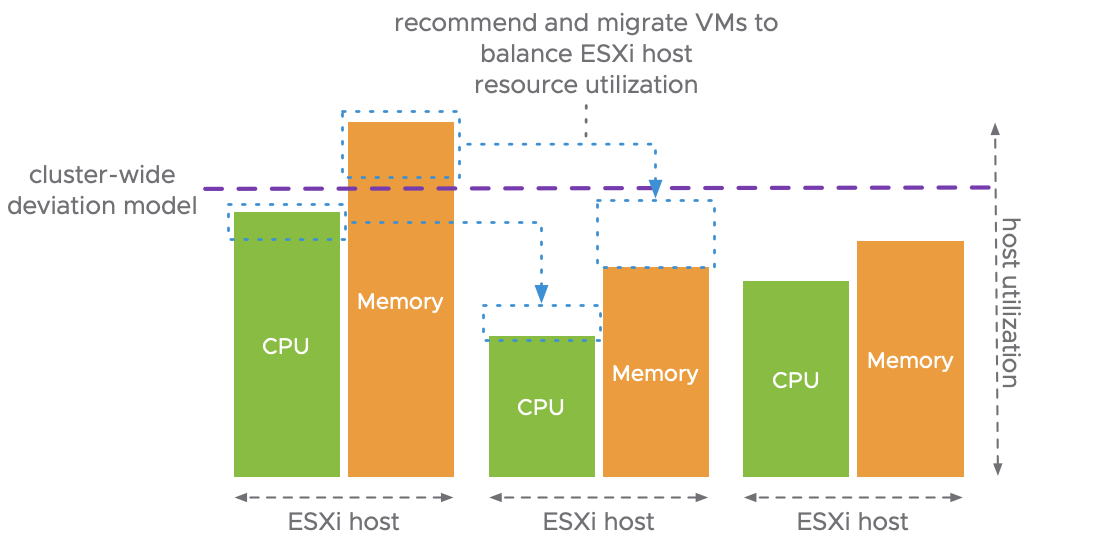
In previous vSphere releases, DRS used a cluster-wide standard deviation model measurement to optimize workload ‘happiness’ as shown in the diagram above. In essence this means DRS had a focus on the ESXi host utilization baseline, a specific threshold range that is configurable using the DRS migration threshold. The re-vamped DRS logic takes a very different approach from its predecessor. It optimizes VM happiness by measuring VM happiness!
VM DRS Score
In vSphere 7, DRS measures VM happiness by computing a VM DRS Score per VM. The VM DRS Score for any given VM/workload is calculated every minute, on all the ESXi hosts in the cluster. The reduced time in between DRS calculations alone (1 minute versus 5 minutes in previous vSphere releases) provides a far more granular approach for balancing workloads. When another ESXi host is able to provide a better score for the VM, DRS will recommend and possible execute a live-migration, depending on DRS settings. If DRS operates in fully automated mode, DRS is allowed to initiate a vMotion to live-migrate the workload. When DRS is configured to run manually or partially automated, manual operations are required to run DRS or to apply the DRS recommendations.
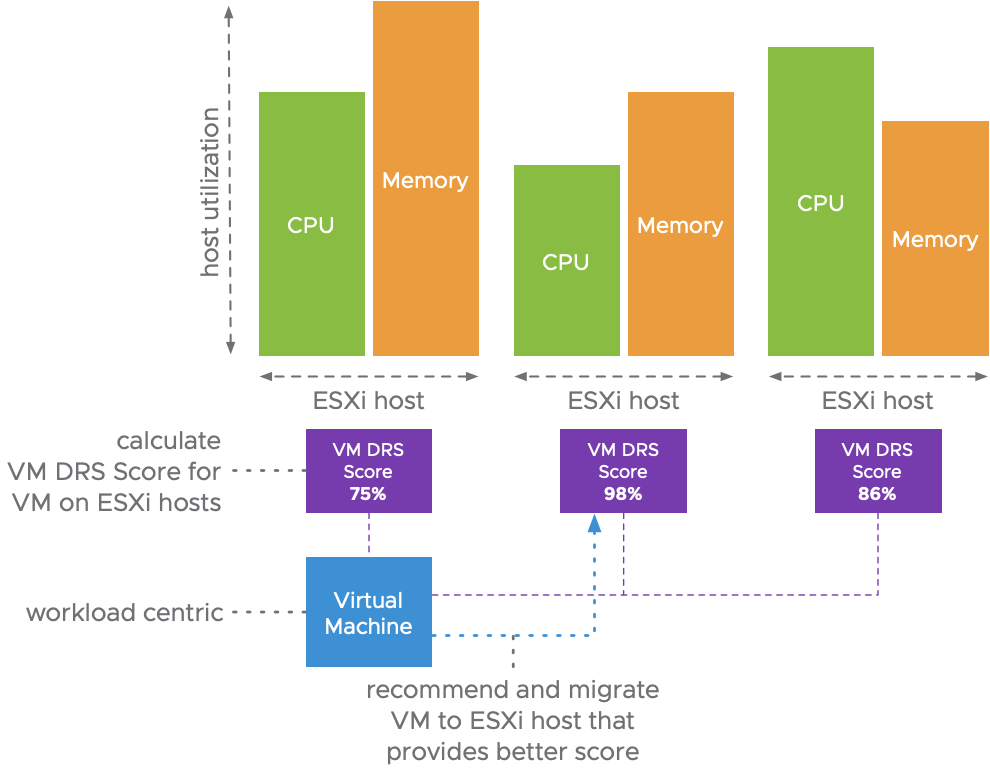
The VM DRS score is calculated based on the goodness model of DRS in vSphere 7. The goodness modelling enables DRS to compute the goodness (happiness) of a VM on any given host in the cluster. Looking closer into the VM DRS Score, it is simply the goodness of the VM on its current host expressed as a percentage. To understand how DRS calculates the VM DRS Score, we need to understand the goodness modelling in vSphere 7.
Goodness Modelling
The fundamental concept of the new DRS logic is that VMs have an ideal throughput and an actual throughput for each resource (CPU, memory, and network). When there is no contention, the ideal throughput of that VM is equal to the actual throughput. We talk about resource contention if multiple VMs are in conflict over access to a shared compute or network resource. In the situation when there is contention for a resource, there is a cost for that resource that hurts the actual VM throughput. Based on these statements, here are some equations:
Goodness (actual throughput) = Demand (ideal throughput) – Cost (loss of throughput)
Efficiency = Goodness (actual throughput) / Demand (ideal throughput)
Total efficiency = EfficiencyCPU * EfficiencyMemory * EfficiencyNetwork
Total efficiency on host = VM DRS score
This means that the VM DRS Score is a combination of the efficiencies of each resource. To determine the efficiency of a resource, all we need to calculate is the resource cost. There are several factors that contribute to the cost. These costs are described below for each resource.
CPU Costs
All costs are charged to the VM. The costs for CPU resources include:
- CPU cache cost – We monitor co-scheduling of VMs because that could possible incur CPU cache contention.
- CPU ready cost – If a VM’s CPU demand cannot be satisfied on the host because the host is overcommitted, the VM potentially run with a higher CPU Ready time (%RDY).
- CPU tax cost – If a VM causes overcommitment of a host’s CPU. For example, the host would not be overcommitted if the VM did not exist on that host, it has an impact on the cost.
The total CPU cost is the sum of the above costs.
Memory Costs
The memory costs include:
- Memory burstiness cost – If there is insufficient memory headroom on a host to accommodate a burst in memory demand, we charge a cost to the VMs running on the host. The cost increases as the headroom decreases.
- Memory reclamation cost – If a VM’s memory demand cannot be satisfied on the host because the host is overcommitted, the VM will be swapping pages to disk. DRS charges this as a cost to the VM.
- Memory tax cost – If a VM causes overcommitment of a host’s memory (ie, the host would not be overcommitted if the VM did not exist on that host), we charge a cost to it.
The total memory cost is the sum of the above costs.
Networking Cost
- Network utilization cost – If a VM has a high networking bandwidth demand, and the host’s network usage is beyond a threshold, we charge a cost to the VM. The cost increases linearly with the increase in host network utilization.
Migration Cost
When DRS determines that another host can provide a better VM DRS Score, the last step before recommending and executing a live-migration, is checking the migration cost for the VM. The overall predicted vMotion time is factored in into the gain of the VM DRS Score. The longer the overall vMotion time, the shorter the potential gain (benefit) on the VM DRS Score will last. This will possible have an impact on DRS recommending a migration for the VM.
To verify the cost benefit of a balancing operation by live-migration the VM to another host, DRS computes the migration cost as the amount of CPU cycles it takes to perform the live-migration. The more memory that has to be copied as part of the vMotion process, the more CPU cycles are spent on trace fires and putting the data on the (network) wire.
This can lead to a situation that another ESXi host is capable of providing a better VM DRS Score, but that the benefits are negated because of a potential high migration cost. Resulting in DRS not recommending a live-migration for this VM.
Insights on Metrics
Now that we have a cost for the CPU, memory, and network resources, we can use the equations listed in goodness modelling to compute the VM DRS Score. Based on the outcome of the VM DRS Score calculations, DRS makes a placement decision. Both for initial placement and load balancing, making sure the most optimal ESXi host is chosen for the workload.
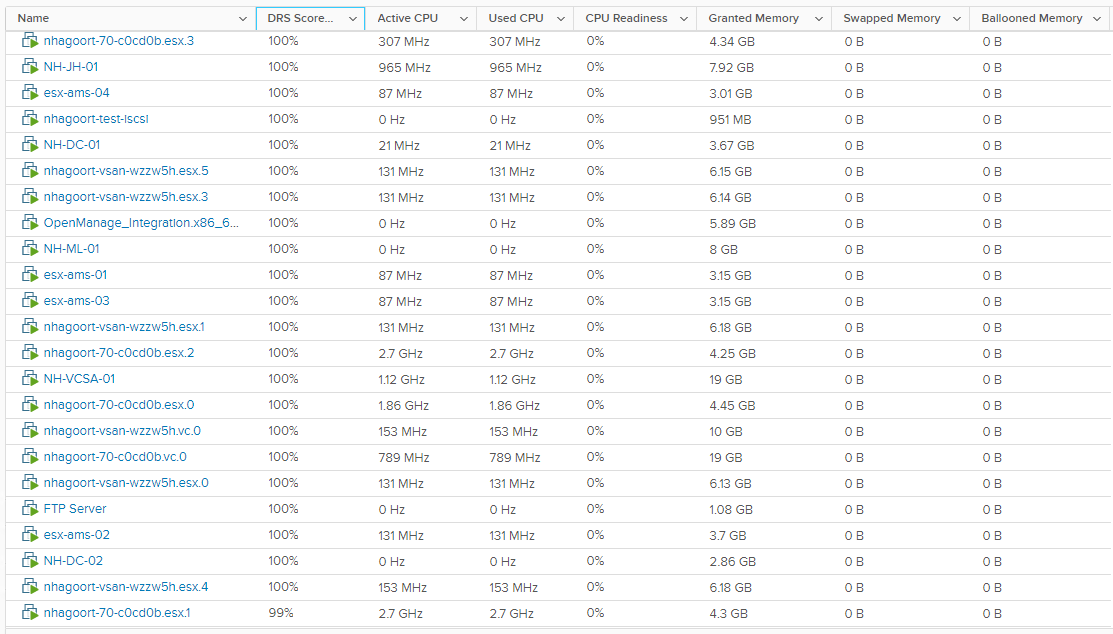
It’s great to see an environment with all DRS Scores in the upper bucker (80% – 100%). However, a VM running a lower score is not necessarily not running properly. It is about the execution efficiency, taking all the metrics/costs into consideration. A lot of the metrics used for the VM DRS Score calculation can be reviewed directly in the vSphere Client. Either clicking on ‘View all VMs’ in the Cluster Summary page and DRS pane or by viewing the VM DRS Score page in Cluster > Monitor. This overview provides a lot of detail. When a VM is running in a lower score bucket, these metrics provide a quick look into what is happening.
To Conclude
When you upgrade to, or install vSphere 7 in your infrastructure, you’ll immediately benefit from the new and improved DRS logic! Even though we took a closer look at the new VM DRS Score construct, the beauty of DRS, is that it requires little to none knowhow for customers to benefit from its capabilities. The out-of-the-box experience by just enabling DRS on your clusters already provides the ability for your workloads to run as optimal as possible, resulting in increased workload performance!