Degraded Device Handling
DDH - A history and why the feature is needed
A history
Part of what makes storage “hard” to do right is that many failures are not absolute. In many cases a device may become highly unresponsive or perform extraordinarily poorly but still not completely “fail”. As vSAN has matured as a product we have introduced increasingly more intelligent functionality under the hood to identify these partial failures that are often symptomatic of a device that will fail soon, as well as proactive remediation.
In vSAN 6.1 we introduced Dying Disk Handling to identify and remediate pro-actively disks that we detected high latency from. The challenge with this, is while latency was indicative of a failing drive, it also could be seen for bursts caused by garbage collection or the less than consistent write latencies of capacity optimized SSDs. One side effect is slower non-certified drives often used for home labs would proactively be unmounted for inconsistent performance.
In vSAN 6.2 this feature evolved to incorporate less aggressive behavior, avoiding from un-mounting cache devices, as well as being extended to try to detect issues and isolate issues with an unstable raid or HBA controller and even assist with the remitting of devices impacted by a controller. In addition non-rigid time frames for polling of drives was established to restrict workload based bursts from falsely being identified as a “bad drive”.
DDHv2 - What's new
Degraded Device Handling Version 2
In vSAN 6.6 significant changes have come to this process. First off we are again tweaking our process even further to avoid unnecessarily flagging devices that are not on a path to failing. Our engineering team has been working and testing further improvements to eliminate bias that would lead to polling hotspots. We will no longer “unmount” a device that is failing, but instead flag the device and identify the least impactful way to both restore policy compliance, and not impact the virtual machine’s IO path. The repair operation will manifest itself within the UI and logs and progress through a possible four different status states.
Disk dying, Evacuation complete - This is the final status when the disk has been evacuated. At this point the drive can be decommissioned by any mode, and then further diagnostics or replacement can proceed.

Error cases: There are two possible error states that could happen in this process.
Disk dying, preventative evacuation incomplete due to lack of resources - This will raise a Red Alarm within the web UI to note that more capacity needs to be made available to the vSAN datastore. The disk status will show “DyingDiskEvacuationPartial”
Disk dying, preventative evacuation incomplete due to inaccessible objects - This will raise a Red Alarm with the web UI. The disk status will show “DyingDiskEvacuationStuck”. This will happen if the object is no longer available. Either restore access to devices that can make this object available again for resync, or manually decommission the disk with the “no action” command if you do not need to restore this object.
Log Events and SMART information
There are a few interesting log events worth examining. For finding specific incidents within the syslog feed search for the following: “CMMDS_HEALTH_FLAG_DYING_DISK”
At the point of a device failing a health check the following six SMART attributes are polled and placed into the syslog feed for the impacted device (Presuming device is in pass through mode and SMART is accessible).
Re-allocated sector count.
Un-correctable errors count.
Command timeouts count.
Re-allocated sector event count.
Pending re-allocated sector count.
Un-correctable sector count.
The specific latency thresholds for devices in vSAN 6.6 are:
- 2 seconds for HDD read and write latency
- 50 msecs for flash device read latency
- 200 msecs for flash device write latency
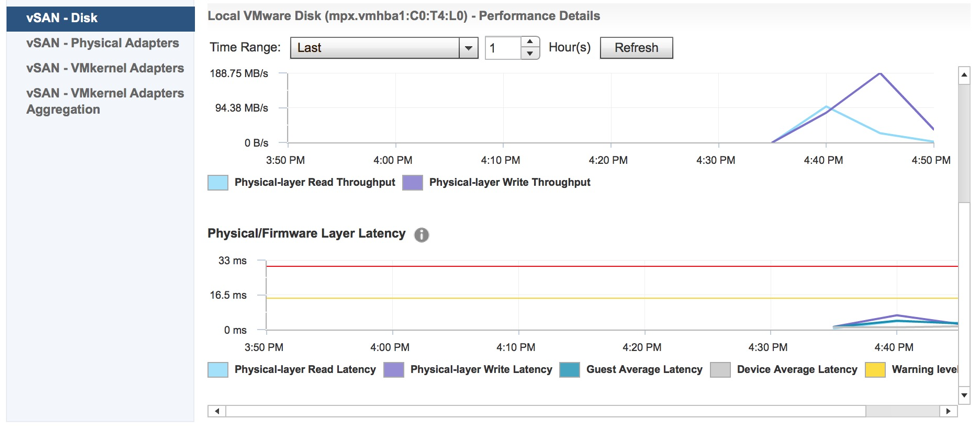
Note this is a device latency (and not abstracted or polled at a higher level like the virtual machine) so the impact of network or basic load should not be causing devices to show this high of device latency. If you wish to look at these latency metrics you can find them within the vSAN performance UI. Simply browse to the host, and look at individual disk latency as seen below.

Disabling DDHv2
In order to disable this functionality, the following command can still be run.
# esxcli system settings advanced set -o /LSOM/lsomSlowDeviceUnmount -i 0 <— default is “1″
