
DRS Improvements in vSphere 7
Introduction
The first release of Distributed Resource Scheduling (DRS) dates back to 2006. Since then, data centers and workloads have changed significantly. The new vSphere 7 release is shipped with DRS enhancements to better support modern workloads by using an improved DRS logic and new accompanying UI in the vSphere Client.
The enhanced DRS logic is now workload-centric rather than cluster-centric, as it was before with DRS. The DRS logic is completely rewritten to have a more fine-grained level of resource scheduling with the main focus on workloads. This blog post goes into detail on the new DRS algorithm, and explains how to interpret the metrics as seen in the new UI.
The Old DRS
vSphere DRS used to focus on the cluster state, checking if it needs rebalancing because it could happen that one ESXi host is over-consumed while another ESXi host has less resources consumed. DRS runs every 5 minutes, and if the DRS logic determined it could improve the cluster balance, it would recommend and execute a vMotion depending on the configured settings. That way, DRS used to achieve cluster balance by using a cluster-wide standard deviation model.
The New DRS
The new DRS logic in vSphere 7 takes a very different approach. It computes a VM DRS score on each host and moves the VM to the host that provides the highest VM DRS score.
The biggest change from the old DRS version is that it no longer balances host load directly. Instead, it improves the balancing by focusing on the metric that you care most about: the virtual machine happiness. Important to note is that the improved DRS now runs every minute, providing a more granular way to calculate workload placement and balancing. This results in overall better performance of the workloads.
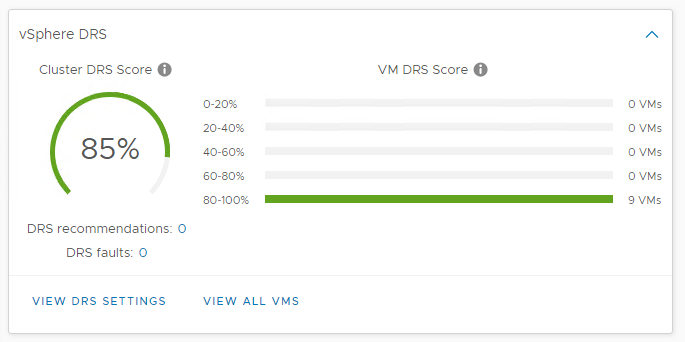
VM DRS Score
The new DRS logic quantifies virtual machine happiness by using the VM DRS score. First, let me emphasize that the VM DRS Score is not a health score for the virtual machine! It is about the execution efficiency of a virtual machine. The score values range from 0 to 100% and are divided into buckets; 0-20%, 20-40%, and so on.
Obtaining a VM DRS score of 80-100% indicates that there is mild to no resource contention. It does not necessarily mean that a virtual machine in the 80-100% bucket is doing way better than a virtual machine in the lower buckets. That is because there are many metrics that influence the VM DRS score. Not only performance metrics are used, but capacity metrics are also incorporated in the algorithm.
The performance drivers for the VM DRS score are contention based, using metrics like CPU %ready time, good CPU cache behavior, and memory swap. The reserve resource capacity, or headroom, that a current ESXi host has is also taken into account to determine the VM DRS score. Will the virtual machine be able to burst resource consumption on its current host and to what level? Are there other ESXi hosts in the cluster that have more headroom available? All these factors play an important role in the calculation of the VM DRS score.
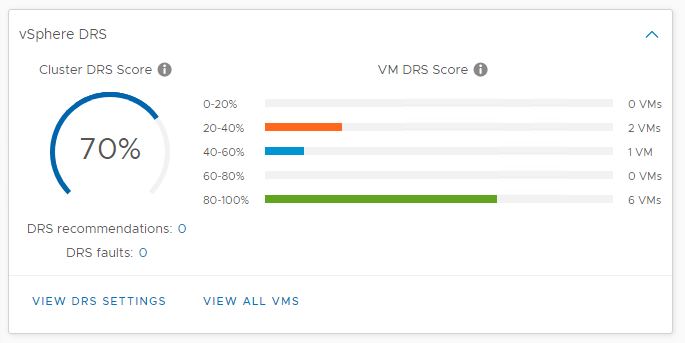
The improved DRS is no longer thinking about the relative load between ESXi hosts in a cluster, the main focus is on the happiness of the workloads. Next to VM DRS Score, DRS presents the Cluster DRS Score in the UI. It is calculated using an aggregation of all the happiness VM scores in the cluster. DRS will try to maximize the execution efficiency of each virtual machine in the cluster while ensuring fairness in resource allocation to all virtual machines.
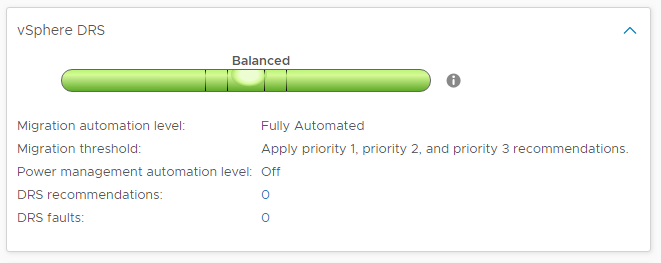
The vSphere cluster summary overview provides insights on what is happening from a DRS perspective. If you require more information on VM DRS Score, the new UI will provide that information to you.
View All VMs
When clicking on the ‘View all VMs’ option in the cluster summary DRS view, you will be presented an overview of all virtual machines in the cluster and more detailed information about their resource claim and entitlement.
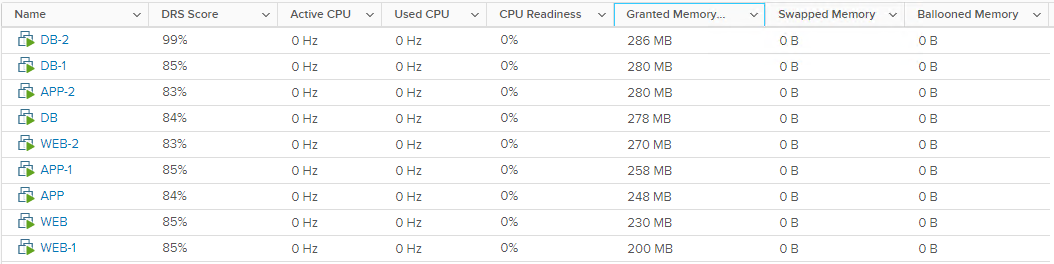
There might be situations where you will see a lot of CPU stress, which appear as high CPU ready times (%RDY) in the CPU Readiness column, or a large amount of swapped memory. Those are indicators that the workloads have possibly depleted the cluster compute resources.
You can use this information to move workloads to other clusters, or to scale out the cluster resources by adding additional ESXi hosts. The latter we can do automatically in VMware Cloud on AWS using Elastic DRS.
UI Walkthrough
When you click on the cluster “Summary” overview in vSphere 7, the new DRS UI is shown on the right. Expand the DRS view to get immediate insights. Check out this UI walkthrough to get an understanding of what it looks like:
To Conclude
DRS is providing a very fundamental and important functionality as part of our virtual infrastructures since its first release. These important enhancements in vSphere 7 mean that workloads will perform as close to optimal as possible, while ensuring that hardware is used very efficiently, and help vSphere Admins add GPUs and hardware accelerators to workloads.