
Getting started with vsantop
Introduction
VMware vSAN is the industry-leading enterprise-class hyperconverged storage platform. It’s natively built-in to VMware vSphere hypervisor and delivers high levels of performance and resiliency with a simple integrated architecture.
Performance metrics are key indicators that help in ensuring that workloads are running optimally. Performance charts in the vSphere Client are sufficient for the majority of monitoring and troubleshooting scenarios. However, there might be a few cases where advanced users and VMware Global Support Services staff need specific data points not available in the vSphere Client.
vSAN includes a CLI called vsantop that provides this data. vsantop is built with an awareness of vSAN architecture to retrieve focused metrics at a granular interval. This utility is focused on monitoring vSAN performance metrics at an individual host level. The purpose of this document is to provide an overview and understanding of vsantop.
Navigating vsantop
You can access vsantop by logging onto an ESXi host that is part of a vSAN cluster through a secure shell(ssh). Note that this requires SSH service to be enabled and respective ports allowed through the firewall.
Initiating vsantop
Prerequisites
- Ensure that you are running vSphere 6.7 Update 3
- Enable secure shell on the host by following these steps
Procedure
- Log in to the ESXi host via SSH with root user privileges.
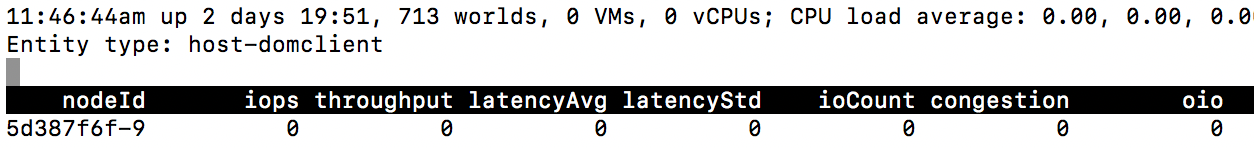
- Run the command vsantop on the ssh console.
- This displays the default view as depicted below:
Alternatively, you can choose to collect vsantop metrics in batch mode. This is particularly helpful in troubleshooting scenarios to replay data or to review with 3rd party utilities.
You can invoke batch mode using the following syntax:
Syntax : vsantop -b -d <delay> -n <iterations> > <filename and location>
Sample Command : vsantop -b -d 10 -n 6 > /vmfs/volumes/datastore-1/test/test.csv
This command executes vsantop in batch mode by capturing a snapshot of the metrics every 10 seconds(delay) for 6 iterations and stores it in the respective location. As a result, the output file has one minute of statistical data.
Navigating vsantop
vsantop reuses some of the internal libraries of esxtop to display the metrics. You can modify the default view by adding or removing relevant fields. Use the command h or ? to display the help menu as shown below:
|
Command |
Description |
|
^L |
Redraw screen |
|
Space |
Update display |
|
h or ? |
Help; show this text |
|
q |
Quit |
|
f/F |
Add or remove fields |
|
o/O |
Change the order of displayed fields |
|
s |
Set the delay in seconds between updates |
|
# |
Set the number of instances to display |
|
E |
Change the selected entity type |
|
L |
Change the length of the field |
|
l |
Limit display to specific node id |
|
. |
Sort by column, same number twice to change sort order |
* Note: Each instance of vsantop can only retrieve the local host metrics.
Entity types
vSAN architecture comprises of multiple layers of software and hardware entities. An entity type can denote a host, drive or a software component and has a unique identifier. Each instance of vsantop can accommodate 1 entity type and up-to nine columns of associated metrics. This categorization helps understand utilization patterns and to correct or optimize the appropriate entity.
You can view or switch between entity types by using the command E and choosing any of the supported entities depicted below:
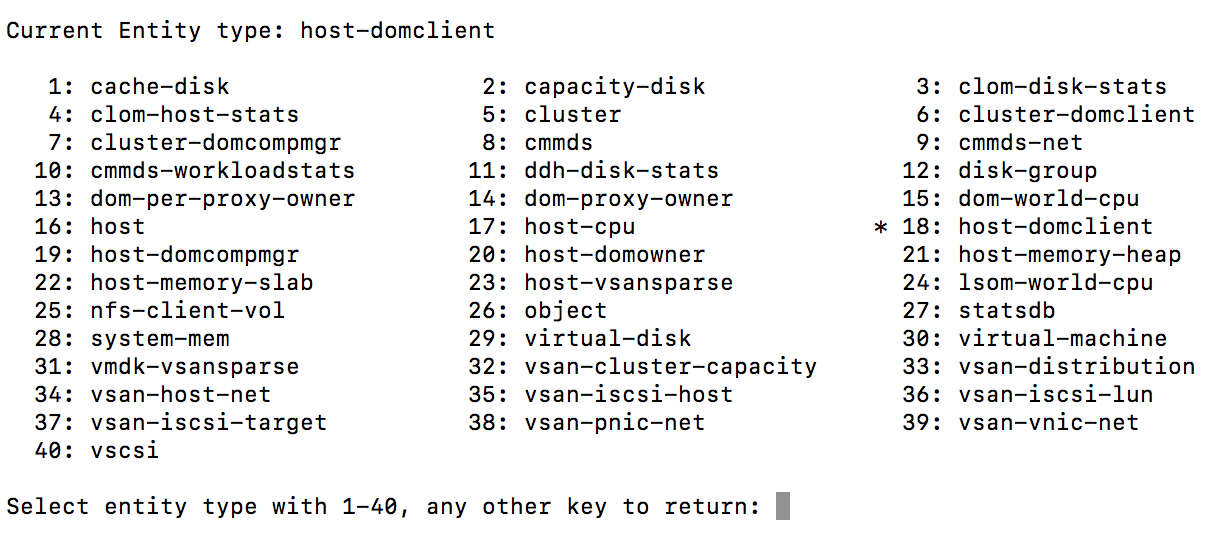
The default view begins with host-domclient and 40 entity types that are supported.
View and Order metrics
Each entity type can have up to nine metric fields that can be displayed at any instance. You can choose to add or remove the relevant metric fields by using the command f. This command displays a list of metrics associated with the entity.
vsantop also enables you to organize the display. You can reorder and sequence the metrics by using the command O. Select the uppercase or lowercase character to move the field up or down respectively.
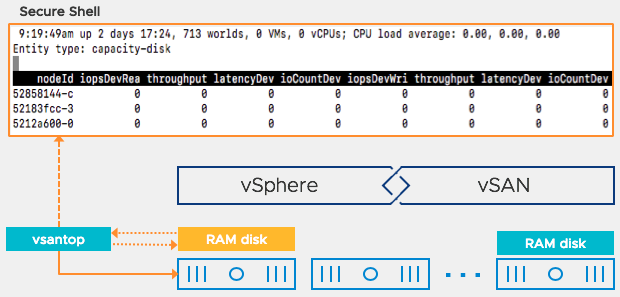
How does it work?
vsantop is embedded in the hypervisor. It collects and persists statistical data in a RAM disk. Based on the configured interval rate, the metrics are retrieved and displayed on the secure shell console. This interval is configurable and can be reduced or increased depending on the amount of detail required. The workflow is illustrated below for a better understanding.
Conclusion
The vsantop utility provides a simplified mechanism to retrieve performance metrics at an individual host level. The ability to view component level metrics provides insight into resource utilization. You can choose to view real-time metrics or collect statistical data for offline analysis. This is particularly useful to isolate a problem component in troubleshooting scenarios.
The introduction of vsantop utility has overall enhanced the managing and monitoring capabilities of vSAN.