
Holodeck: Working with Segments and Distributed Routing
Module 1: Segments and distributed routing
Software Defined Networking (SDN) in VMware Cloud Foundation is provided by VMware NSX. VMware NSX operates as an overlay network which allows for encapsulating L2 network traffic within a L3 underlay network. This allows networks and network services to be delivered programmatically in software.
NSX enables customers to create elastic logical networks that span physical network boundaries. NSX abstracts the physical network into a pool of capacity and separates the consumption of these services from the underlying physical infrastructure. This model is like the model vSphere uses to abstract compute capacity from the server hardware to create virtual pools of resources that can be consumed as a service.
Lab 1: Creating Network Segments
This lab deploys the necessary networking components to support a OpenCart two-tier application. OpenCart is an open-source eCommerce platform that uses an Apache Web Server front end, and a MySQL database backend. This lab uses preconfigured VMs that will be attached to newly created SDN segments. This lab simulates a common issue, where a legacy application with hard coded networking dependencies needs to be deployed in a new data center. Rather than attempting to recreate subnets, VLAN and firewall components in hardware, we will create all the necessary infrastructure in software, faster.
[Step 1] Logging in to the environment
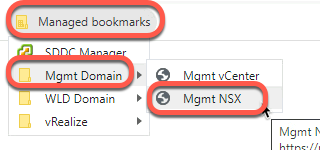
- On the Holo-Console, open a new tab in the Chrome browser
- Click the Managed bookmarks folder in the bookmark bar then select Mgmt Domain->Mgmt NSX
- At the certificate warning screen, click Advanced then Proceed to nsx-mgmt.vcf.sddc.lab (unsafe)
- Log into NSX Manager as the user admin with the password VMware123!VMware123!
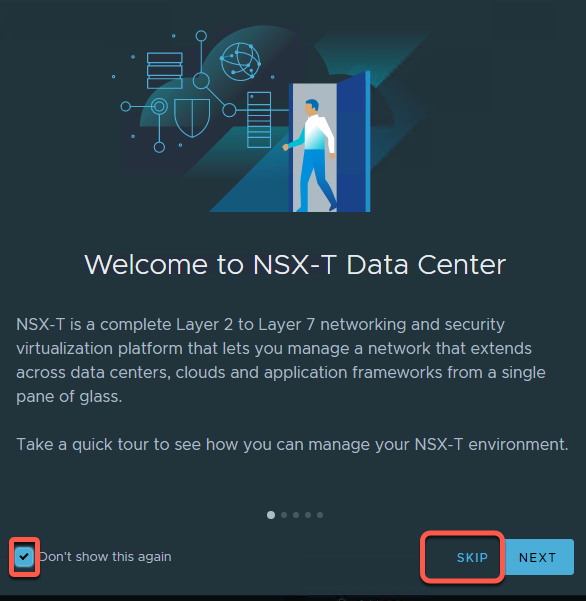
- If this is your first time loggin in, you will land on a Welcome screen. This can be revisited later.
- Click Don’t show this again followed by Skip
- This lab guide uses the NSX UI in light mode. Click the sunshine icon in the upper right corner of the UI to change to light mode. This can be changed back by clicking the half-moon icon in same location.

- Click the Networking tab
[Step 2] Create the OC-DB-Segment
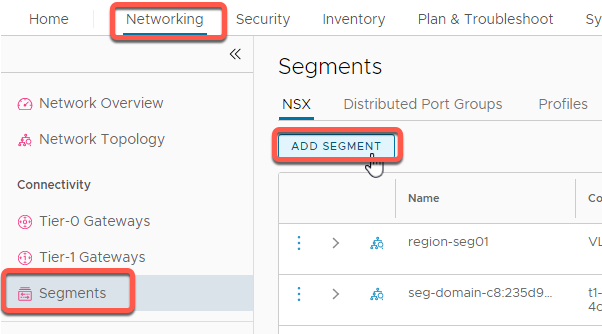
- Click the Networking tab at the top of the screen
- Click Segments in the left-hand side pane.
- Click ADD SEGMENT button
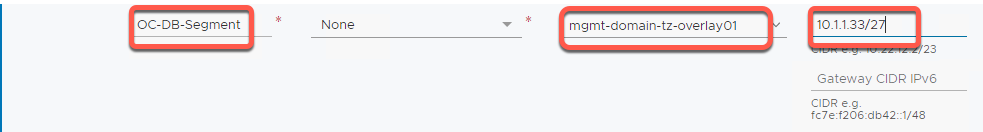
- In the Segment Name field, enter OC-DB-Segment
- In the Select Transport Zone dropdown, select mgmt-domain-tz-overlay01 | Overlay
- In the Gateway CIDR IPv4 field, enter 10.1.1.33/27 Note: This entry sets the subnet, CIDR and gateway at same time).
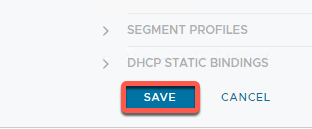
- Scroll down and click Save
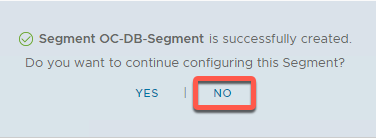
- A notice is displayed informing of the success of the segment creation. Click No to answer the Do you want to continue configuring this Segment dialog
[Step 3] Create the OC-Web-Segment
- Click the Networking tab at the top of the screen
- Click Segments in the left pane.
- Click ADD SEGMENT button
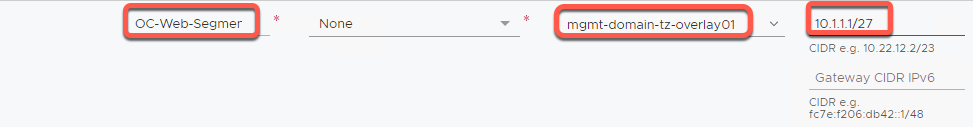
- In the Segment Name field, enter OC-Web-Segment
- In the Select Transport Zone dropdown, select mgmt-domain-tz-overlay01 | Overlay
- In the Gateway CIDR IPv4 field, enter 10.1.1.1/27
- Scroll down and click SAVE
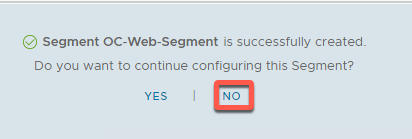
- A notice is displayed informing of the success of the segment creation. Click No to answer the Do you want to continue configuring this Segment dialog
[Step 4] Connect OpenCart web server VMs
The following steps attach two Apache web server VMs to the OC-Web-Segment.
- Using the Chrome bookmarks, access vCenter Server Web Client by navigating to Managed bookmarks->Mgmt Domain->Mgmt vCenter
- Launch the vSphere Client and login to the Mgmt vCenter using the username administrator@vsphere.local and the password of VMware123!
- Select the vCenter Server Hosts and Clusters view and expand out as shown
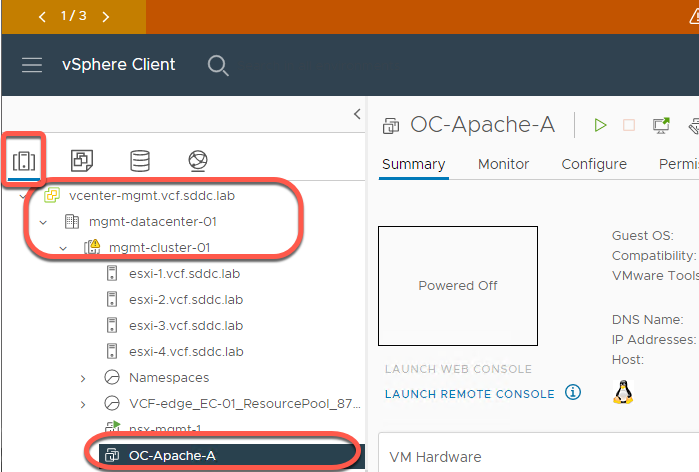
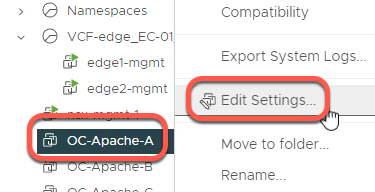
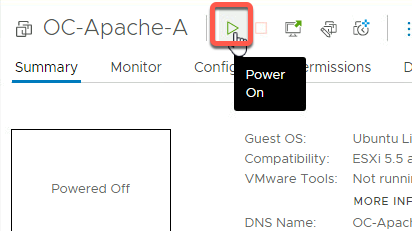
- Right click on OC-Apache-A and click Edit Settings
- Click the dropdown next to Network Adapter 1
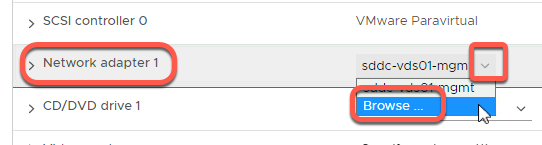
- Click Browse
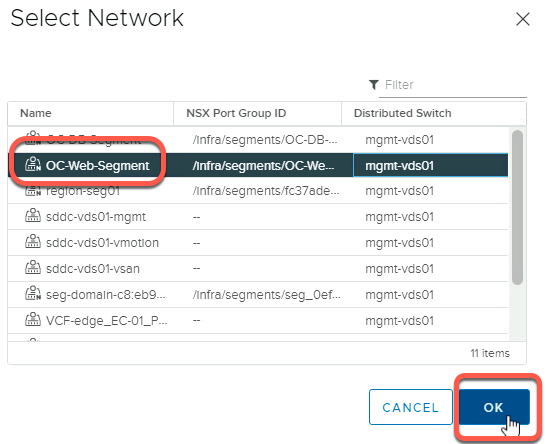
- Observe that the network segments created earlier are visible
- Click OC-Web-Segment
- Click OK
- Click OK
- Power on the OC-Apache-A VM
[Step 5] Attach OC-Apache-B to OC-Web-Segment
- Right click on OC-Apache-B and click Edit Settings
- Click the dropdown next to Network Adapter 1
- Click Browse
- Click OC-Web-Segment
- Click OK
- Click OK
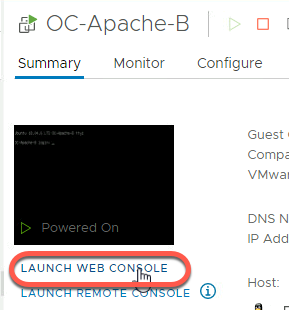
- Power on the OC-Apache-B VM
[Step 6] Test basic connectivity – OC-Apache-B
- The IP addresses for the two VMs on the segment to be tested are:
- OC-Apache-A – 10.1.1.18
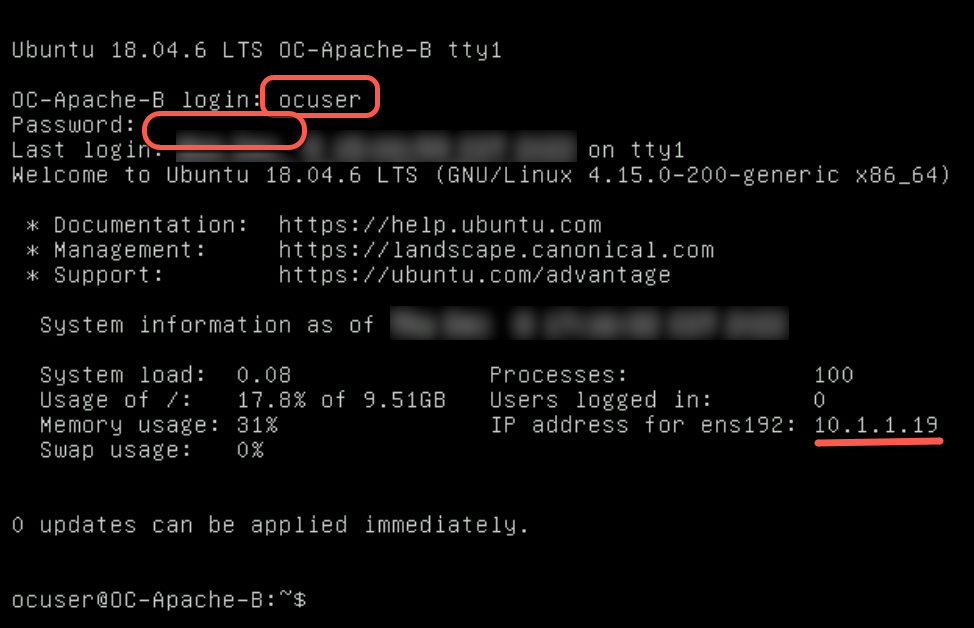
- OC-Apache-B – 10.1.1.19
- Launch the web console for OC-Apache-B. You may need to hit enter within the console window to get a login prompt
- Login with the username ocuser and the password of VMware123!
- Verify the IP Address configured is 10.1.1.19
- Enter the following command to verify network connectivity with 10.1.1.18 (OC-Apache-A)
ping 10.1.1.18
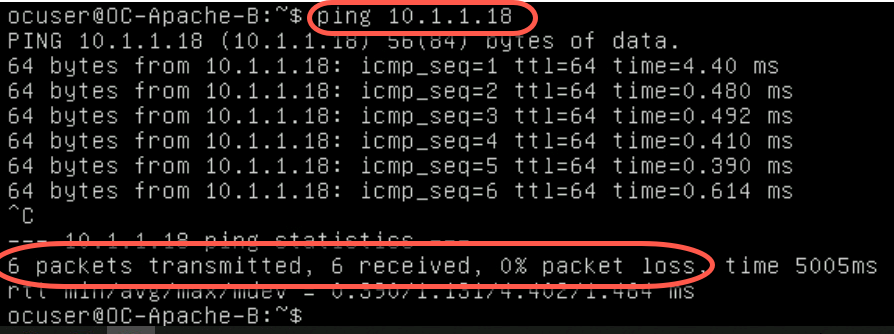
- Type Control-C to stop the ping command
- Verify no packet loss while pinging OC-Apache-A from OC-Apache-B.
This verifies network communication between both VMs over the recently added segment
[Step 7] View NSX OC-Web-Segment in vCenter Server
- Using the Chrome bookmarks, access the vCenter Server Web Client by navigating to Managed bookmarks->Mgmt Domain->Mgmt vCenter
- Launch the vSphere Client and login to the Mgmt vCenter using the username administrator@vsphere.local and the password of VMware123!
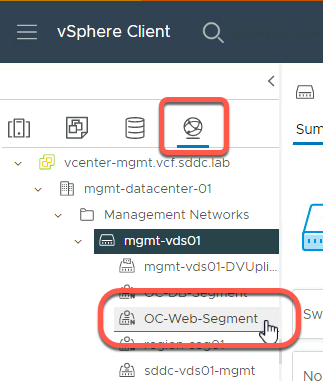
- Click on the networking icon and expand the menu on the left-hand side of the vSphere Web Client
- Click on OC-Web-Segment
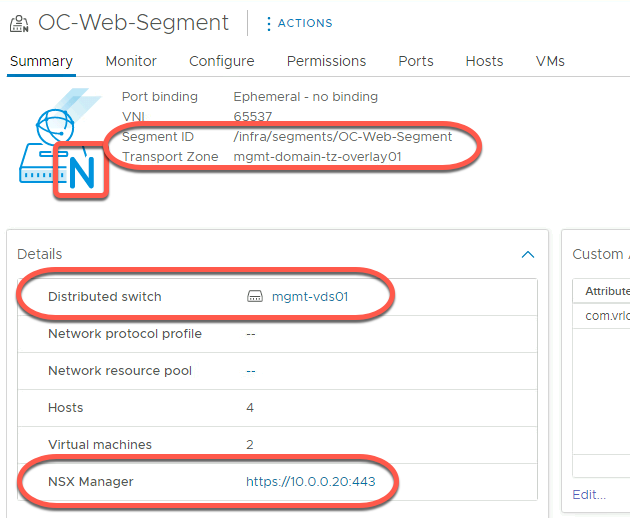
- Note the following:
- The “N” denotes this is a NSX segment and not a standard port group
- The segment ID and Transport Zone for the segment are shown
- The vDS the segment is attached to
- With vSphere 7 and NSX-T 3.1 and higher, NSX segments are an extension of the vDS and are visible to the vSphere administrator. NOTE: In previous release, NSX objects were “Opaque” and not visible to the vSphere administrator.
- The hyperlink for the NSX Manager for the segment
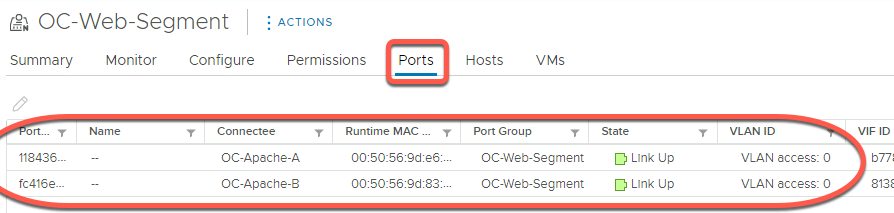
- Click on Ports
- Note each VM attached to the segment has a port assigned. Other details, such as the MAC address and VLAN ID, are also displayed
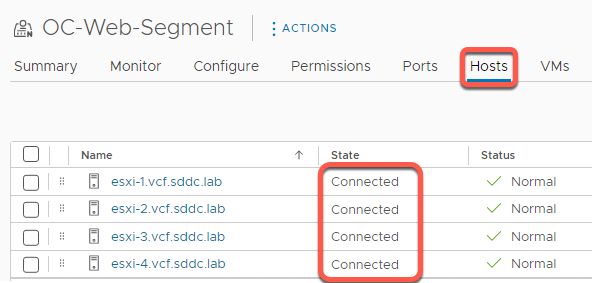
- Click on the Hosts tab
- Note the OC-Web-Segment is connected on each ESXi host in the transport zone. When a segment is created, it is accessible to all hosts in the transport zone.
[Step 8] Discover the Network Topology
- On the Holo-Console, open a new tab in the Chrome browser
- Click the Managed bookmarks folder in the bookmark bar then select Mgmt Domain->Mgmt NSX
- Log into NSX Manager as the user admin with the password VMware123!VMware123!
- Click the Networking tab
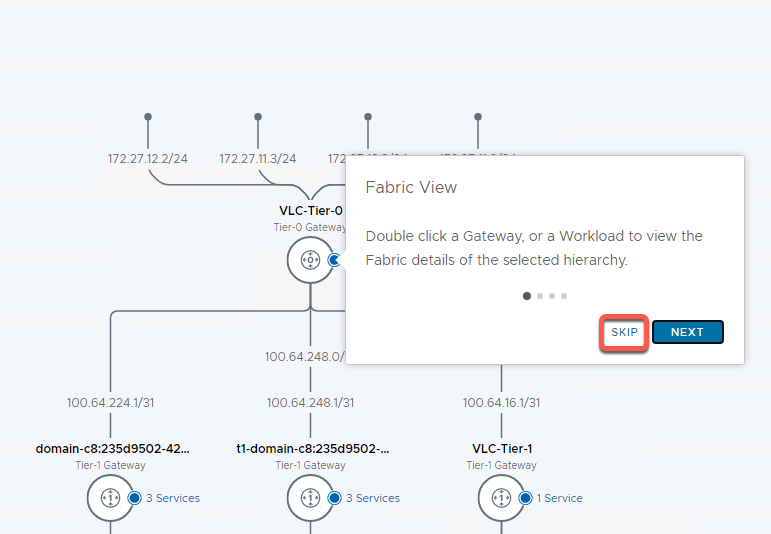
- Select Network Topology from the left-hand side menu
- Click Skip to close the mini-tour if needed.
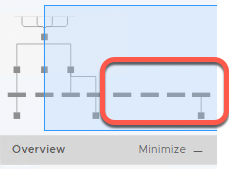
- Locate the new segments quickly by clicking on the Overview panel at the bottom of the screen in the area with a set of stand-alone boxes
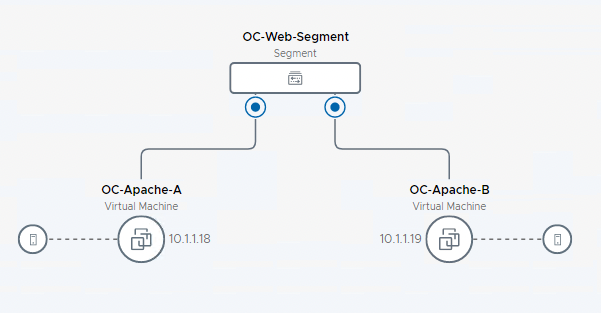
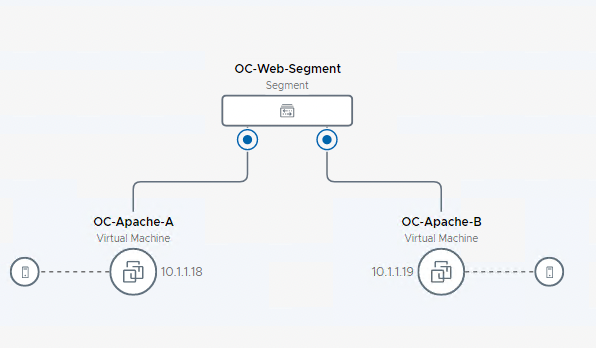
- Locate the OC-Web-Segment on the topology view.
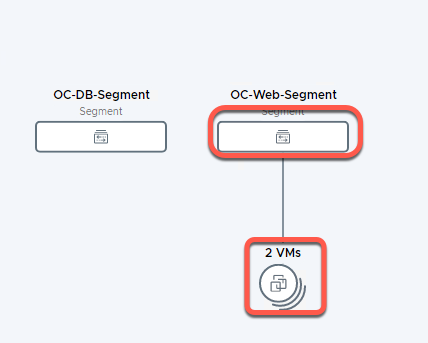
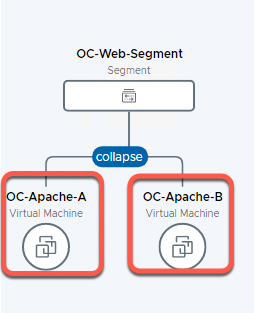
- Click on 2 VMs under OC-Web-Segment to expand the view
- Note the two VMs previously configured on the OC-Web-Segment
[Lab Summary]
This lab demonstrated how NSX can be utilized to quickly and securely provision L2 and L3 services on existing infrastructure. This enables:
- Easily delivering network services needed by an application with the application
- Eliminating delays with traditional network provisioning processes, which can take days to months.
- Empowering operations staff to deploy approved networks or retain control with the network admin team.
- Building a virtualized networking foundation that facilitates ease of workload migrations to other VMware Cloud properties for Disaster Recovery or Cloud Bursting activities.
This lab usually takes less than 15 minutes to complete. How does this compare to your experience in getting a single subnet provisioned for VM use?
Lab 2: View packet flow within a host
This lab demonstrates the use of a powerful diagnostic and visualization tool in NSX known as Traceflow to view traffic moving between virtual machines on the same host and same segment. Subsequent labs will examine traffic between VM’s running on different hosts on the same segment, and VM’s communicating between segments in same and different hosts.
Traceflow injects packets at the point the point where a VM connects to a vSphere distributed switch (VDS) port. It provides observation points along the packet’s path as it traverses physical and logical entities (such as ESXi hosts, logical switches, and logical routers) in the overlay and underlay network. This provides the ability to identify the path a packet takes to reach its destination or where a packet is dropped along the way. Each entity reports the packet handling on input and output, allowing for ease of troubleshooting.
Keep in mind that Traceflow is not the same as a ping request/response that goes from guest-VM stack to guest-VM stack. What Traceflow does is observe a marked packet as it traverses the overlay network. Each packet is monitored as it crosses the overlay network until it reaches and is deliverable to the destination guest VM. However, the injected Traceflow packet is never actually delivered to the destination guest VM. This means that a Traceflow can be successful even when the guest VM is powered down.
Note: Until the VM has been powered on after attaching it to an NSX segment, the NSX control plane initially does not know which host to use to inject packets from that VM as source. This results in a failure of the Traceflow test. After initial power-on of the VM on any host on the segment, NSX Manager keeps track of the location of the last run location for the VM.
[Step 1] Setup VMs for test
This step ensures the participant can observe packet flow between two VM’s on the same host by moving one VM as necessary to co-locate with the other. The subsequent lab will move the VM to show communications between hosts.
- Using the Chrome bookmarks, access vCenter Server Web Client by navigating to Managed bookmarks->Mgmt Domain->Mgmt vCenter
- Launch the vSphere Client and login to the Mgmt vCenter using the username administrator@vsphere.local and the password of VMware123!
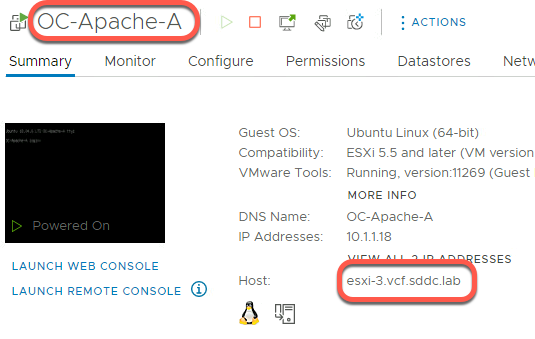
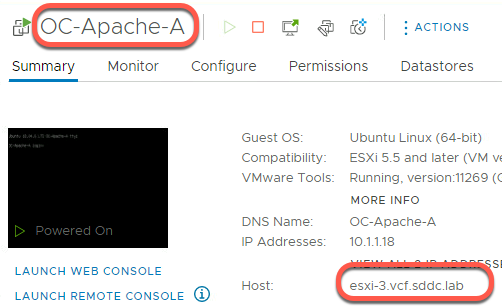
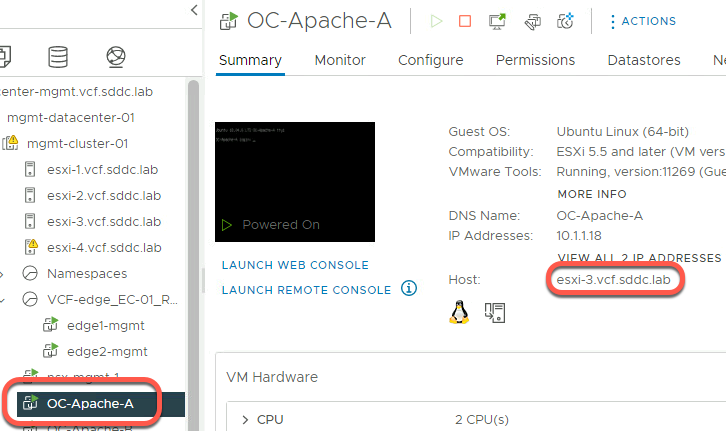
- From the Hosts and Clusters view click on OC-Apache-A to determine on which ESXi is the VM running
In this example, OC-Apache-A is running on host esxi-3.vcf.sddc.lab:
- Click on OC-Apache-B to determine on which ESXi is the VM running
- If the two VMs (OC-Apache-B and OC-Apache-A) are not on the same host, initiate a vMotion to move them to the same host.
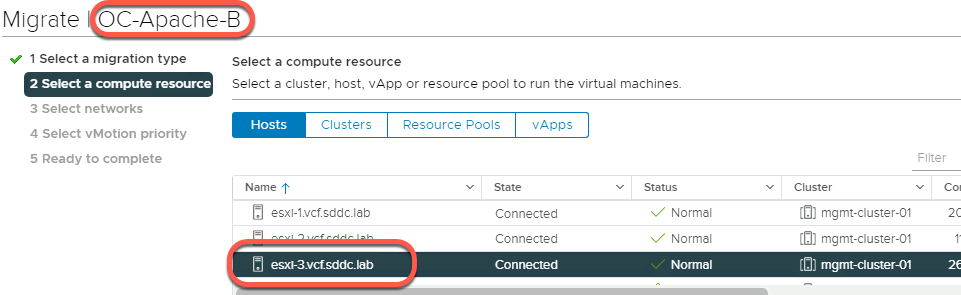
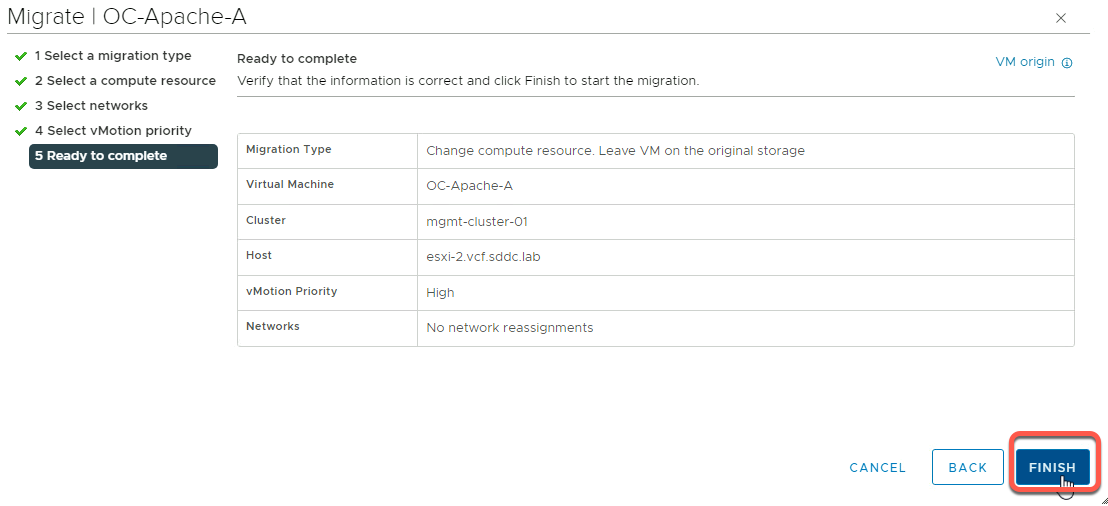
To perform the vMotion, right click on the VM and select Migrate.
Click Next to change the compute resource only
Select the ESXi host to migrate to, then click Next
Click Next to accept the default network selection
Click Next to accept the default vMotion priority
Click Finish to perform the migration
Below shows OC-Apache-B being migrated to esxi-3.vcf.sddc.lab that OC-Apache-A was shown to be on earlier
[Step 2] Test packet flow
- On the Holo-Console, open a new tab in the Chrome browser
- Click the Managed bookmarks folder in the bookmark bar then select Mgmt Domain->Mgmt NSX
- Log into NSX Manager as the user admin with the password VMware123!VMware123!
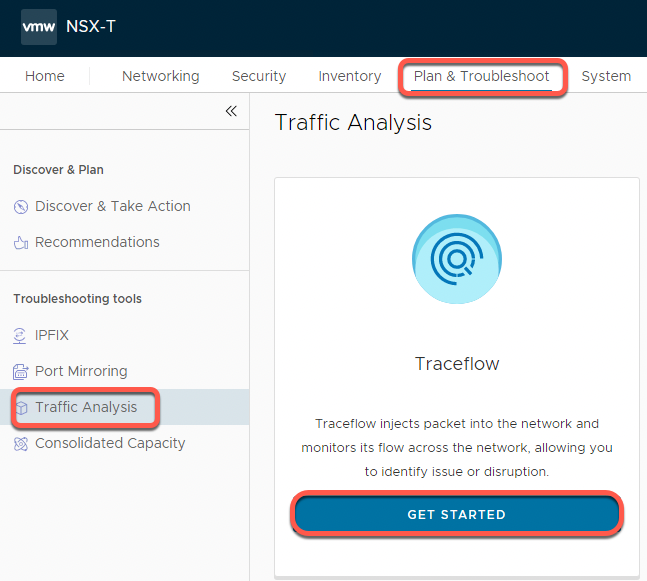
- Click Plan and Troubleshoot on the top menu bar
- Click on Traffic Analysis
- Click Get Started on the Traceflow box
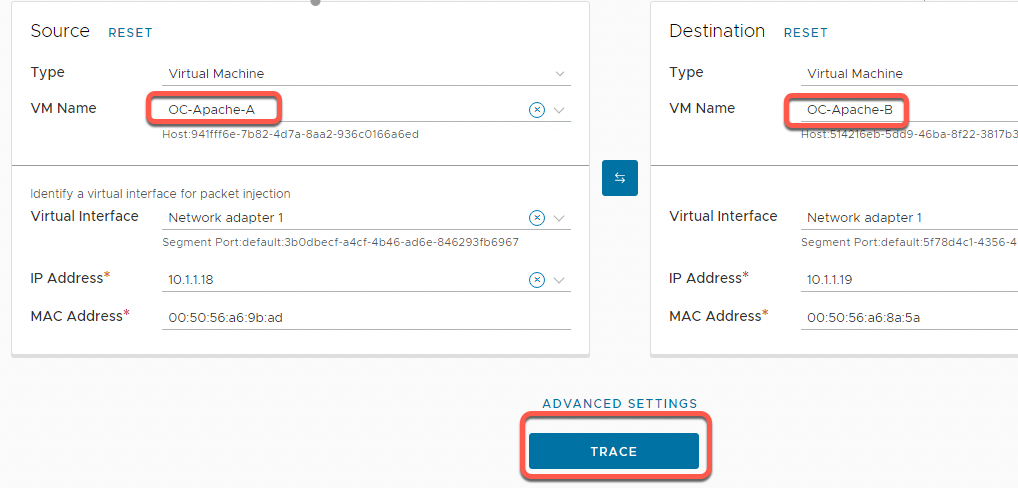
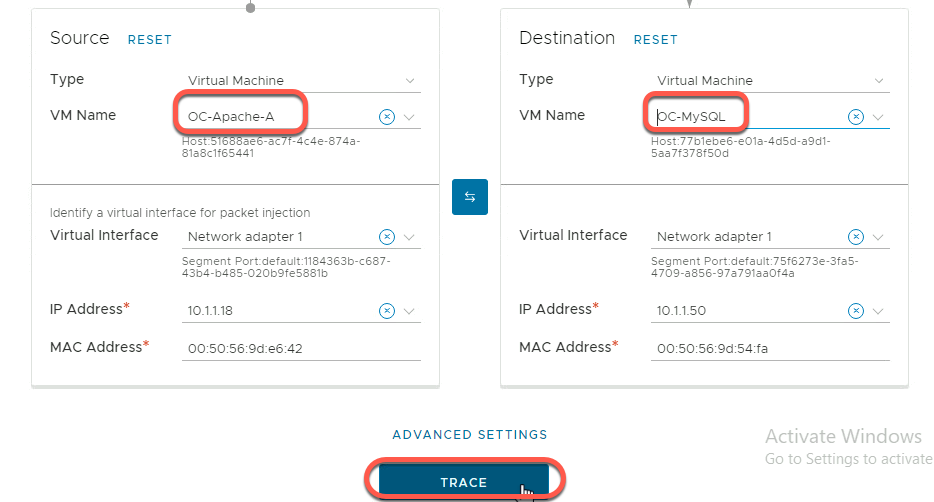
- Select the dropdown for the Source VM Name and select OC-Apache-A
- Select the dropdown for the Destination VM Name and select OC-Apache-B
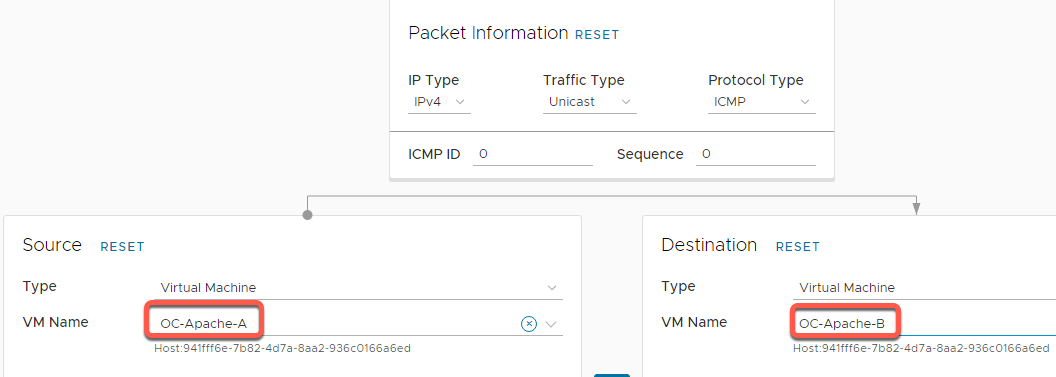
- Scroll down and click Trace
- The path the packets take are shown on the resulting topology view.
In this example, packets moved from OC-Apache-A to OC-Apache-B via the OC-Web-Segment
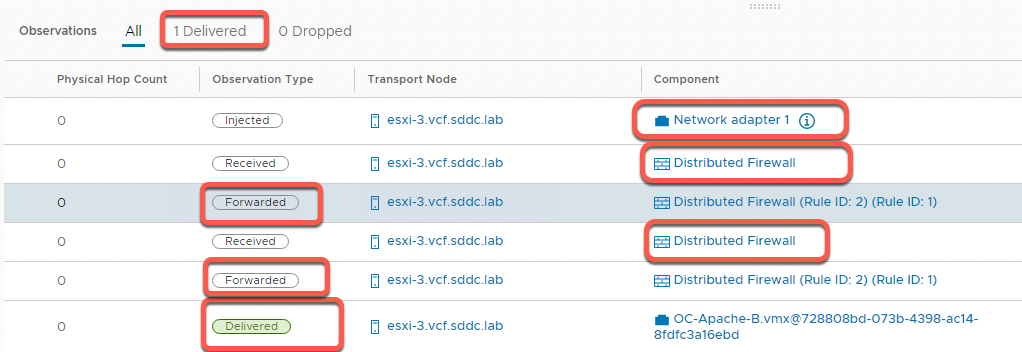
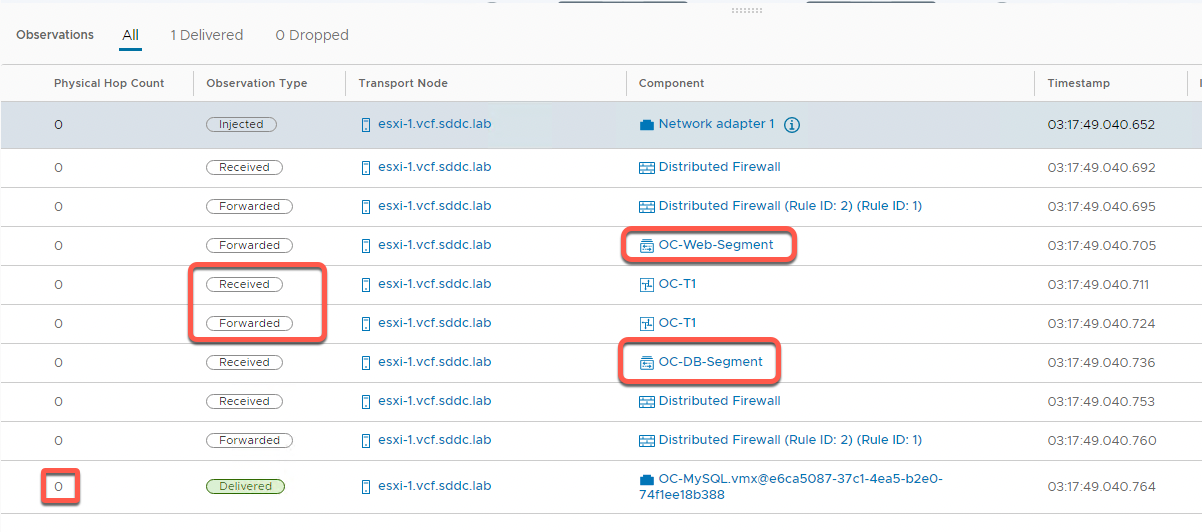
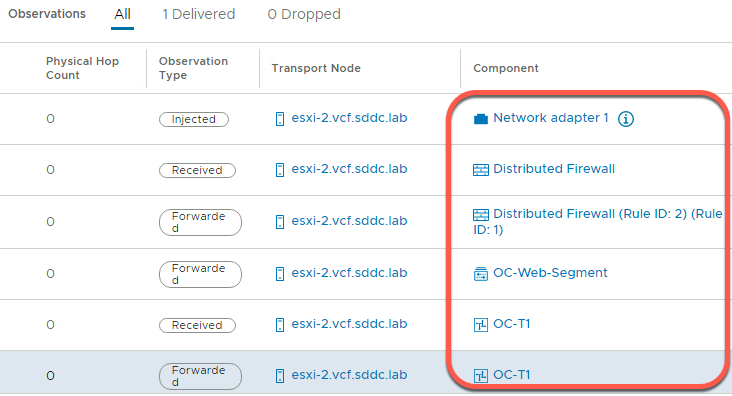
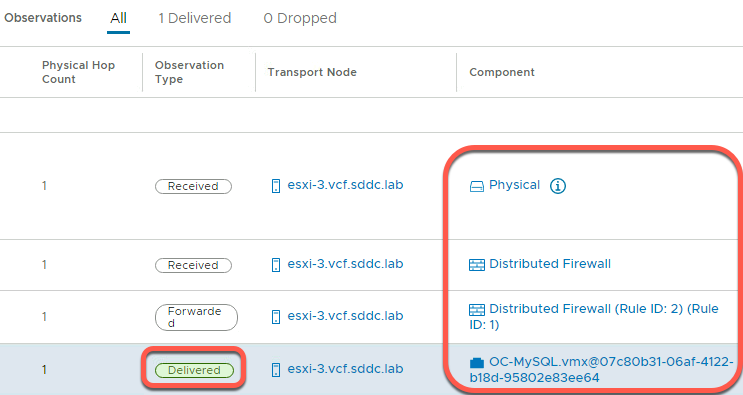
- In the Observations panel, observe the following
- One packet was delivered
- The physical hop count is zero, indicating that the packet did not leave the host
- The packet was injected at the network adapter for OC-Apache-A virtual machine
- It is then received at the distributed firewall at the VDS port for OC-Apache-A
- With no rule blocking, the packet is then forwarded on from the sending VDS port
- The packet is then received on the distributed firewall at the receiving VDS port for OC-Apache-B
- With no rule blocking forwarding, the packet is then forwarded to the destination
- The last step shows the packet being delivered to the network adapter for the OC-Apache-B VM
[Lab 2 Summary]
Lab 2 shows two very specific capabilities.
- Traceflow provides a powerful tool for visualizing and diagnosing NSX overlay networks. You will use Traceflow in several other communication scenarios in the remainder of this lab.
- The second point may not have been immediately obvious. While sending a packet between two hosts on the same subnet, the packet crossed two firewalls. In traditional networking, forcing a packet to traverse a firewall involves subnets, or complex traffic steering rules. With NSX, the distributed firewall is present on every VDS port. You will explore the distributed firewall in more detail in Module Two.
Lab 3: View packet flow between hosts
This lab uses the Traceflow capability in NSX to view traffic moving between virtual machines on different hosts on the same segment.
[Step 1] Setup VMs for test
- Using the Chrome bookmarks, access the vCenter Server Web Client by navigating to Managed bookmarks->Mgmt Domain->Mgmt vCenter
- Launch the vSphere Client and login to the Mgmt vCenter using the username administrator@vsphere.local and the password of VMware123!
- From the hosts and clusters view, click on OC-Apache-A to determine which ESXi host it is running on. In this example, OC-Apache-A is running on host esxi-3.vcf.sddc.lab
- Next click on OC-Apache-B and determine the host it is running on.
- If both VMs (OC-Apache-A and OC-Apache-B) are running on the same ESXi host, initiate a vMotion to move one of the VMs to a different host.
To perform the vMotion, right click on the VM and select Migrate.
Click Next to change the compute resource only
Select the ESXi host to migrate to, then click Next
Click Next to accept the default network selection
Click Next to accept the default vMotion priority
Click Finish to perform the migration
[Step 2] View packet flow
- On the Holo-Console, open a new tab in the Chrome browser
- Click the Managed bookmarks folder in the bookmark bar then select Mgmt Domain->Mgmt NSX
- Log into NSX Manager as the user admin with the password VMware123!VMware123!
- Click Plan and Troubleshoot
- Click Traffic Analysis
- Click Get Started on the Traceflow box
- Select the dropdown for the Source VM Name and select OC-Apache-A
- Select the dropdown for the Destination VM Name and select OC-Apache-B
- Scroll down and click Trace
- The path the packets take are shown on the resulting topology view.
In this example, packets moved from OC-Apache-A to OC-Apache-B via the OC-Web-Segment
- Click the X to close the “multiple physical received observations” banner if displayed, as this is expected in a nested lab environment and it can be safely ignored
![]()
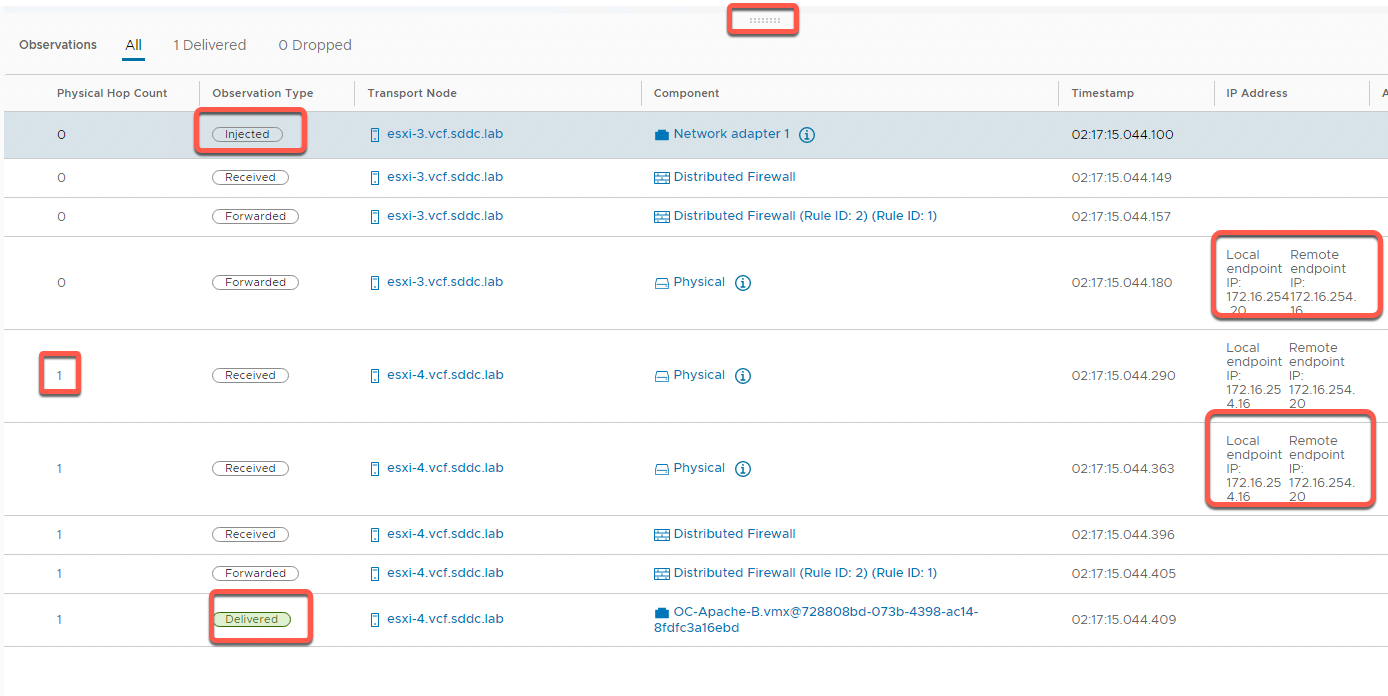
- Resize the observations window by dragging the center icon upward
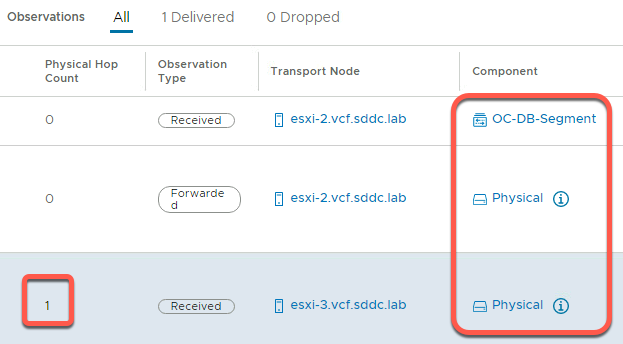
- In the Observations panel, note the following
- One packet was delivered as expected. These is no change in firewall behavior from the last example
- Because OC-Apache-B is now on a different host, the packet crosses the physical layer and increments the hop count
- You can see the Local Endpoint IP and Remote Endpoint IP for esxi-3, and opposite local and remote view from esxi-4. This is an example of NSX “Tunnel Endpoints” in use as opposite ends of an overlay network path between hosts.
[Step 3] View Host TEP information
- On the Holo-Console, open a new tab in the Chrome browser
- Click the Managed bookmarks folder in the bookmark bar then select Mgmt Domain->Mgmt NSX
- Log into NSX Manager as the user admin with the password VMware123!VMware123!
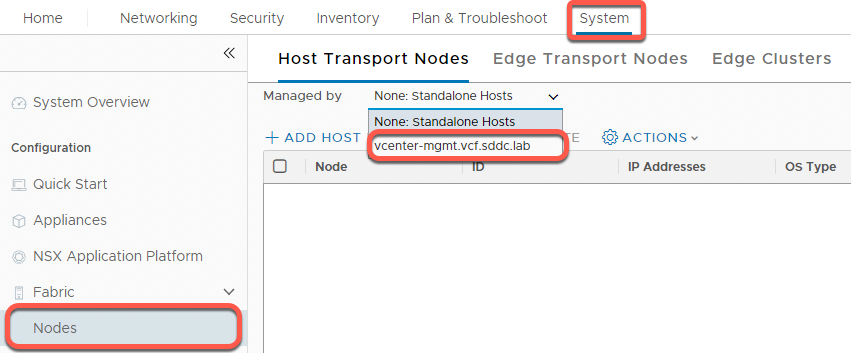
- On the top menu bar click System
- In the left menu click Fabric
- Click Nodes
- On the Managed By field select vcenter.mgmt.vcf.sddc.lab from the dropdown
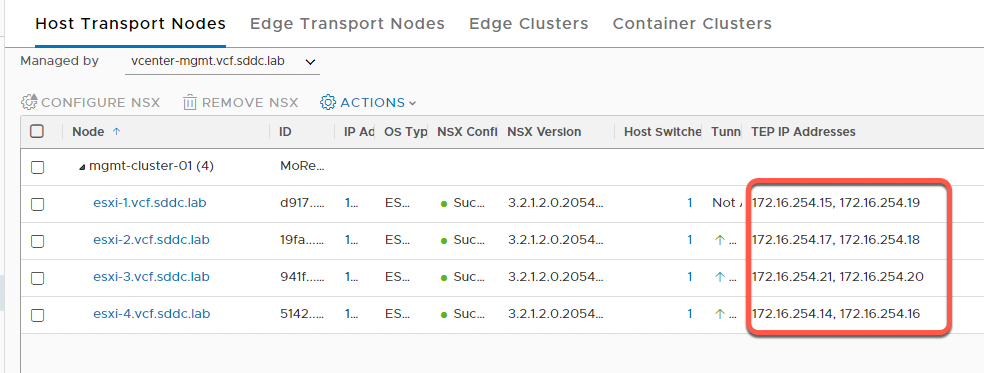
- Expand the mgmt-cluster
- Notice the TEP IP Addresses column. You can widen the browser as well as resize columns as needed to see TEP addresses. Each host has two TEP interfaces in the Host TEP VLAN. In the Holodeck lab configuration, Host TEP addresses are automatically allocated using DHCP on the 172.16.254.1/24 network.
- The NSX Manager is responsible for updating all transport nodes in the transport zone any time a VM powers on or is migrated. This provides mapping of VM to TEP addresses to send overlay traffic for a specific VM. As a TEP, the NSX prepped vSphere Distributed switch is responsible to de-encapsulate overlay traffic to a VM and encapsulate traffic to communicate on the overlay. This is transparent to the VM and the underlay network
[Lab 3 Summary]
Lab 3 extends the concept of overlay networks to separate hosts. NSX Manager keeps all hosts participating in a transport zone up to date as to what Host TEP address to use to send packets to a specific VM. The concept of overlay networking is very powerful, as the IP network information of the virtual machines communicating is completely independent of the underlying transport network. In this example, the two ESXi hosts communicate over a 172.16.254.0/24 subnet for any overlay traffic on any segment running on these hosts. The underlying ESXi hosts could also be on different subnets due to being in different rows in a datacenter, buildings in a campus or datacenters in a local region. Overlay networking removes the artificial limits various datacenter IP strategies place on where a given workload can be run.
Lab 4: Adding router connectivity
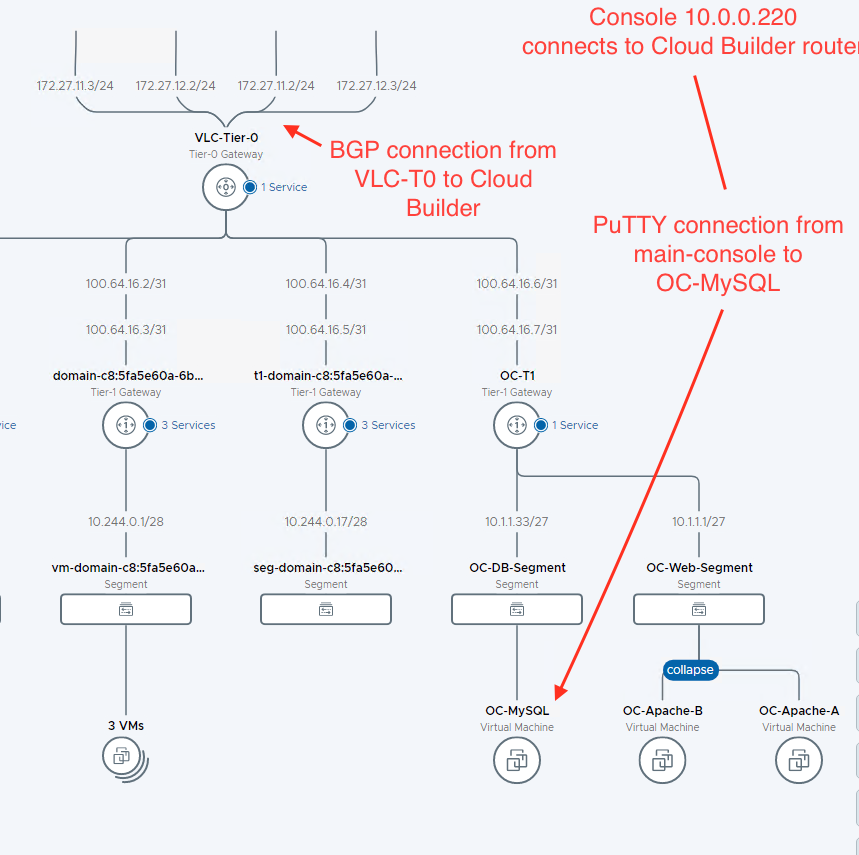
In Lab 1, two segments were created. These segments are not connected or connected to other parts of the network. This lab adds an NSX Tier-1 (T1) router. Connecting the OC-Web-Segment and OC-App-Segment router will allow for communication between the two segments. Finally, this lab demonstrates connecting the T1 router to the existing Tier-0 (T0) router allowing for communication outside the lab environment.
[Step 1] Create a T1 Router
- On the Holo-Console, open a new tab in the Chrome browser
- Click the Managed bookmarks folder in the bookmark bar then select Mgmt Domain->Mgmt NSX
- Log into NSX Manager as the user admin with the password VMware123!VMware123!
- Click Networking
- Click Tier-1 Gateways in the left navigation panel
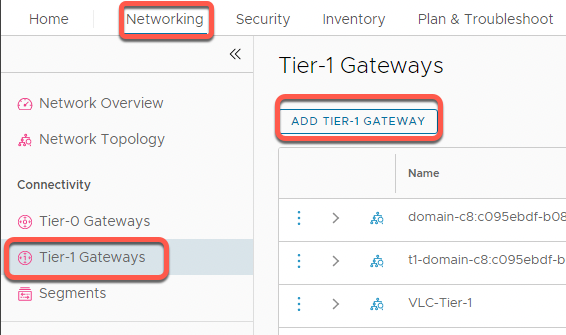
- Click on Add Tier-1 Gateway
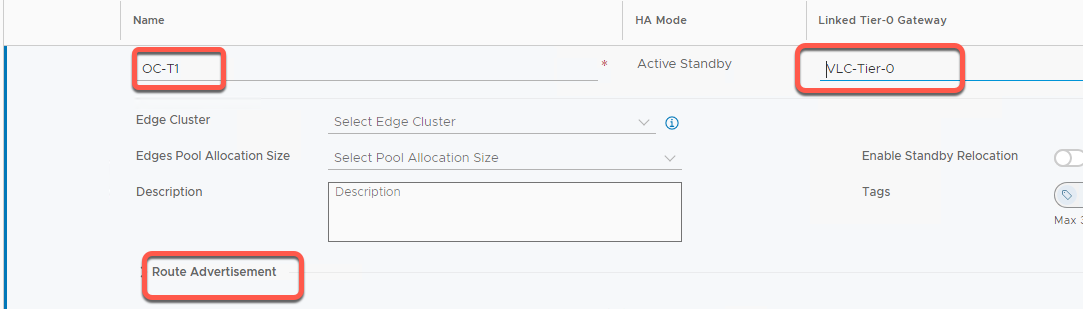
- Name the gateway OC-T1 and click Select Tier-0 Gateway and select VLC-Tier-0.
- Click on the Edge Cluster dropdown.
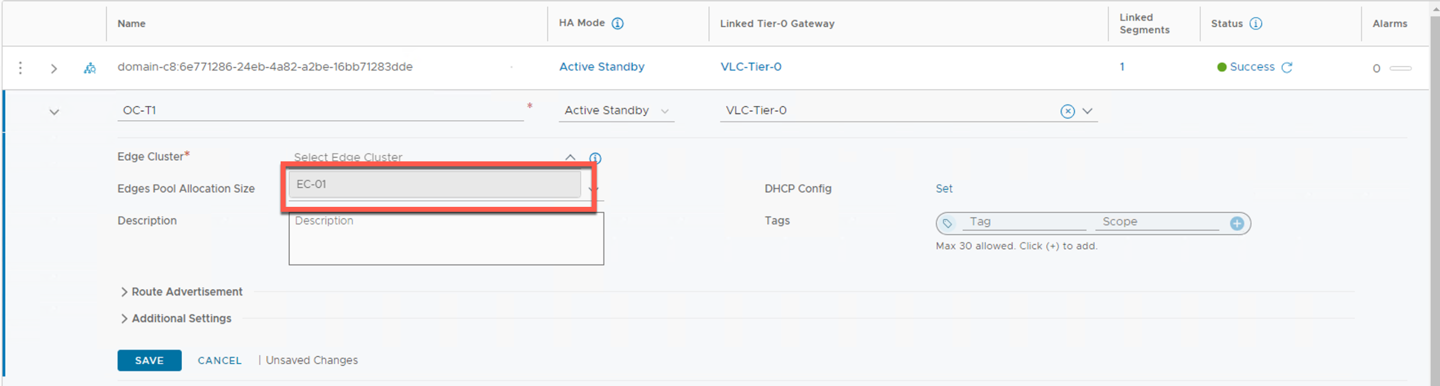
- Select EC-01 and Click Save.
- Expand Route Advertisement
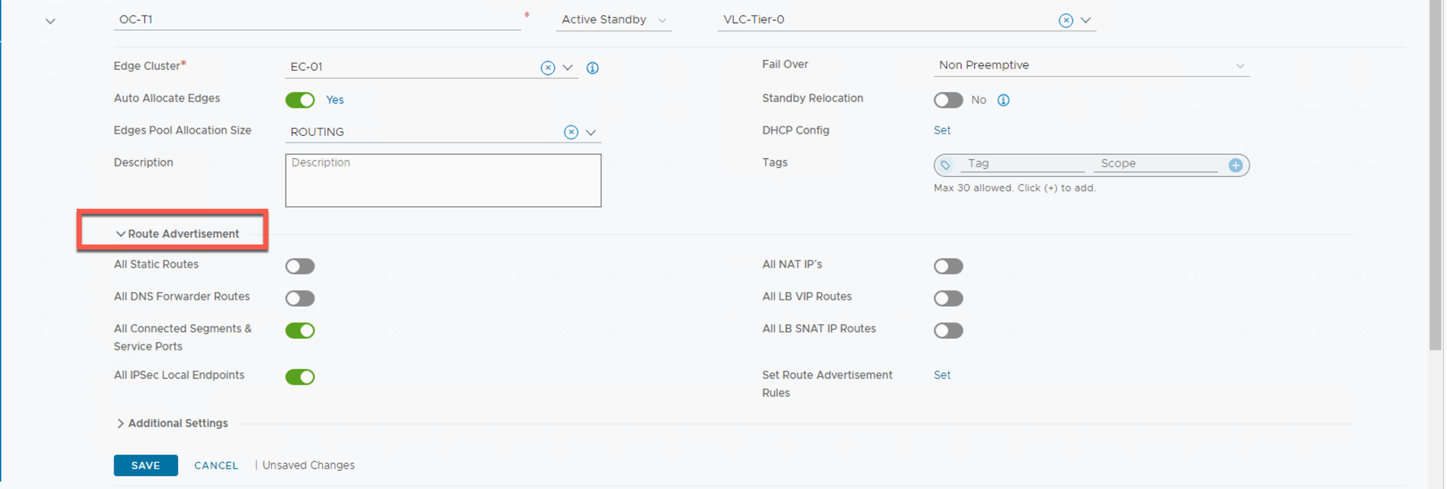
- Enable All Connected Segments & Service Ports
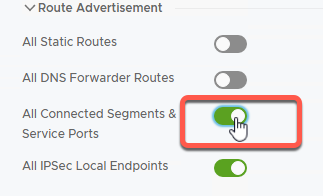
- Click Save
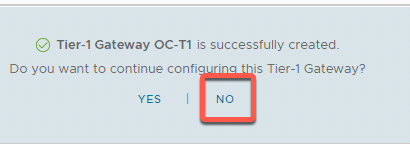
- Click No at the dialog asking, ‘Do you want to continue configuring this Tier-1 Gateway?’
- Click the refresh icon in the Status column until the status shows Success
![]()
[Step 2] Connect segments to OC-T1
- On the Holo-Console, open a new tab in the Chrome browser
- Click the Managed bookmarks folder in the bookmark bar then select Mgmt Domain->Mgmt NSX
- Log into NSX Manager as the user admin with the password VMware123!VMware123!
- Click Segments
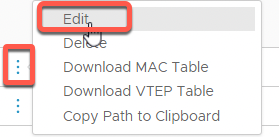
- Click the three dots to the left of OC-DB-Segment then select Edit
- Under Connected Gateway, scroll to find OC-T1 and click to select.
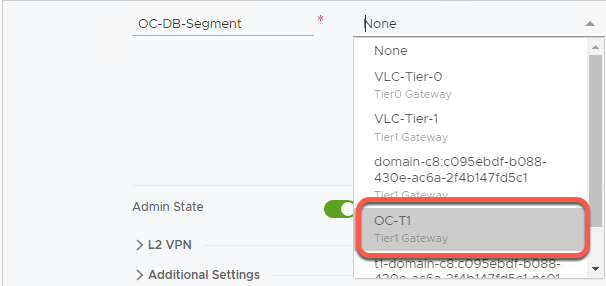
- Click Save
- Click Close Editing
- Click the three dots to the left of OC-Web-Segment then select Edit
- Under Connected Gateway, scroll to find OC-T1 and click to select
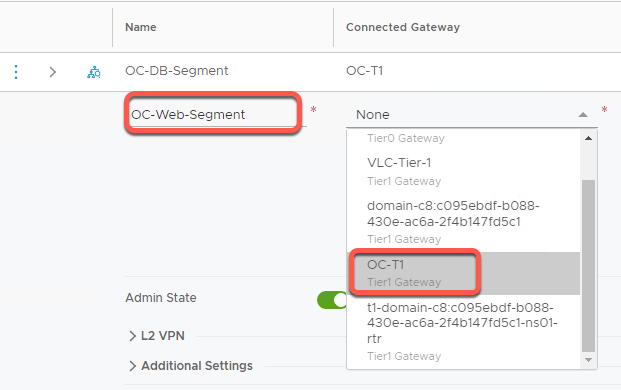
- Click Save
- Click Close Editing
[Step 3] Attach OC-MySQL to segment OC-DB-Segment
- Using the Chrome bookmarks, access the vCenter Server Web Client by navigating to Managed bookmarks->Mgmt Domain->Mgmt vCenter
- Launch the vSphere Client and login to the Mgmt vCenter using the username administrator@vsphere.local and the password of VMware123!
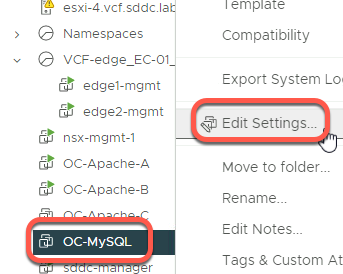
- From the hosts and clusters view, right click on OC-MySQL and click Edit Settings
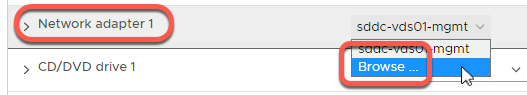
- Click the dropdown next to Network Adapter 1
- Click Browse
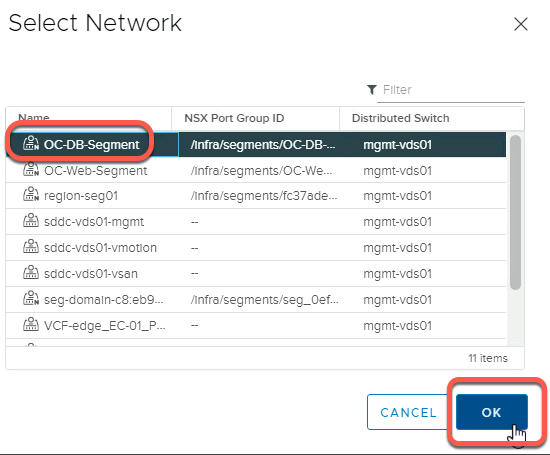
- Click OC-DB-Segment
- Click OK
- Click OK
- Power on the VM
[Step 4] Review network topology
- On the Holo-Console, open a new tab in the Chrome browser
- Click the Managed bookmarks folder in the bookmark bar then select Mgmt Domain->Mgmt NSX
- Log into NSX Manager as the user admin with the password VMware123!VMware123!
- Click Networking
- Click Network Topology
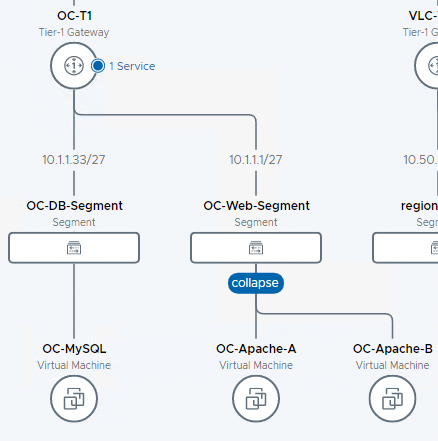
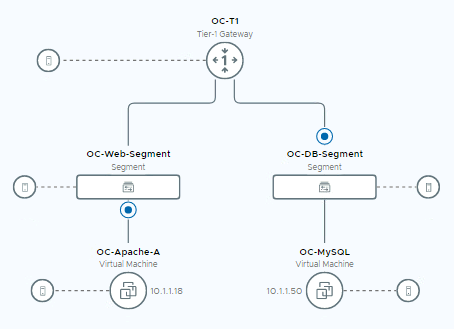
- Click to zoom in to see the OC-T1 Tier-1 Gateway
- Observe the newly created Tier-1 Router and connected segments are visible on the topology map
- Expand the VM’s under each segment.
[Step 5] Test Web to App communications
- Using the Chrome bookmarks, access the vCenter Server Web Client by navigating to Managed bookmarks->Mgmt Domain->Mgmt vCenter
- Launch the vSphere Client and login to the Mgmt vCenter using the username administrator@vsphere.local and the password of VMware123!
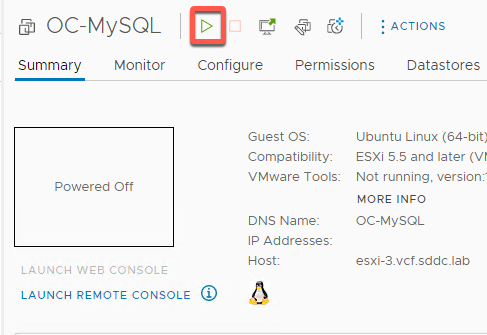
- From the hosts and clusters view, click on OC-MySQL
- Power on the OC-MySQL VM
- Wait for the OC-MySQL VM to boot
- Click Launch Web Console
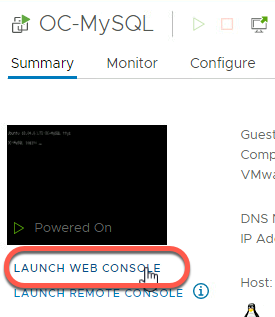
- If a login prompt is not shown, press Enter
- Login ocuser password VMware123!
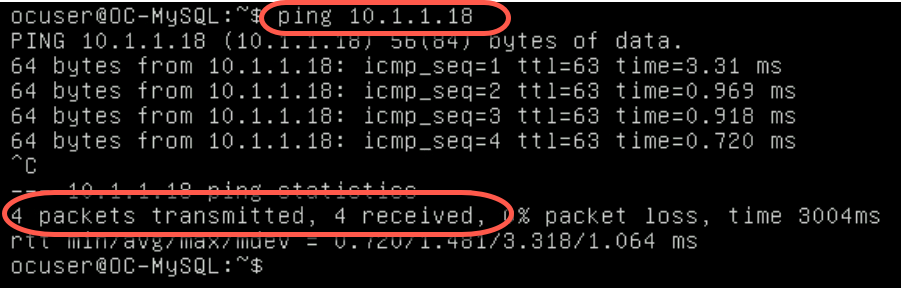
- Enter the following command
ping 10.1.1.18
- Wait for the ping command to output a few lines. Type Control-C to stop the ping command
- Observe the success of the ping command.
This success indicates successful communication between the OC-MySQL and OC-Apache-A (10.1.1.18) VMs. For this communication to be successful, the network traffic had to traverse the OC-T1 router configured earlier
[Lab 4 Summary]
Lab 4 added L3 routing between segments in less than 10 minutes. Compare this to your experience in time taken to get a multi-tier network stood up in your environment.
Lab 5: View L3 packet flow within a host
This lab uses the Traceflow feature in NSX to view traffic moving between virtual machines on the same host, on different segments. In most datacenters, the network path required to allow for this communication requires packets moving through to an external router at the top of rack, or end of row, or datacenter core router.
[Step 1] Setup VMs for test
- Using the Chrome bookmarks, access the vCenter Server Web Client by navigating to Managed bookmarks->Mgmt Domain->Mgmt vCenter
- Launch the vSphere Client and login to the Mgmt vCenter using the username administrator@vsphere.local and the password of VMware123!
- From the hosts and clusters view, click on OC-Apache-A to determine which ESXi host it is running on. In this example, OC-Apache-A is running on host esxi-3.vcf.sddc.lab
- Next click on OC-MySQL and determine the host it is running on.
- If both VMs (OC-Apache-A and OC-MySQL) are running not on the same ESXi host, initiate a vMotion to move them to the same host
To perform the vMotion, right click on the VM and select Migrate.
Click Next to change the compute resource only
Select the ESXi host to migrate to, then click Next
Click Next to accept the default network selection
Click Next to accept the default vMotion priority
Click Finish to perform the migration
[Step 2] View Layer 3 communications in NSX Traceflow
- On the Holo-Console, open a new tab in the Chrome browser
- Click the Managed bookmarks folder in the bookmark bar then select Mgmt Domain->Mgmt NSX
- Log into NSX Manager as the user admin with the password VMware123!VMware123!
- Click Plan & Troubleshoot
- Click Traffic Analysis in the left navigation panel
- Click Get Started on the Traceflow box
- Configure a Traceflow from OC-Apache-A to OC-MySQL
- Click Trace
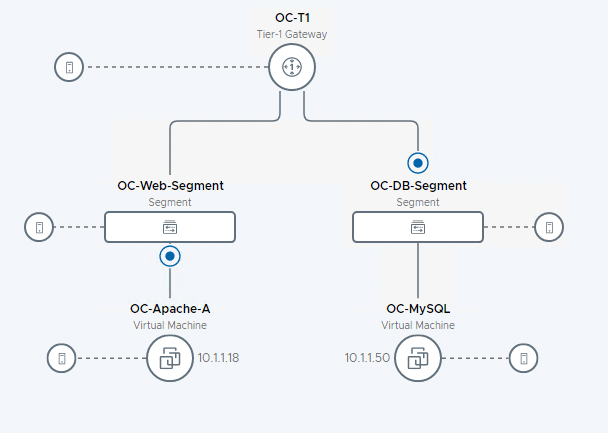
- Notice the communication path traverses the OC-T1 router in the Traceflow topology diagram.
- In the Observations panel, review the following:
- As before, with no firewall rules in place, one packet was delivered
- Notice the packet routed between the OC-Web-Segment and OC-DB-Segment via the OC-T1 router, while never leaving the host as the Physical Hop Count remains zero
Lab 5 Summary
Lab 5 is a very simple example of the power of distributed routing in NSX. In a traditional environment, L3 routing happens in the datacenter, somewhere away from the server. There are many different architectures but each effectively requires the packets to leave the host to be routed elsewhere in the datacenter to get back to a VM on the same host. With NSX distributed routing, the routing happens right at the host between different connected segments.
Lab 6: View L3 packet flow between hosts
This lab demonstrates the use of the Traceflow feature in NSX to view traffic moving between virtual machines on the different hosts and segments. In most datacenters, the network path required to allow for this communication requires packets moving through an external router. This example shows the power of distributed routing.
[Step 1] Setup VMs for test
- Using the Chrome bookmarks, access the vCenter Server Web Client by navigating to Managed bookmarks->Mgmt Domain->Mgmt vCenter
- Launch the vSphere Client and login to the Mgmt vCenter using the username administrator@vsphere.local and the password of VMware123!
- From the hosts and clusters view, click on OC-Apache-A to determine which ESXi host it is running on.
- Next click on OC-MySQL and determine the host it is running on.
- If both VMs (OC-Apache-A and OC-MySQL) are running on the same ESXi host, initiate a vMotion to move one of them to a different host
To perform the vMotion, right click on the VM and select Migrate.
Click Next to change the compute resource only
Select the ESXi host to migrate to, then click Next
Click Next to accept the default network selection
Click Next to accept the default vMotion priority
Click Finish to perform the migration
[Step 2] View Layer 3 communications in NSX Traceflow
- On the Holo-Console, open a new tab in the Chrome browser
- Click the Managed bookmarks folder in the bookmark bar then select Mgmt Domain->Mgmt NSX
- Log into NSX Manager as the user admin with the password VMware123!VMware123!
- Click Plan & Troubleshoot
- Click Traffic Analysis in the left navigation panel
- Click Get Started on the Traceflow box
- Configure a Traceflow from OC-Apache-A to OC-MySQL
- Click Trace
- Notice the communication path traverses the OC-T1 router in the Traceflow topology diagram.
- In the Observations panel, review the following
- One packet was delivered
- The packet was injected at the network adapter for OC-Apache-A virtual machine
- It is then received at the distributed firewall at the VDS port for OC-Apache-A
- With no rule blocking, the packet is then forwarded on from the sending VDS port
- The packet then hits OC-T1 router and gets forwarded to the OC-Web-Segment
- Since OC-Apache-A and OC-MySQL are running on different ESXi hosts, the physical hop count increases
- The packet is then received on the distributed firewall at the receiving VDS port for OC-MySQL
- With no rule blocking forwarding, the packet is then forwarded to the destination
- The last step shows the packet being delivered to the network adapter for the OC-MySQL VM
[Step 3] Test end to end communications
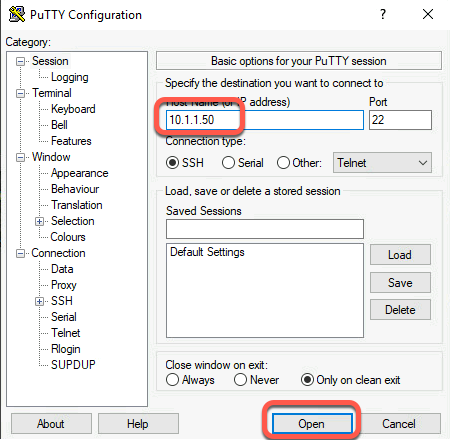
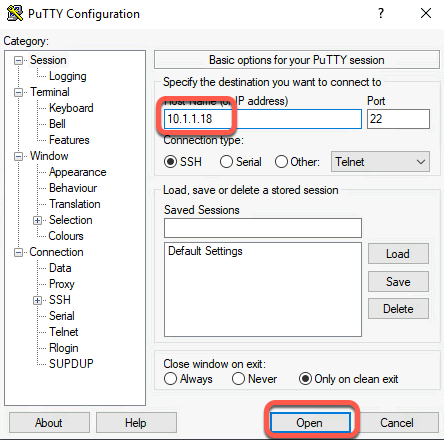
- On the Holo-Console, double click the PuTTY icon on the desktop to start the PuTTY application
- Enter 10.1.1.50 for the IP address to connect to. This is the IP address for the OC-MySQL VM
- Click Open
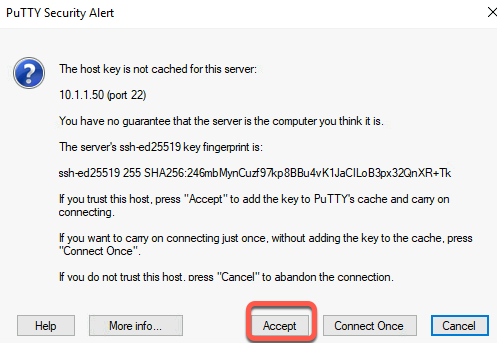
- Click Accept to add the SSH host key to PuTTY’s cache and continue to connect
- If a login prompt does not appear, close the PuTTY window, and restart this step.
- Login with the username ocuser and the password VMware123!
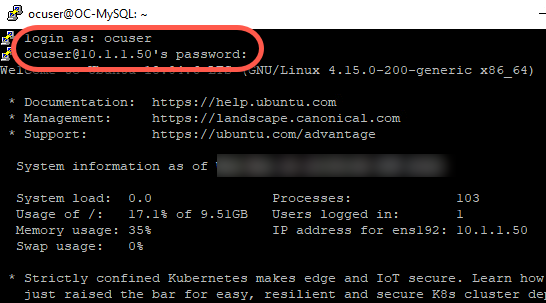
- Successfully connecting from the Holo-Console to the OC-MySQL VM verifies the entire SDN connection. In this lab configuration, the NSX Edge Cluster connects via BGP to the pod router where the Holo-Console is connected. Secure SSH traffic from the Holo-Console flows to the pod router, over BGP links to the Tier-0 router, to the OC-T1 router, to the OC-MySQL VM on OC-App-Segment, and returns.
[Lab 6 Summary]
Lab 5 demonstrates packets traveling between the VDS ports for two virtual machines running on different ESXi hosts across two segments connected by a Tier-1 router. The important distinction is this router functionality was distributed across all hosts versus a physical device cabled somewhere else in the datacenter.
Lab 7: Testing the application
This lab verifies the web server VMs and database VM are working correctly prior to moving on to other topics, such as load balancing and security.
[Step 1] Restart web servers
- On the Holo-Console, double click the PuTTY icon on the desktop to start the PuTTY application
- Enter 10.1.1.18 for the IP address to connect to. This is the IP address for the OC-Apache-A VM
- Click Open
- Click Accept to add the SSH host key to PuTTY’s cache and continue to connect
- If a login prompt does not appear, close the PuTTY window, and restart this step.
- Login with the username ocuser and the password VMware123!
- Run the following command:
sudo systemctl restart apache2
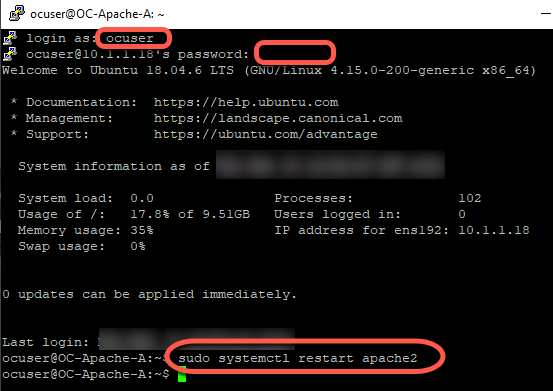
- Repeat this step for the OC-Apache-B VM using the IP address of 10.1.1.19
[Step 2] Test Opencart app
- On the Holo-Console, open a new tab in the Chrome browser
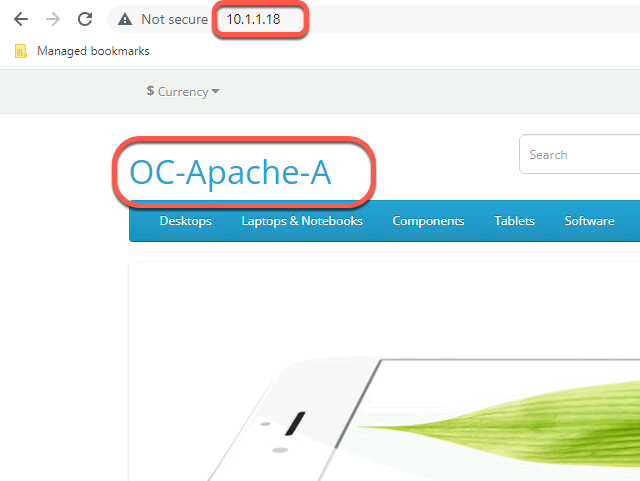
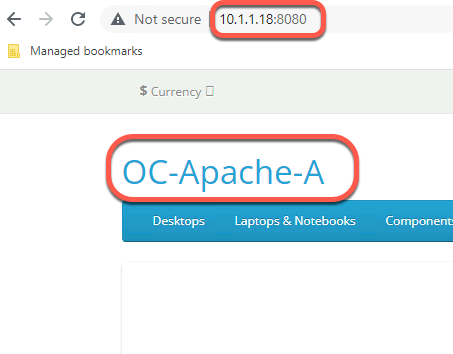
- Connect to OC-Apache-A 10.1.1.18
- Observe the OC-Apache-A web page loads. Note that the name of the host (OC-Apache-A) is shown on the page to assist in identifying what webserver is hosting the web page.
- Connect to the alternate port (8080) on OC-Apache-A by using the address of 10.1.1.18:8080. The identical output is shown. Port 8080 is used later in the security lab.
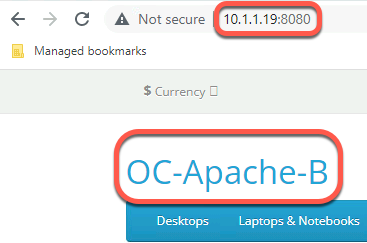
- Repeat this step for the OC-Apache-B VM using the IP address of 10.1.1.19
[Lab 7 Summary]
Congratulations. In just the time it took to get this far in the lab, two brand new overlay network segments and a software defined router were deployed and configured to allow for network traffic between the segments.