
Intel Optane DC Persistent Memory “Memory Mode” Virtualized Performance Study
Executive Summary
Intel® Optane™ DC Persistent Memory is a new memory technology enabling a dramatic increase in server memory capacity. A modified version of VMware VMmark® 3.1 and a new Heavy Memory Workload Profile in View Planner™ 4.1, both industry-standard benchmarks, as well as a memory-intensive enterprise Java application, were used to study the performance and scalability of a VMware vSphere® 6.7 virtualized platform using Intel Optane DC Persistent Memory. In this paper, we demonstrate the performance of standard 2socket servers configured with 512 GB of Intel Optane DC Persistent Memory in Memory Mode. Testing with a version of VMmark 3.1 modified to use larger amounts of memory, the system with persistent memory achieved a 33% increase in VM density and 24% increase in throughput compared to an equivalently configured, traditional DRAM-based system. Virtual desktop infrastructure (VDI) experiments showed a 22% increase in VM density on the persistent memory system. Tests using a memory-intensive application and larger Persistent Memory configurations, however, demonstrated some use cases where performance could be impacted by the unique architecture of the solution.
Introduction
Intel Optane DC Persistent Memory is a new memory technology that can deliver larger capacities than traditional DRAM memory. Increasing the memory capacity in a virtualized datacenter potentially allows for an increase in VM density–and a subsequent increase in application capacity and performance–without increasing the datacenter footprint.
Due to its higher latencies, this new memory technology has a slightly lower performance profile than DRAM memory. It can be configured in either of two operating modes: Memory Mode, in which the DRAM memory acts as an L4 cache for the persistent memory; and App Direct Mode, in which the DRAM and the persistent memory are accessed independently. Depending on a range of factors, persistent memory can have an impact on the performance of memory-intensive applications.
We explored the performance impact of this new memory technology using a modified version of VMmark 3.1
[1] and a new Heavy Memory Workload Profile in VMware View Planner 4.1 [2], as well as a memory-intensive enterprise Java application. We first explored how VMmark is impacted with the larger amount of memory available. We measured this impact by using a version of VMmark 3.1 which was modified to increase the memory footprint of the workload. We compared the performance of this modified VMmark 3.1 on a system configured with only DRAM to its performance on a system configured with both DRAM and Intel Optane DC Persistent Memory in Memory Mode. We then compared the performance of a DRAM-only system and a system with Intel Optane DC Persistent Memory using View Planner with a new Heavy Memory Workload Profile. Finally, we measured the impact of the higher latency of Intel Optane DC Persistent Memory using a memory-intensive enterprise Java application and then explored the impact that this application might have when running simultaneously with VMmark.
Intel Optane DC Persistent Memory
Intel Optane DC Persistent Memory is a new memory technology that delivers a unique combination of affordable large capacity and support for data persistence. It is positioned as a bridge between the
performance and high cost of DRAM and the capacity and low cost of storage. The Intel Optane DC Persistent Memory modules (DCPMM) are available in capacities of 128 GB, 256 GB, and 512 GB, and are physically/electrically compatible with DDR4 Memory. Intel Optane DC Persistent Memory is now in general release with the new, 2nd Generation Intel® Xeon® Scalable processor. Intel Optane DC Persistent Memory is expected to provide a lower total cost of operation (TCO) than using large amounts of DRAM memory or additional servers. Applications and virtualization environments specifically designed for Intel Optane DC Persistent Memory can take advantage of its large capacity, but it can also create innovative new capabilities that improve workload performance, utilization, and infrastructure resilience.
Memory Mode
Intel Optane DC Persistent Memory has two modes. The first is called Memory Mode. When running in this mode, the Intel Optane DC Persistent Memory is presented to applications and operating systems as if it were ordinary volatile memory. But, under the hood, the higher performance DRAM is used as a cache for the persistent memory. Memory Mode makes adoption of DCPMM technology easier because applications don’t need to be modified. The affordable capacity frequently makes it more cost-efficient than adding additional DRAM. However, as with any cache architecture, there can be variability in performance depending on workload, ratio of DRAM to persistent memory, and dataset characteristics.
For the experiments described in this paper, all the DCPMM was configured in Memory Mode.
App Direct Mode
The second DCPMM mode is called App Direct Mode. In this mode, applications and operating systems are explicitly aware of the two types of memory in the platform (DRAM and DCPMM) and can direct data reads or writes to the memory resource most suited to the task. Operations that require lower latency and don’t need permanent storage can be executed on DRAM; data that needs to be made persistent or structures that are very large can be routed to DCPMM. The ability to have permanent data storage in memory is what makes this architecture unique. This gives developers a new way to think about the tradeoffs between capacity and data persistence or between memory and storage. Both byte-level and block-level instructions can be directed to Intel Optane DC Persistent Memory, providing speed and byte-level control comparable to main memory, as well as data non-volatility traditionally available only in SSDs or hard drives.
VMware has enabled App Direct Mode by exposing the underlying persistent memory to applications running inside the VM. This will allow VM performance to be further improved as applications make even more efficient use of persistent memory by specifically designating which operations are best suited for DRAM and which are best suited for persistent memory. An examination of the performance of App Direct Mode can be seen in the “Persistent Memory Performance in vSphere 6.7 with Intel Optane DC Persistent Memory” [3] whitepaper.
VMmark 3.1 Increased Memory Configuration
VMmark 3.1 is an enterprise-level benchmark used to characterize datacenter performance. It combines commonly virtualized applications into predefined bundles called "tiles." The number of VMmark tiles a virtualization platform can run, as well as the cumulative performance of those tiles and of a variety of platform-level workloads, determines the VMmark score.
Note: The VMmark benchmark tests described in this paper were performed under VMmark’s Academic and Research rules. They are not compliant VMmark tests and can therefore not be compared with published VMmark results.
As a rough indication of the amount of memory used by the VMmark benchmark, currently published VMmark results show that a cluster of two 2-socket servers with Intel Xeon Platinum 8180 CPUs can support 8 tiles. With each tile consuming 158 GB, eight tiles would consume 1,264 GB, or 632 GB per host. Because modern servers typically have enough DRAM to completely supply this memory requirement, additional memory would be unlikely to significantly increase VMmark scores. In order to exercise the larger memory configuration possible with DCPMM, we needed to modify VMmark to consume additional memory without requiring additional CPU resources. We decided that roughly tripling VMmark’s memory consumption was a good target.
VMmark uses two application workloads, Weathervane (a scalable web simulation) and DVD Store 3 (an ecommerce simulation). The Weathervane workload VMs are tuned to support a fixed throughput, so it would have been difficult to modify those VMs to consume additional memory. However, the DVD Store workload runs unconstrained, which makes it much easier to modify to consume a larger amount of memory.
Determining the best configuration for DVD Store to consume a larger amount of memory required multiple test iterations. Table 1 lists the default configuration and the variables we changed. We first modified the VM memory size of the DVD Store workload then examined the results to determine the effect on the VMmark tile. We looked for large memory use with little or no increase in CPU utilization so that we could exercise the larger memory configuration without requiring additional CPUs. We then selected the parameter that resulted in the largest memory usage, considered that the new baseline, and continued with the next parameter. We repeated this until we had tested each configuration. Figures 1 through 4 show the total memory used for the entire tile.
|
Default |
Configurations Tried |
|
|
VM Memory Size |
32 GB |
128 GB, 250 GB, and 385 GB |
|
Think Time |
1 second |
0.5, 0.9, 1.25, and 1.5 seconds |
|
Number of Threads |
24 |
36 and 48 |
|
Number of Searches |
3 |
5, 7, and 9 |
|
Batch Search Size |
3 |
5, 7, and 9 |
|
Warm Up Time |
1 minute |
0 and 5 minutes |
|
Database Size |
100 GB |
300 GB and 500 GB |
Table 1. Changes to DVD Store default configuration to consume more memory
In the first experiment we performed, shown in Figure 1, we varied the RAM size of the DVD Store DS3DB VM. The size was increased to 128 GB, 250 GB, and finally 385 GB. Comparing the increased RAM sizes to the default RAM size of 32 GB, we saw that increasing the memory marginally reduced the CPU utilization of the VM. We found that the system memory usage greatly increased to around 200 GB when using the 128 GB VM RAM size, and then increased only slightly for the larger VM RAM sizes. While this change moved us in the right direction, we were still not using all the memory allocated, so we needed to adjust additional parameters. We chose to use the 250 GB VM memory size for the remaining tests.
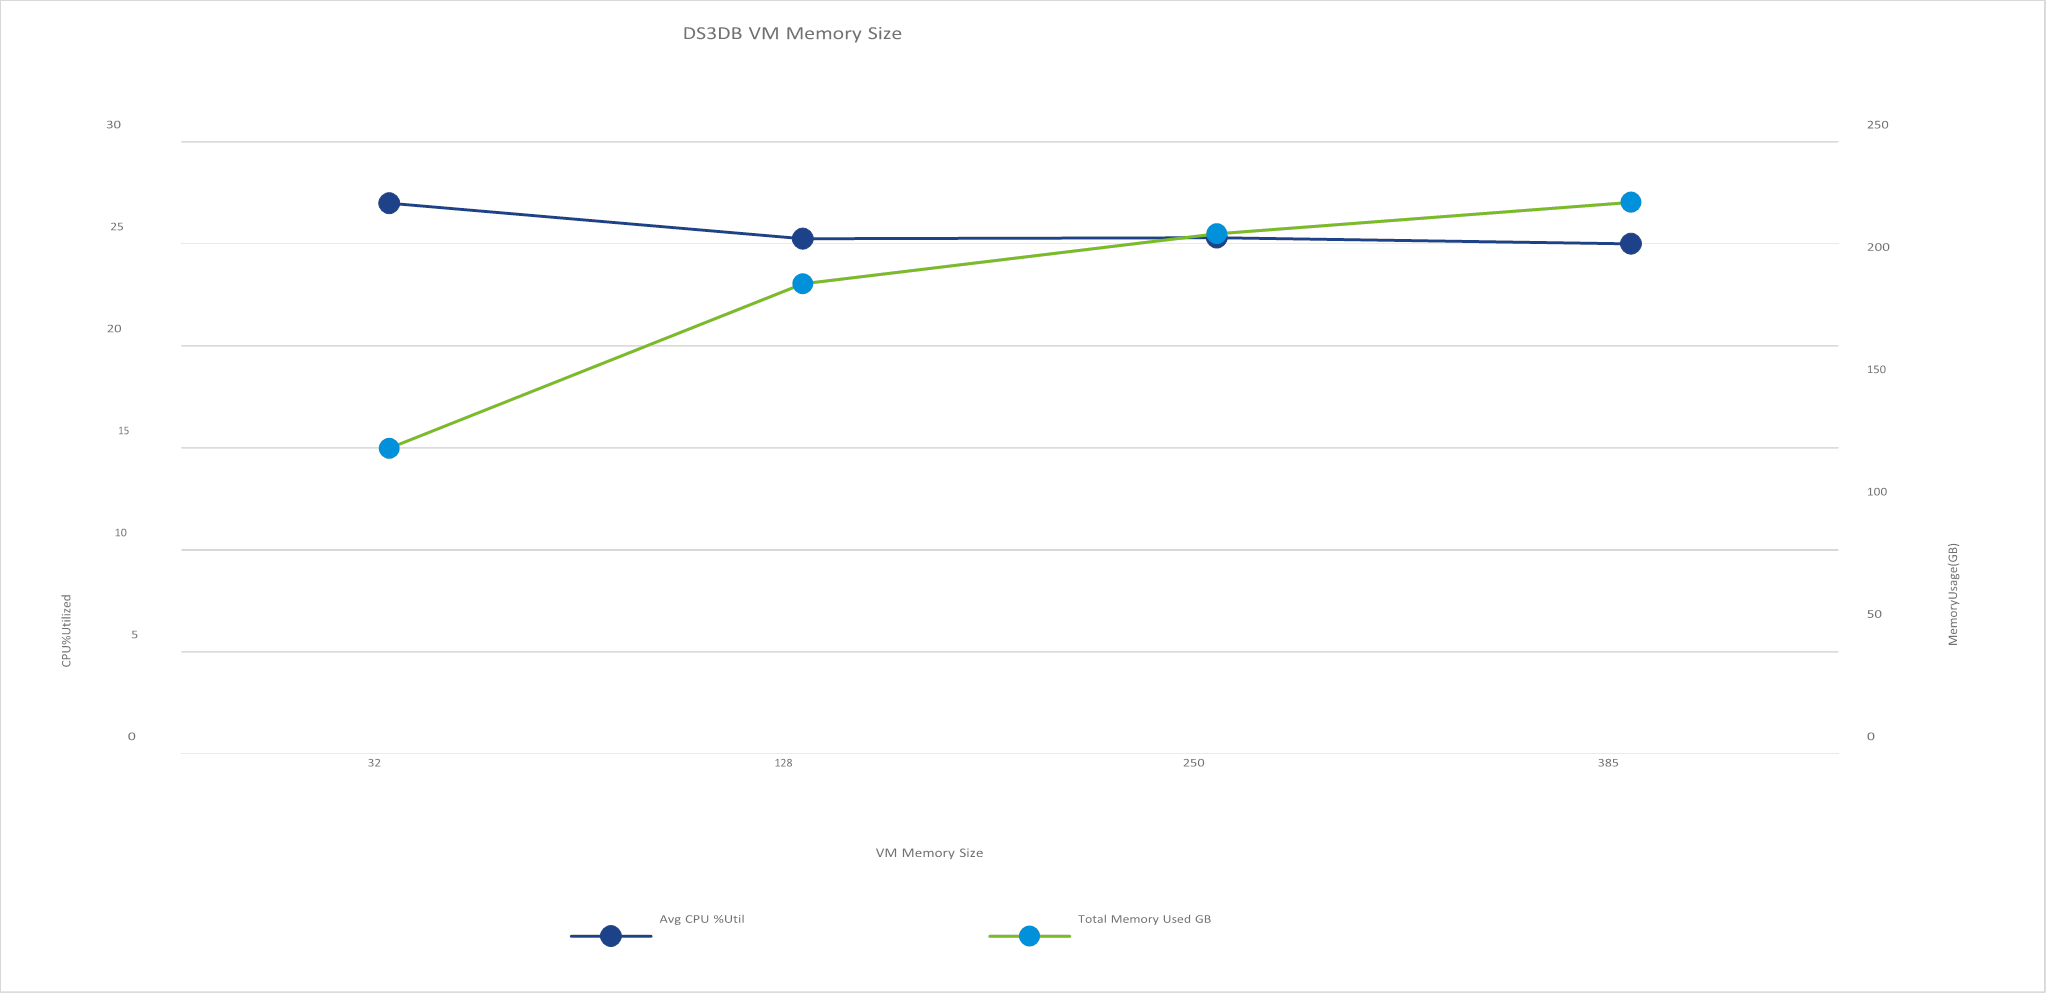
Figure 1. Average CPU percentage utilized plotted against total memory used—as more memory is used on the database VM, CPU utilization goes down
As a second step, we tried changing the think time of the DVD Store client driver while keeping the 250 GB VM memory size. Figure 2 shows the effect of these changes. While we did not see an appreciable increase in memory use at the lower think times, we did find that increasing the think time reduced the CPU utilization moderately. We chose to continue using the 1.5 seconds think time to reduce the CPU usage as much as possible. We wanted to have sufficient headroom to allow the use of the other changes.
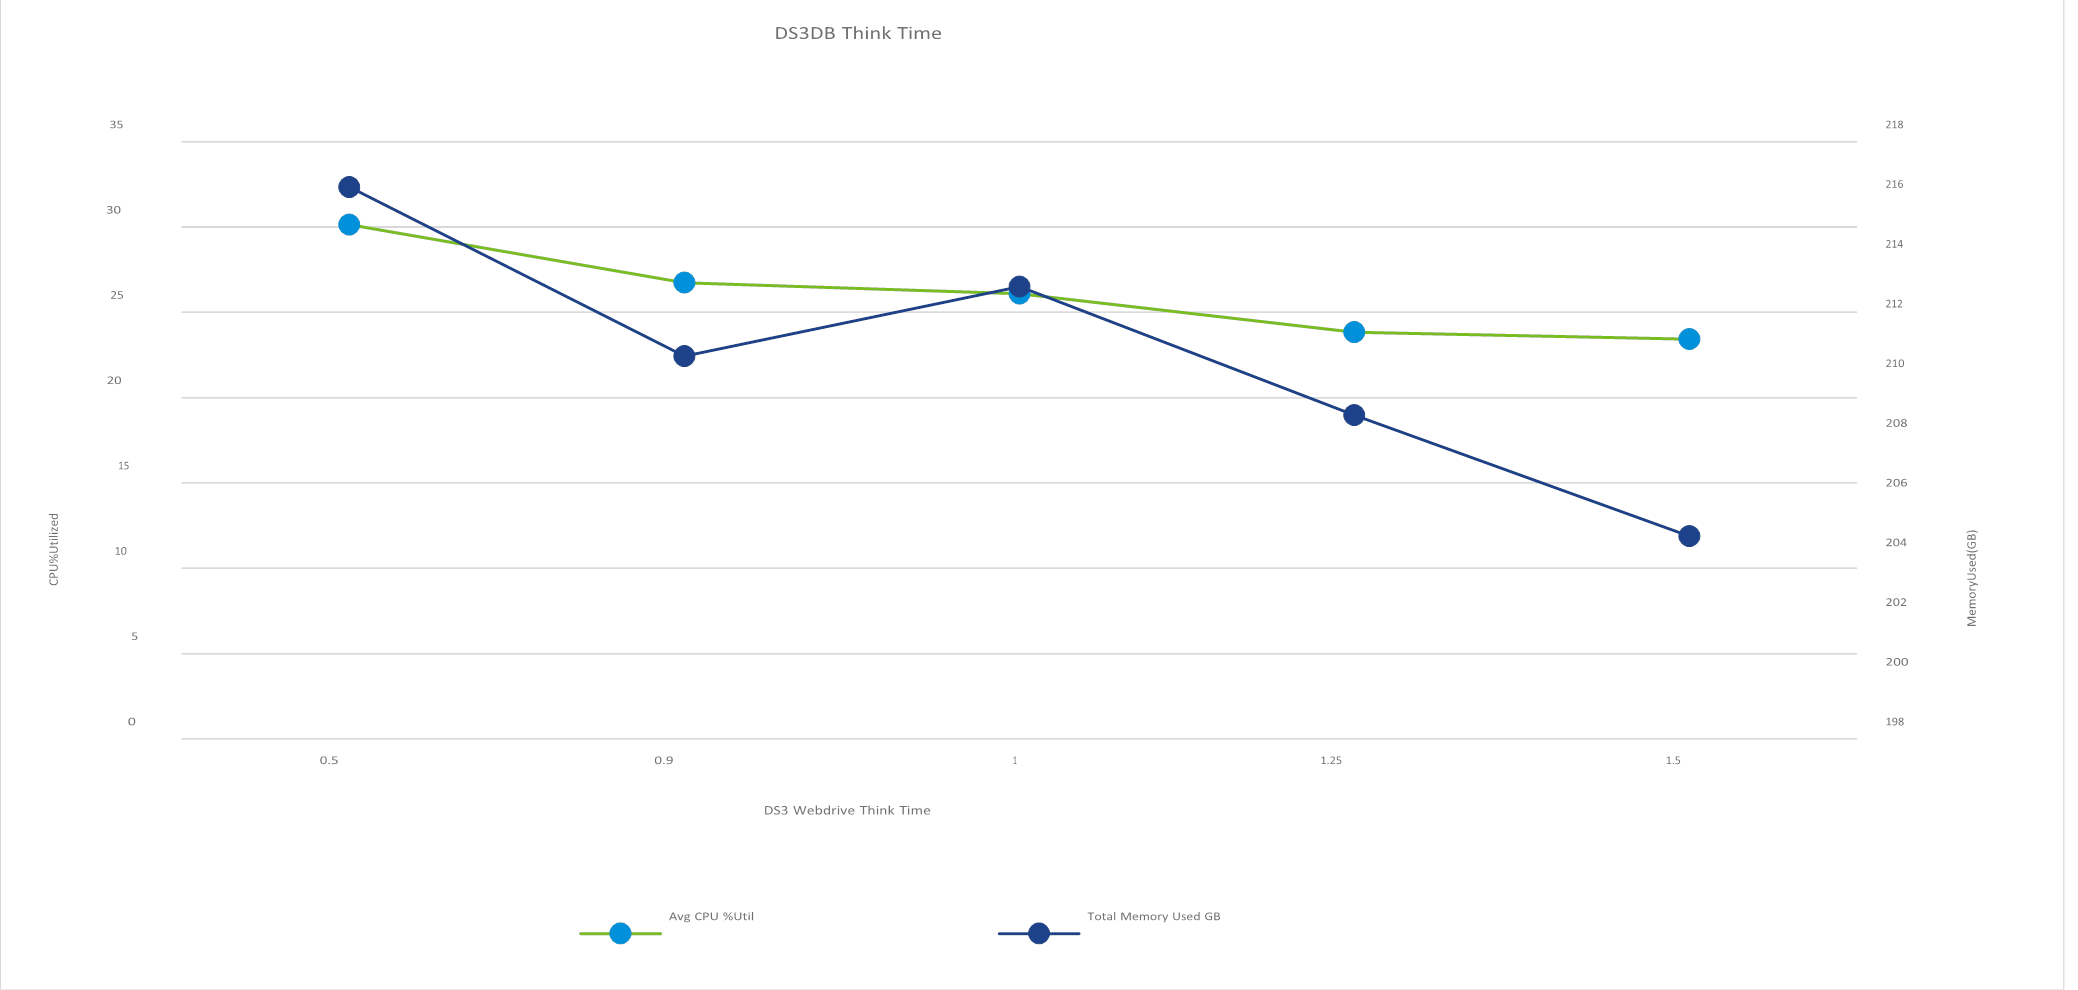
Figure 2. Time reserved for “users” to “think” before taking an action helps show a realistic user experience—the database
VM responded with lower memory used as CPU utilization dropped slightly
As a third experiment, we tried increasing the number of threads of the client drivers and compared this to the default DVD Store configuration. We kept the 250 GB VM memory size and 1.5 seconds think time. We found that this change caused a small increase in memory use, but it also caused an increase in the CPU utilization. This is shown in Figure 3. Since the increase in memory use was small, we chose to keep the default of 24 threads.
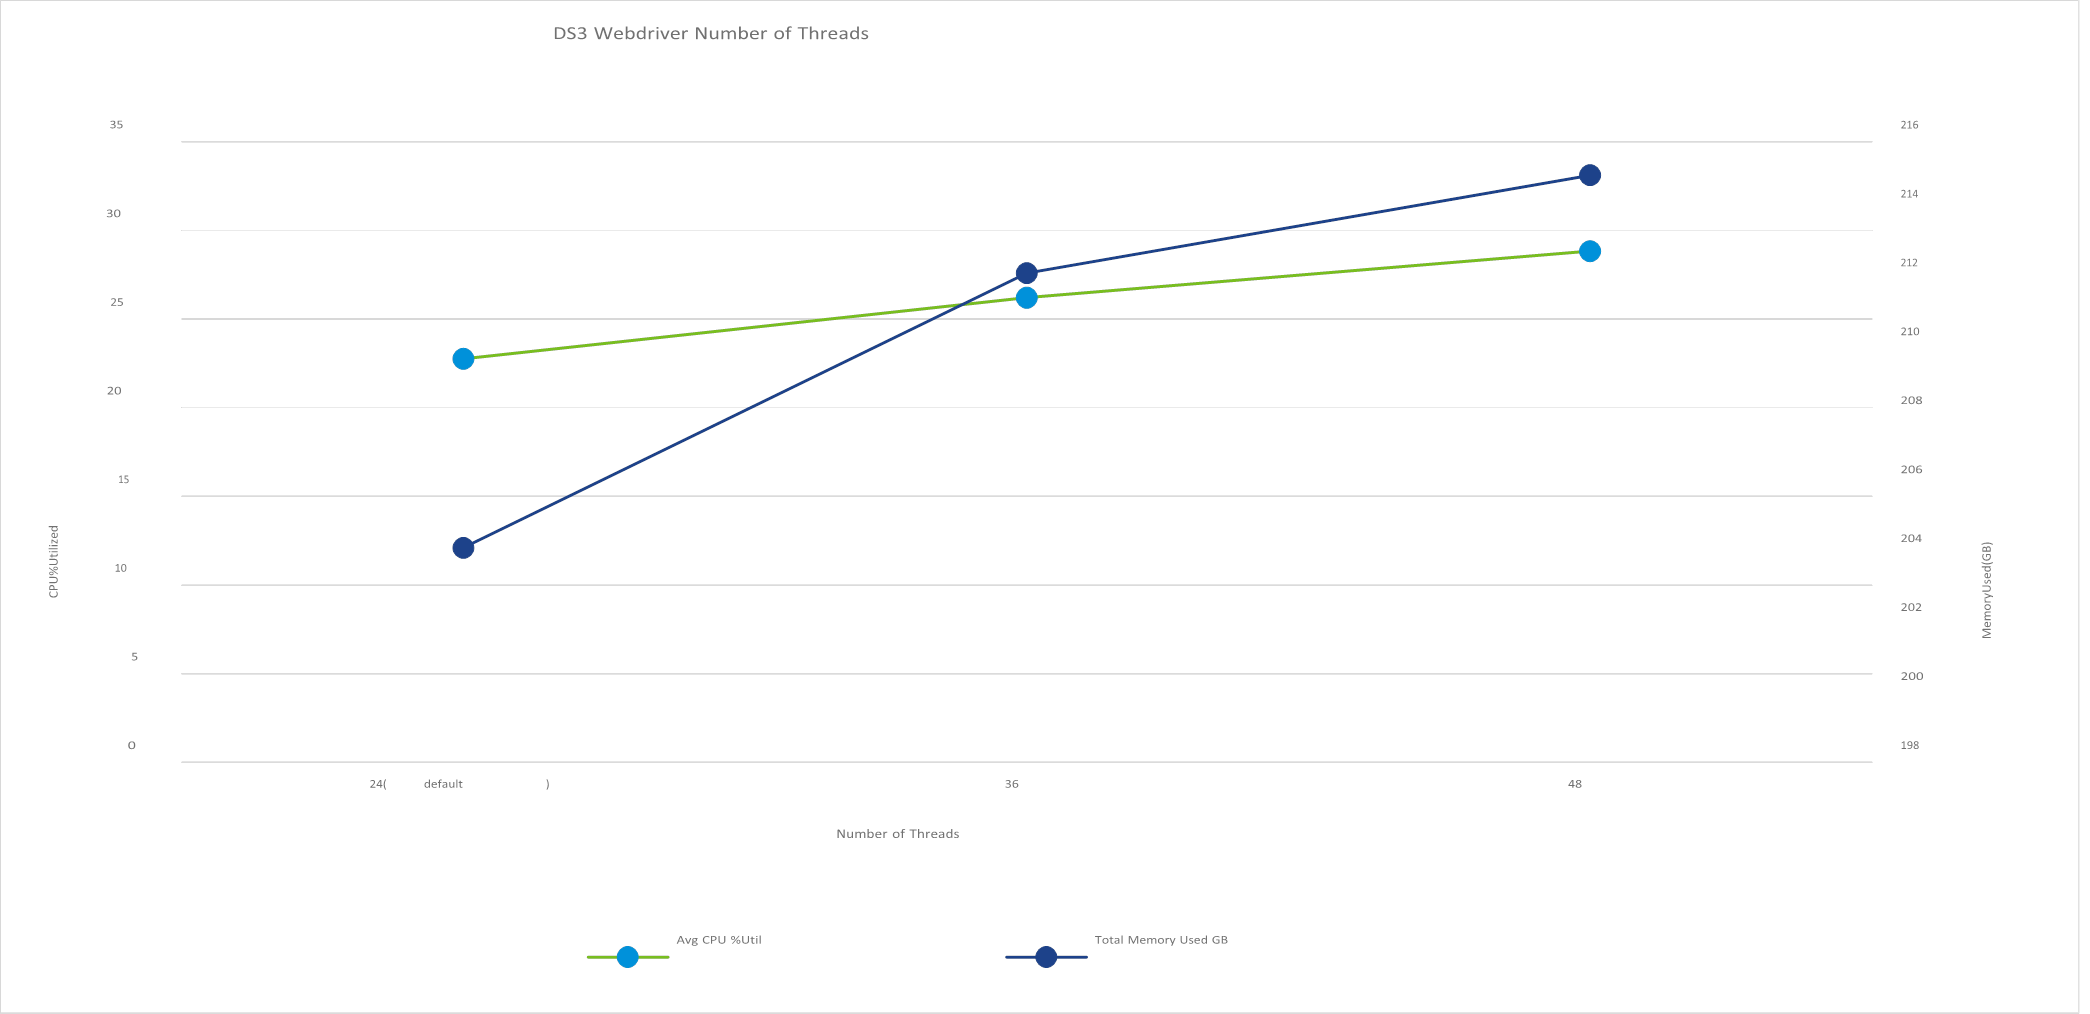
Figure 3. Increasing the number of threads of the client drivers and running this against the default DVD Store configuration caused a small increase in memory use and an increase in the CPU utilization
As a final experiment, we increased the DVD Store database size from the default 100 GB to 300 GB and 500 GB. We again kept the 250 GB VM memory size and 1.5 seconds think time. We found that the 500 GB size increased the memory use; however, the 300 GB size was a good balance between CPU utilization and memory use. The results are shown in Figure 4.
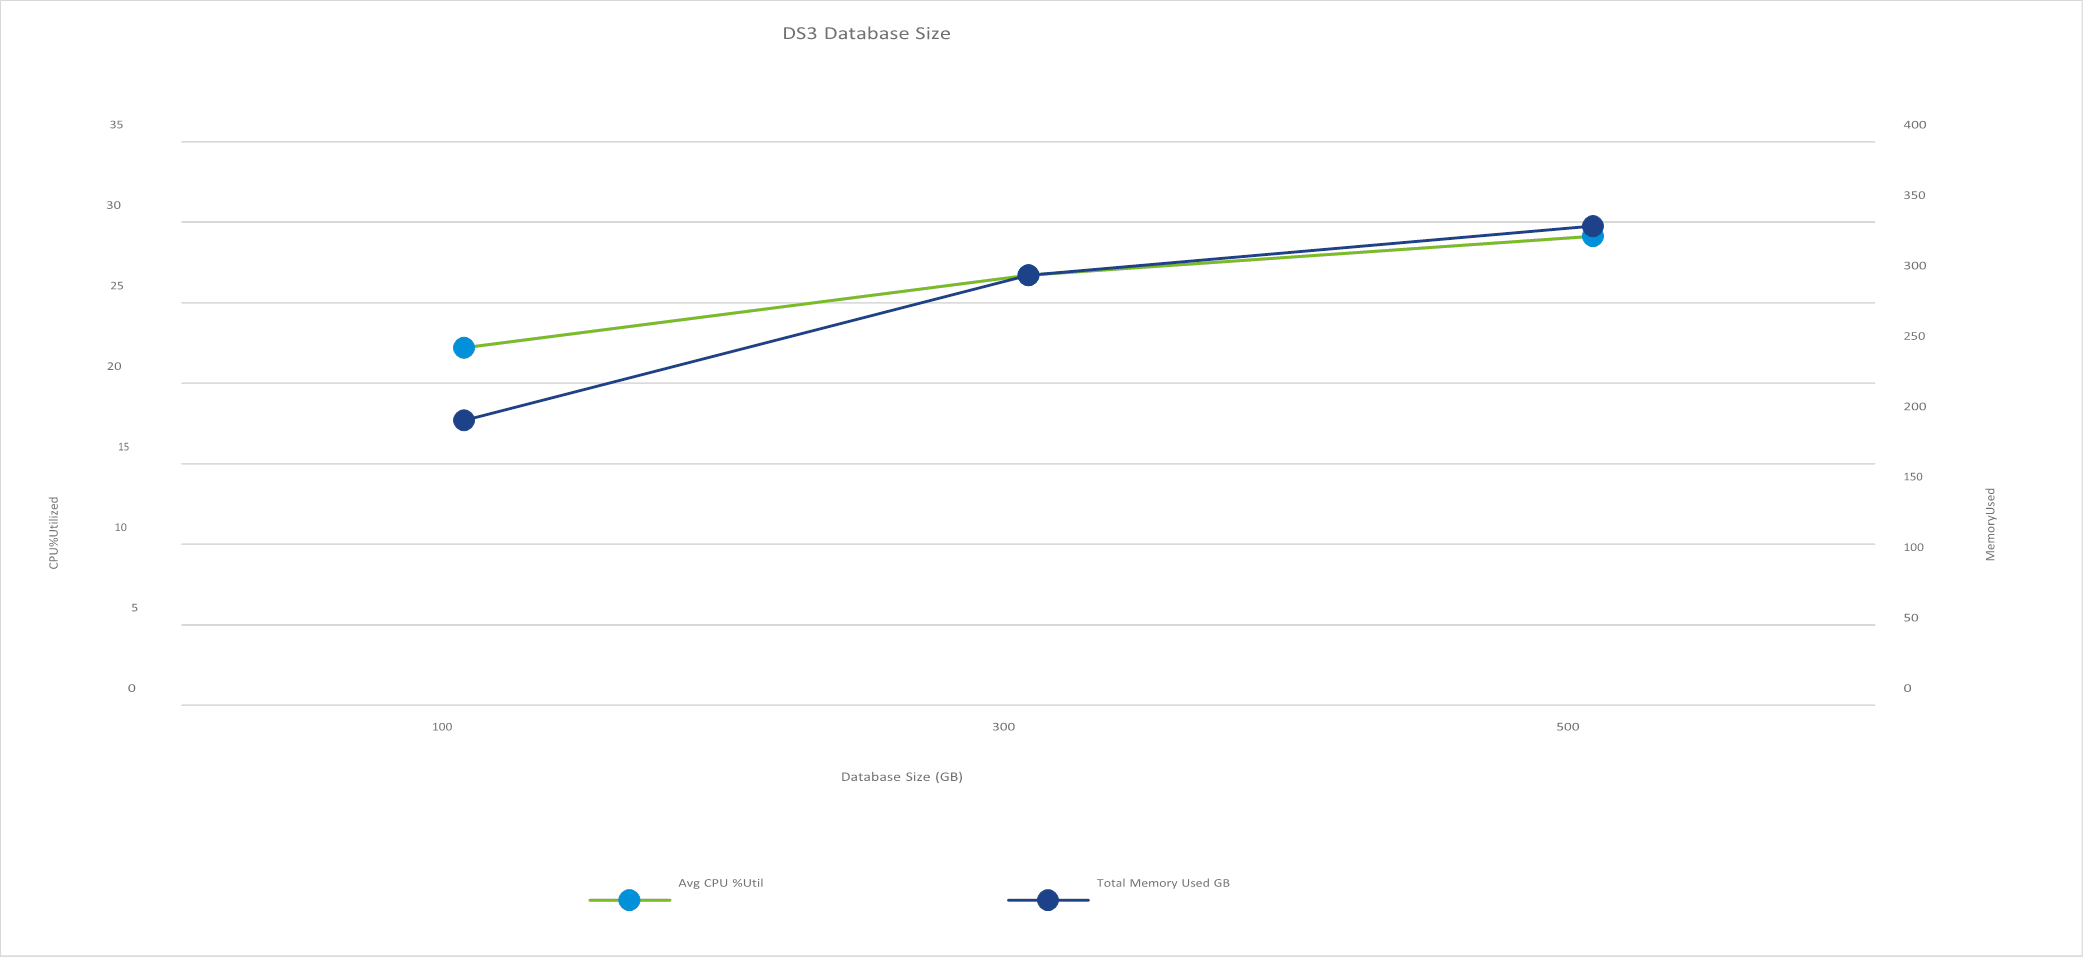
Figure 4. A 300 GB database size was a good balance between CPU utilization and memory use
The remaining parameters of Number of Searches, Batch Search Size, and Warm Up Time did not show an appreciable change in memory or CPU use. The final configuration that we determined to have the most increased memory usage while keeping the CPU utilization moderate was 250 GB DS3DB VM memory size, 1.5 seconds think time, and 300 GB database size. All other parameters were kept at their defaults.
Once we determined the optimal configuration, we performed tests on a 4-node vSAN cluster using the entire VMmark benchmark suite with the modified DVD Store workload. Table 2 lists the CPU and memory use of the default configuration and this optimal “increased memory” configuration.
|
Configuration |
CPU Utilization |
Memory Use |
|
Default |
26.3% |
126 GB |
|
Increased Memory |
24.1% |
350 GB |
Table 2. Using a large amount of memory decreased CPU utilization and made a significant amount of memory available to the VM
We have been able to almost triple the memory consumption of a single VMmark tile without increasing the CPU utilization. Using this “increased memory” configuration for VMmark, we can now see the performance impact of the additional memory provided by Intel Optane DC Persistent Memory in Memory Mode.
Increased Memory Cluster Performance
Using the “increased memory” VMmark configuration discussed in the previous section, we can now compare the performance of a vSAN cluster with standard DRAM to a cluster using Intel Optane DC Persistent Memory in Memory Mode. We configured two 4-host clusters identically except for the memory. Table 3 lists the configurations.
|
|
DRAM Cluster |
Intel Optane DC Persistent Memory Cluster |
|
Processor |
2x Intel Xeon Gold 6252 |
2x Intel Xeon Gold 6252 |
|
Memory |
384 GB DDR4 (12x 32 GB DIMM) |
128 GB DDR4 (8x 16 GB DIMM) 512 GB Intel DCPMM (4x 128 GB DCPMM) |
|
Storage |
Intel P4800X 375 GB x4 & Intel P4510 2 TB x4 |
Intel P4800X 375 GB x4 & Intel P4510 2 TB x4 |
|
NIC |
Intel XXV710 25 GbE |
Intel XXV710 25 GbE |
|
Hypervisor |
VMware ESXi™ 6.7 U2 |
VMware ESXi 6.7 U2 |
Table 3. Configuration of the two systems under test
Four hosts were configured as shown in Table 3 for each vSAN cluster. As a baseline, we ran the standard
VMmark benchmark on each cluster and saw no performance difference between the two. We then ran the
“increased memory” configuration VMmark benchmark on each cluster. The Intel Optane DC Persistent Memory cluster was able to pass quality of service (QoS) at 8 tiles, while the standard DRAM cluster was only able to pass QoS at 6 tiles. The following table shows the relative performance of each solution.
|
Test Case |
DRAM Cluster |
Intel Optane DC Persistent Memory Cluster |
|
Increased Memory VMmark Run |
1 @ 6 tiles |
1.24 @ 8 tiles |
Table 4. Relative performance of each system under test
View Planner 4.1: Heavy Memory Workload Profile
VMware View Planner is a benchmark used to compare virtual desktop infrastructure (VDI) consolidation on servers. However, its Standard Benchmark Workload Profile consumes less than 3 GB per VM, so we needed a new workload mix to consume the larger amounts of memory available with Intel Optane DC Persistent Memory technology. We chose to mimic a heavy internet user with a mix of applications from the Microsoft Office 2013 suite (Word, PowerPoint, and Excel) and the Chrome browser.
We modified the Chrome application workload in the standard profile to open tabs that navigate to popular internet sites like cnn.com, youtube.com, yahoo.com, and so on. Each new tab consumed additional memory, giving us a way to scale the memory exercised by the workload. We also scaled the number of VMs in the system to increase memory load.
The Chrome application was started in each VM, opening tabs at a fixed interval and interleaved with the Office workloads throughout the run. We aggregated the latency of the Office applications to determine quality of service (QoS). Because of the unpredictability of internet network delays and external site loads, the latency of the Chrome tab operation was not used to determine QoS.
To reduce the CPU load and stress the system memory, we dropped Outlook and the video applications from the mix. We also increased the think time between operations from 5 to 15 seconds.
Table 5 shows the difference between the Standard Benchmark Workload Profile and the Heavy Memory Workload Profile.
|
|
Standard Benchmark Workload Profile |
Heavy Memory Workload Profile |
|
Applications |
MS Office 2013 – Word, PowerPoint, Excel, Outlook Chrome Browser – Navigate Text Pages, Navigate Web Album Adobe Acrobat PDF Reader Windows Media Player – 720p Local Video |
MS Office 2013 – Word, PowerPoint, Excel Chrome Browser – Navigate Internet Sites |
|
Think Time |
5 seconds |
15 seconds |
|
Number of Iterations |
5 |
5 |
Table 5. We modified View Planner’s Standard Benchmark Workload Profile to create a Heavy Memory Workload Profile
Quality of Service in View Planner 4.1
The View Planner workload mix consists of multiple applications running in the desktop virtual machines and performing user operations. These user operations are separated into three groups, as shown in Table 6.
|
Group A |
Interactive, CPU-bound operations |
|
Group B |
I/O-bound operations |
|
Group C |
Long-running load operations |
Table 6. View Planner 4.1 user operations are separated into groups A, B, and C
The operations in Groups A and B are used to determine QoS, while the operations in Group C are used to generate additional load. QoS, determined separately for Group A user operations and Group B user operations, is the 95th percentile latency of all the operations in a group. The default thresholds are 1.0 second for Group A and 6.0 seconds for Group B [4].
Testbed Description
The DRAM and the DCPMM systems used in the test were identical except for the memory configuration. The DRAM system had 384 GB DDR4@2666MHz DRAM, while the DCPMM system was populated with 512 GB of DCPMM and 192 GB of DDR4@2666MHz DRAM and was configured in Memory Mode. Table 7 describes the two systems.
|
DRAM System |
Intel Optane DC Persistent Memory System |
|
|
Processor |
2x Intel® Xeon® Platinum 8280L Processor (2.7GHz, 28 cores, HT Enabled, Turbo Enabled) |
2x Intel® Xeon® Platinum 8280L Processor (2.7GHz, 28 cores, HT Enabled, Turbo Enabled) |
|
Memory |
384 GB addressable memory (192 GB per socket) 12x 32 GB DDR4 2666 MHz |
512 GB addressable memory (256 GB per socket) 4x 128 GB Intel DCPMM T1 Interleaved 12x 16 GB DDR4 2666 MHz |
|
Storage |
1x Intel SSD D5-P4320 Series (7.6 TB, 2.5 in) |
1x Intel SSD D5-P4320 Series (7.6 TB, 2.5 in) |
|
NIC |
10 GbE Intel X520 NIC |
10 GbE Intel X520 NIC |
Table 7. Configuration of DRAM vs. Intel Optane DC Persistent Memory systems under test
Since we ran the DCPMM in Memory Mode, no change was needed in the guest operating system or at the application level. The VDI VMs used in both systems were identical. The swap file in the VMs was set to 1x vRAM; that is, 12 GB. The configuration of the VDI VMs is detailed in Table 8.
|
Guest Operating System |
Microsoft Windows 10 Enterprise (version 1803), OS build 17134.1 |
|
Number of vCPU Cores |
4 |
|
Memory Capacity |
12 GB |
|
Applications Installed |
Google Chrome: Version 73.0.3683.103 (Official Build) (64 bit) Microsoft Office Professional Plus 2013 |
|
VMDK Size |
32 GB (thick-provisioned lazy zeroed) |
|
Paging File Size |
12 GB |
Table 8. Configuration of the VDI VMs
Single Host VM Consolidation Performance
When we scaled the number of VMs on the host from 45 to 60, we observed higher memory use, higher ballooning (which caused higher guest swapping), and even some limited host swapping. The memory pressure and disk activity lead to higher latency of View Planner’s I/O-bound operations (Group B). As the number of VMs was scaled up, tests failed the Group B QoS threshold of 6 seconds. There was a negligible impact on the latency of the CPU-bound operations (Group A) in this experiment.
Figure 5 shows Group B latency for the systems under test.
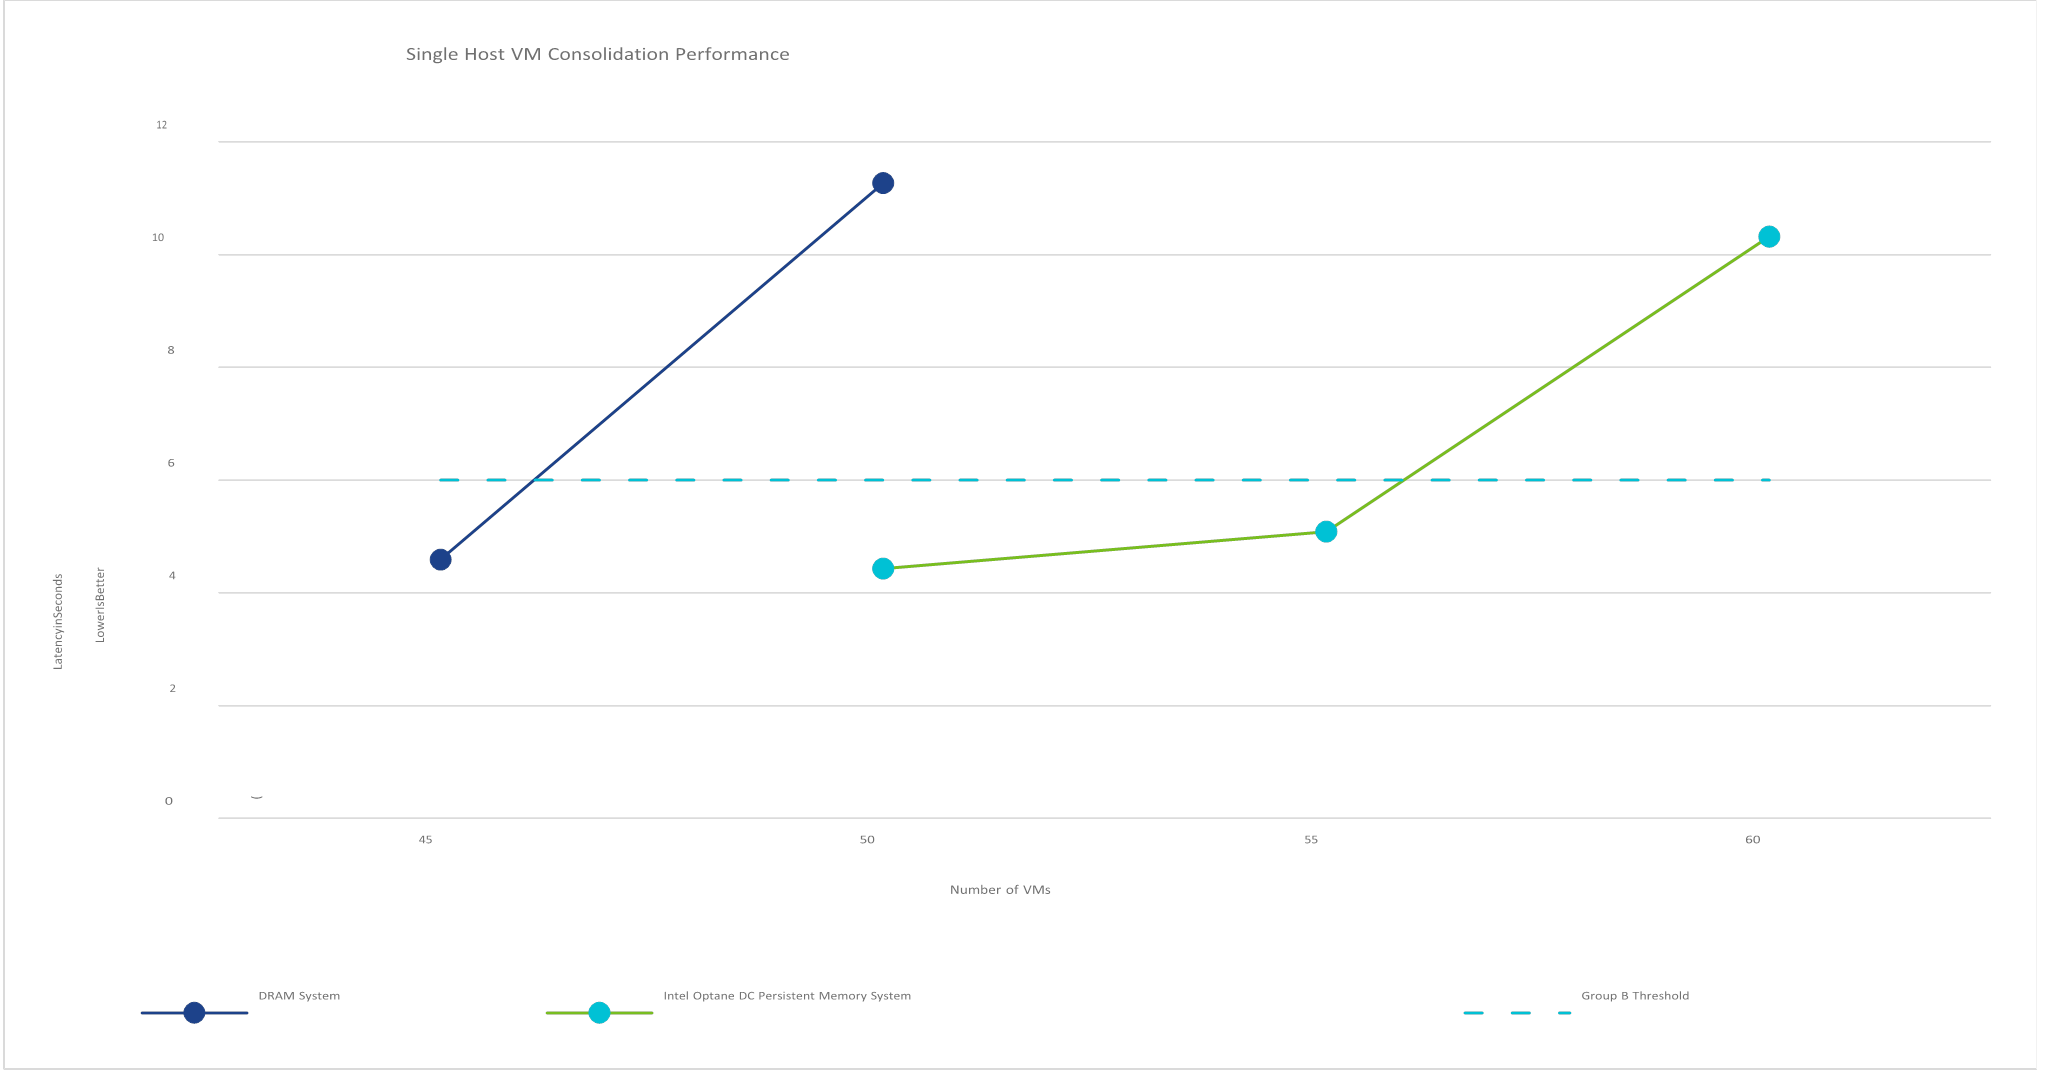
Figure 5. Performance of the DRAM and DCPMM systems; anything above the 6-second Group B threshold is a QoS failure
The DRAM systems failed Group B QoS threshold of 6 seconds at the 50-VM load, thus the DRAM system successfully ran 45 View Planner 4.1 Heavy Memory Workload Profile VMs. Similarly, the Intel Optane DC
Persistent Memory system failed the QoS threshold at 60 VMs, thus the system successfully ran 55 View Planner 4.1 Heavy Memory Workload Profile VMs, a 22% improvement in consolidation over the DRAM system.
Memory-Intensive Enterprise Java Workload
Our next goal was to determine the effect of Intel Optane DC Persistent Memory’s increased latency. We chose a very memory-intensive enterprise Java workload that is highly sensitive to latency. We used a 1socket system in the configurations detailed in Table 9.
|
Processor |
1x Intel Xeon Platinum 8260L |
|
Standard Memory Configuration |
384 GB DDR4 |
|
Persistent Memory Configuration |
96 GB DDR4 768 GB Intel Optane DC Persistent Memory |
Table 9. Configurations of the system under test
The persistent memory configuration used DCPMM in Memory Mode. The 96 GB of DRAM thus acted as a cache for the 768 GB of DCPMM. The standard memory configuration used 384 GB of DRAM memory.
We wanted to see what the performance would be if the application was forced to access the DCPMM directly due to a very high percentage of DRAM cache misses. We performed three experiments to test this, as detailed in Table 10.
|
|
Experiment 1 |
Experiment 2 |
Experiment 3 |
|
Number of VMs |
1 |
1 |
16 |
|
vCPUs per VM |
16 |
16 |
8 |
|
Memory Size per VM |
60 GB |
220 GB |
40 GB |
|
VM OS |
Fedora 28 |
Fedora 28 |
Fedora 28 |
|
Java Heap Size |
50 GB |
180 GB |
30 GB |
Table 10. Experiments performed on persistent memory configuration
Experiments 1 and 2 used a single VM running the workload with varying heap sizes. Experiment 1 used a heap size of 50 GB, which is smaller than the 96 GB DRAM cache size of the persistent memory system. Experiment 2 used a heapsize of 180 GB; this is nearly twice the size of the DRAM cache, thus causing a large number of memory accesses to be made directly from the persistent memory.
The results of the two experiments can be seen in Figure 6. The throughput of the workload is normalized to the performance of the DRAM system.
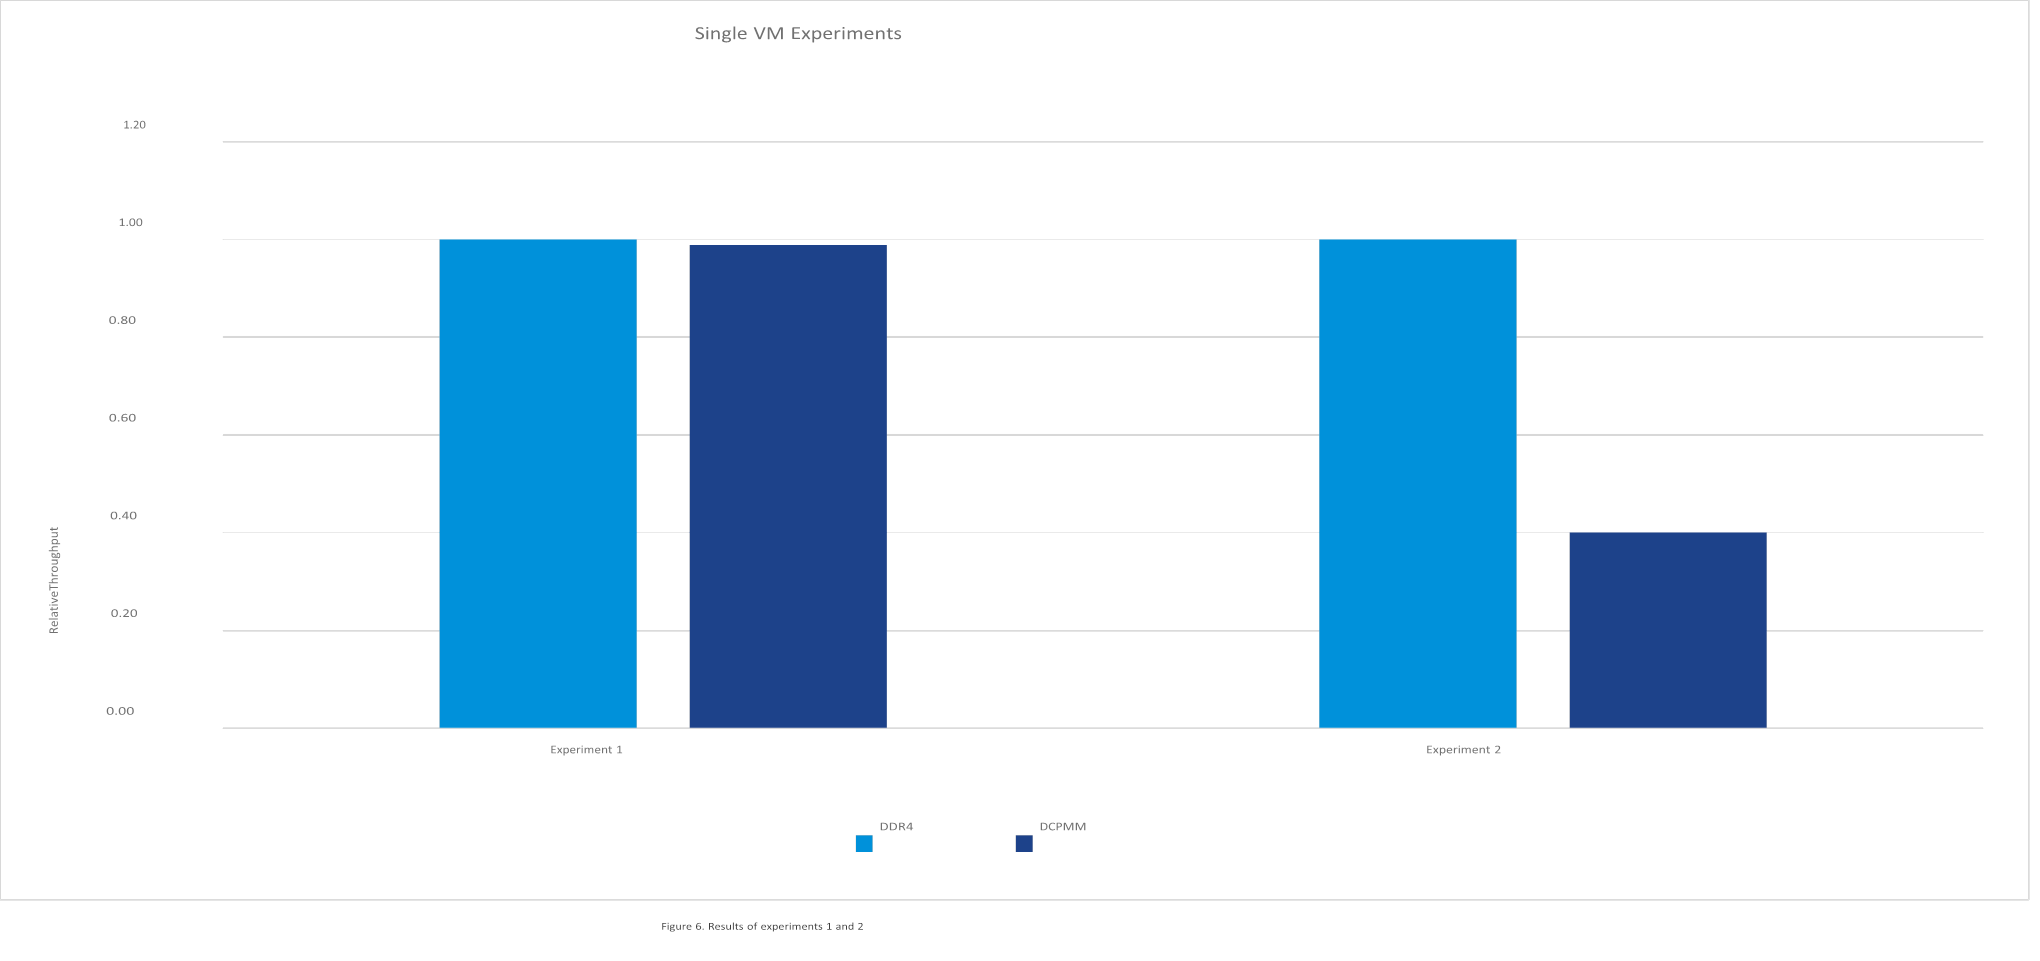
Experiment 1, which used a 50 GB heap size, had equivalent performance between the two configurations. This was expected behavior because most of the memory accesses were to the DRAM cache of the DCPMM configuration. Experiment 2, which used a 180 GB heap size, showed a 60% reduction in performance. The higher latency of the DCPMM impacted the performance of the workload in this scenario.
We used Experiment 3 to test the behavior of multiple VMs competing for the DRAM cache. We configured 16 VMs with 30 GB heap sizes. As a first step, we ran each VM sequentially. Figure 7 shows that, while there were minor variations in the performance, it was approximately equivalent across all VMs.
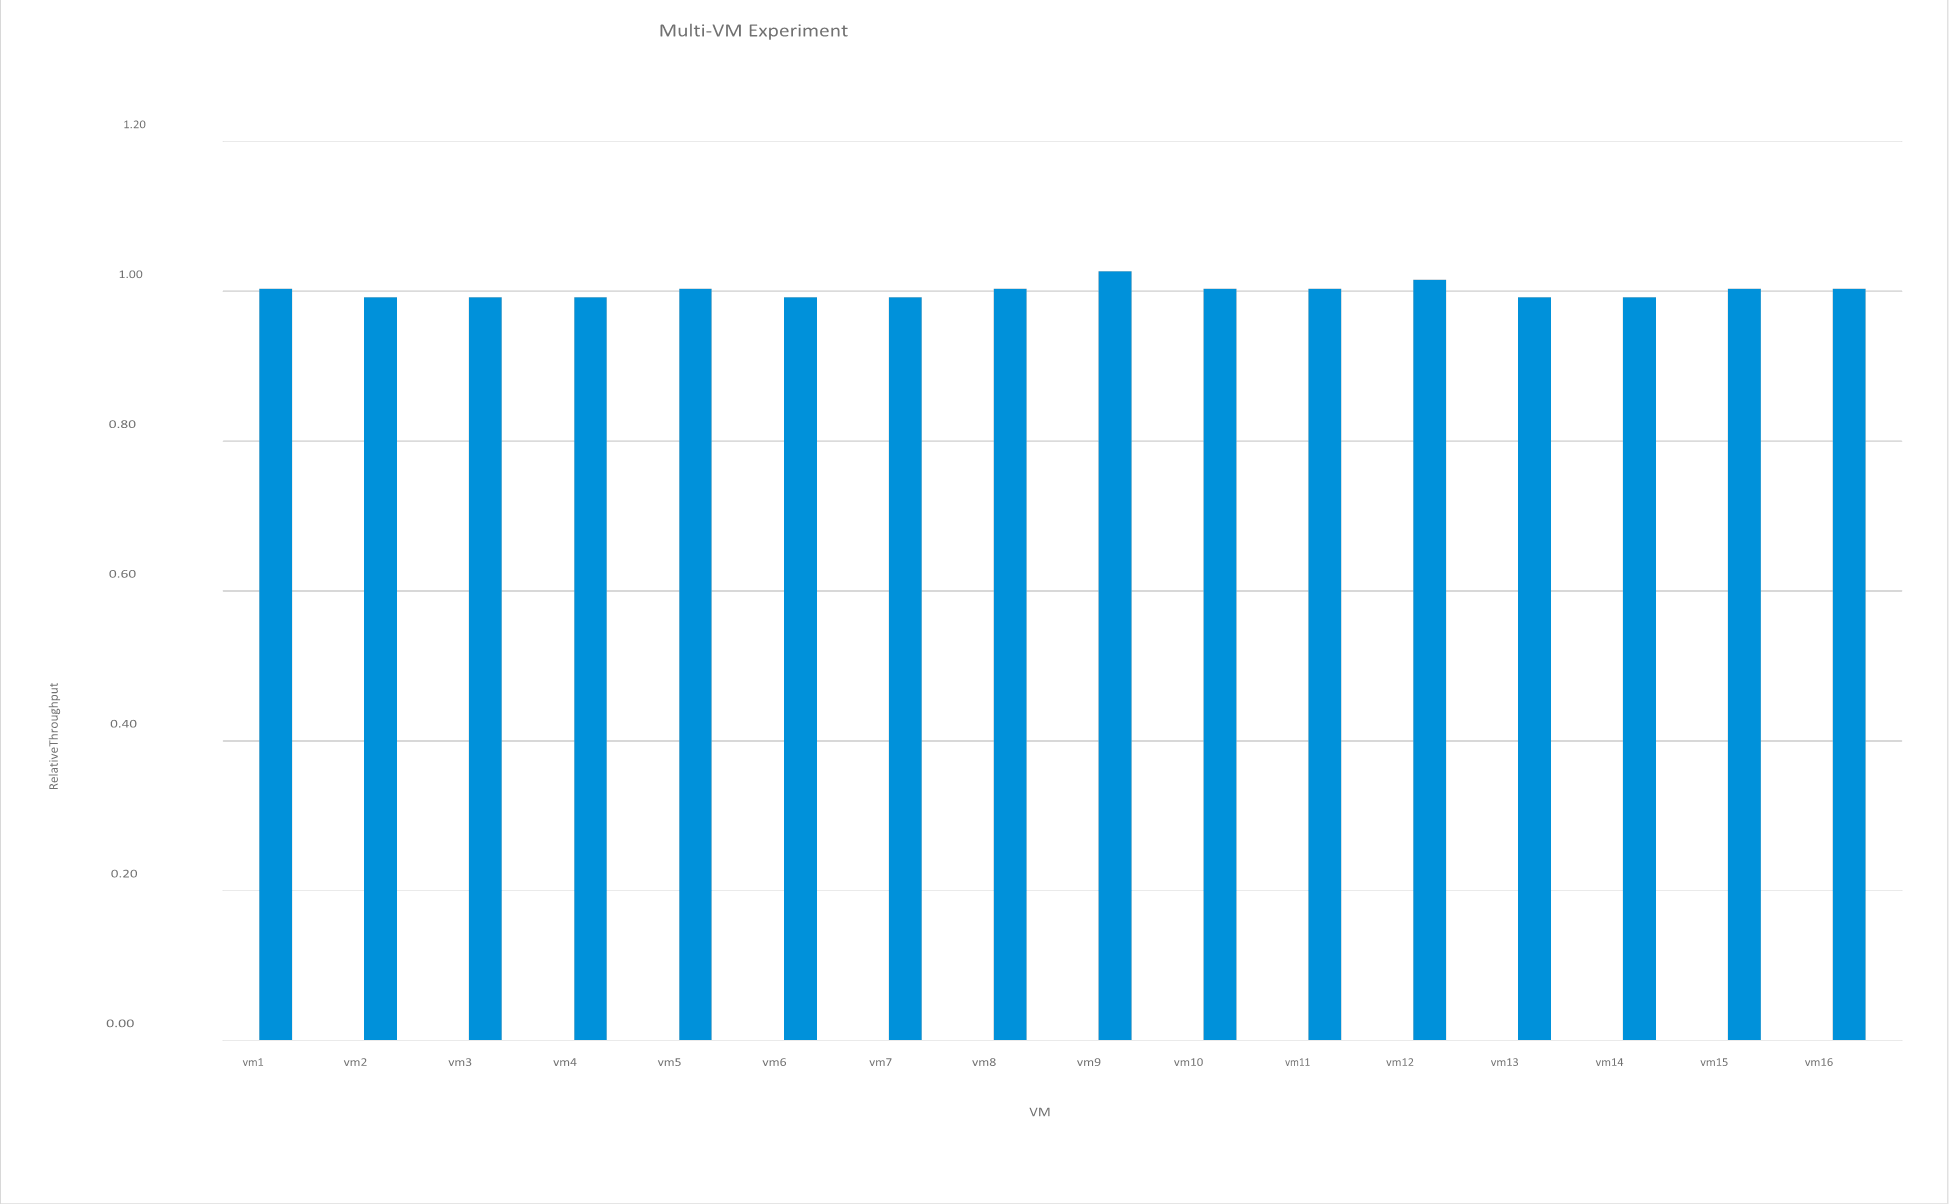
Figure 7. Relative performance across VMs—there are only minor variations
Next, we randomly chose pairs of VMs and ran them together. Since each VM used a 30 GB heapsize, two VMs would be expected to use 60 GB of the DRAM cache. We would therefore assume that the performance would be equivalent across all tests. However, as we see in Figure 8, there was an anomaly with one of the VM pairs.
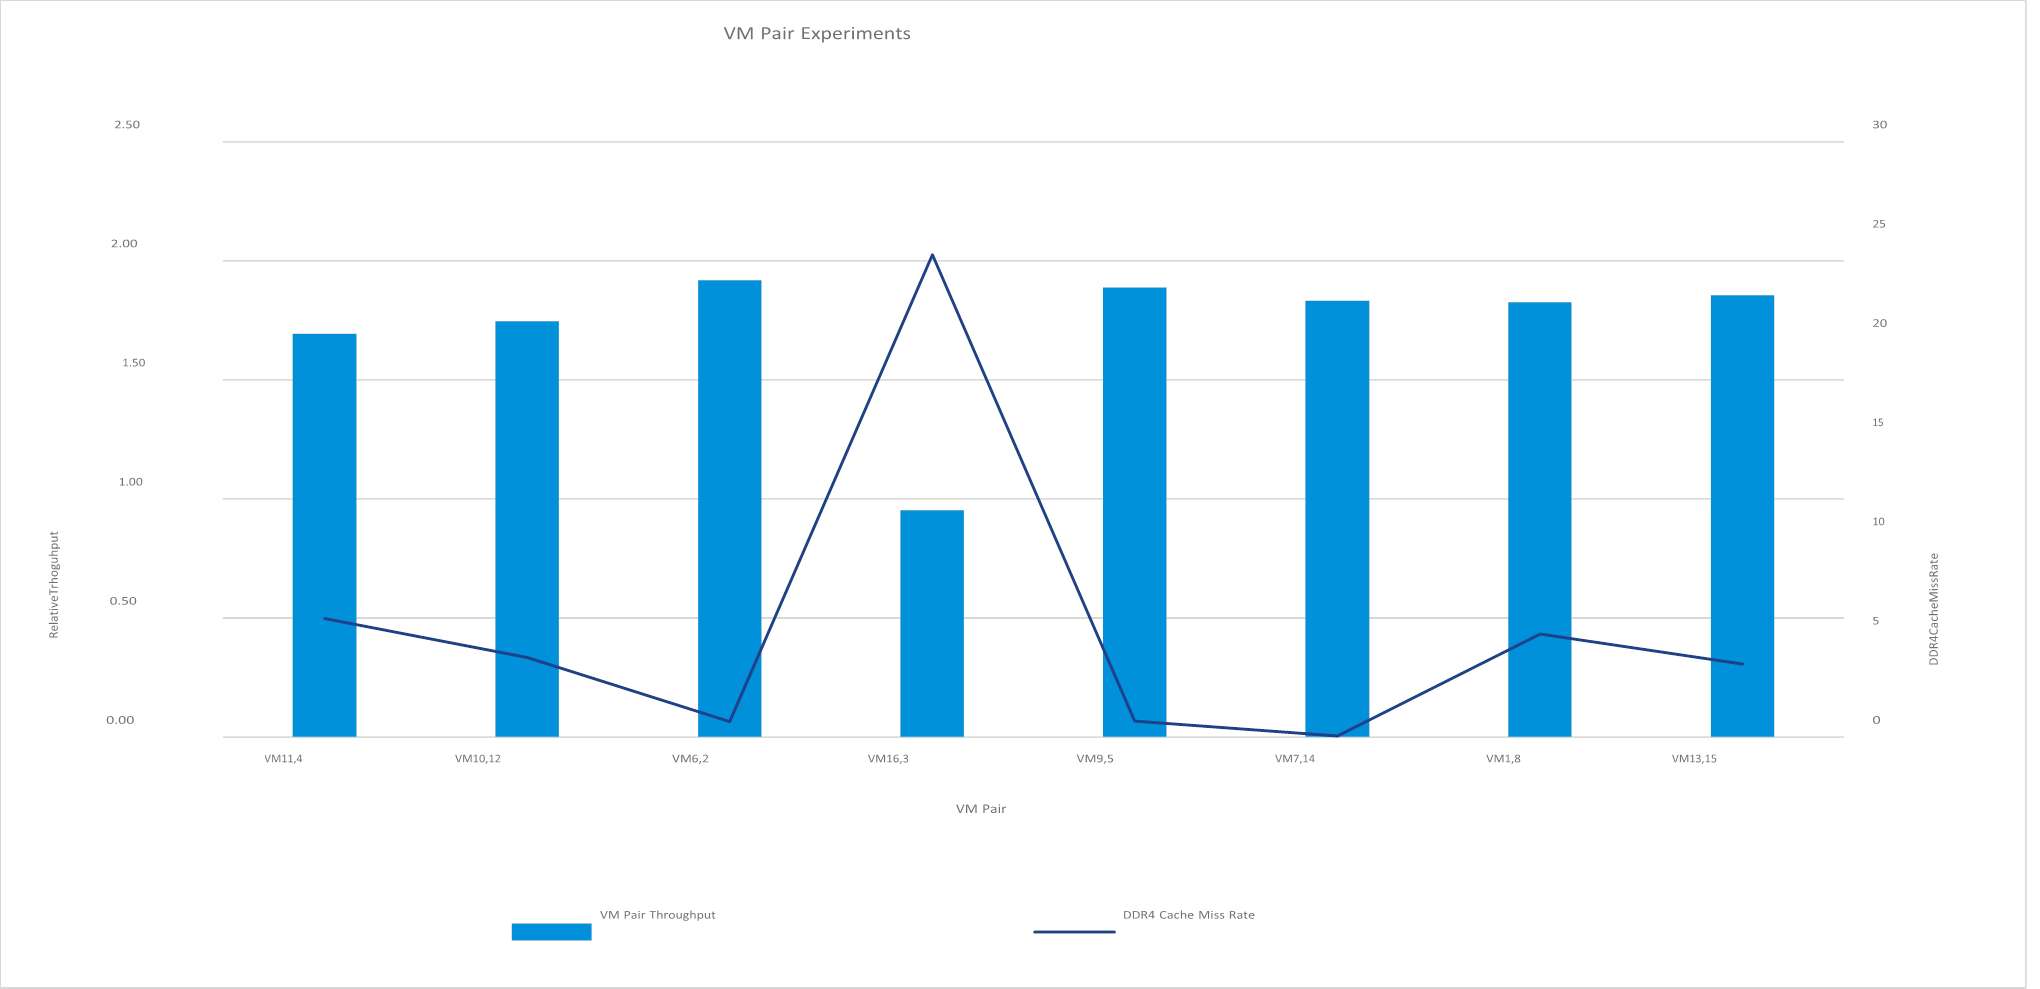
Figure 8. VM pair 16,3 shows substantially decreased performance
VM pair 16,3 consistently showed nearly half the performance of the other VM pairs. The cause was the much higher DRAM cache miss rate, as seen in the graph. The reason for this anomaly can be attributed to the nature of a direct map cache. As each VM is powered on, ESXi linearly allocates memory pages to it. Because the DRAM cache size is 96 GB, the memory map to the cache is repeated every 96 GB, so multiple memory addresses reference the same DRAM cache address. VMs 16 and 3 were being assigned memory addresses that reference the same cache addresses and had to compete for the same cache; this resulted in a decrease in performance as more calls were forced to be served directly from the persistent memory.
This experiment shows one possible issue that can occur with this type of memory. The enterprise Java application workload we used is very sensitive to memory latency, which will amplify any performance issues that can occur. One way we could mitigate the issue would be to increase the size of the DRAM cache. The experiments with the increased memory VMmark did not see these performance issues because there was sufficient DRAM cache to handle the demands of that workload.
VMmark 3.1 with Memory-Intensive “Noisy Neighbor”
Many applications are not particularly sensitive to memory latency. We used VMmark 3.1 without the infrastructure operations to examine what happens when these less-sensitive applications are pushed out of the DRAM cache. Table 11 shows the system configuration we used for this experiment.
|
Platform |
Intel 2600WFT |
|
Processor |
2x Intel Xeon Platinum 8260L |
|
Memory |
384 GB DDR4 (12x 32 GB DIMM) 3 TB Intel Optane DC Persistent Memory (12x 256 GB DCPMM) |
|
Storage |
3x Dell PM1725a 1.6 TB NVMe |
Table 11. Configuration of the system under test
This system can support three standard VMmark 3.1 tiles. The total memory used by a single tile is 158 GB; that memory isn’t 100% active, however, so the majority of memory accesses should be fulfilled from the DRAM cache. We used two memory-intensive applications in separate VMs to fill the DRAM cache and force the VMmark VMs to directly access DCPMM. The applications were configured to use a fixed amount of memory. We used a similar configuration as the previous test; however, we limited the VMs to 8 vCPUs to reduce the impact on CPU resources. The 2 VMs used at most 10% of the total CPU resources of the system. Two VMs were used so that the ESXi scheduler would be able to place an equal memory load on each socket. The normalized VMmark application scores are shown in table 12.
|
Test Case |
Baseline |
W/ 2x 100 GB memory intensive application |
W/ 2x 160 GB memory intensive application |
W/ 2x 320 GB memory intensive application |
|
1-tile |
1 |
0.98 (-2%) |
0.99 (-1%) |
0.93 (-7%) |
|
2-tile |
1.92 |
1.87 (-2.3%) |
1.85 (-3.8%) |
1.80 (-6.3%) |
|
3-tile |
2.63 |
2.38 (-9.5%) |
2.37 (-9.9%) |
2.17 (-17.5%) |
Table 12. Normalized application scores for VMmark with memory intensive noisy neighbor experiments
Up to a 3% performance variation is normal for VMmark 3.1. The 1-tile and 2-tile tests don’t show a substantial impact when running with the 100 GB and 160 GB sized application. The 3-tile test does show a 10% impact, most likely due to an increase in CPU contention as the memory-intensive VMs are using around 10% of the CPU. The 320 GB size test case shows a more significant impact. When running this configuration, the memory-intensive application VMs are able to fill a majority of the DRAM cache. We see a 7% and 6.3% impact at 1-tile and 2-tiles, respectively. These two test cases are actually fairly similar. Each tile has an equal workload; as a result, the ESXi scheduler will attempt to spread the VMs equally across the 2 sockets. Since each socket is equally impacted by the memory-intensive VMs, we would expect to see an equal impact on each tile. The 3-tile case is seeing more impact as one of the tiles is forced to be spread across both sockets.
As we see in this experiment, a memory-intensive application, despite using a small percentage of the overall CPU, can have a dramatic impact on the performance of other workloads. Carefully consider workload placement in virtualized environments to avoid this issue.
Conclusion
We examined the performance of Intel Optane DC Persistent Memory. Using DCPMM in Memory Mode, we can configure a server with 33% more memory than with a DRAM-only server. We were able to increase the memory footprint of the VMmark 3.1 benchmark by modifying it to fully utilize this extra memory. Using this modified “increased memory” configuration of VMmark, we have shown that we were able to achieve 25% higher density and 18% higher throughput on a similarly configured cluster with Intel Optane DC Persistent Memory. The VDI experiments have shown an increase in VM density of 22%. We also found that memoryintensive applications can have their performance impacted in certain scenarios due to the higher latency of this new memory technology. These types of applications will require careful planning to ensure that the DRAM cache is properly sized. We also found that a memory-hungry “noisy neighbor” can have an impact on performance in some situations.
References
[1] VMware, Inc. (2019) VMmark. https://www.vmware.com/products/vmmark.html
[2] VMware, Inc. (2019) View Planner. https://www.vmware.com/products/view-planner.html
[3] VMware, Inc. (2019, April) Persistent Memory Performance in vSphere 6.7 with Intel Optane DC Persistent Memory.
https://www.vmware.com/content/dam/digitalmarketing/vmware/en/pdf/techpaper/performance/optane-dcpmem-vsphere67-perf.pdf
[4] VMware, Inc. (2018, November) Understanding VMware View Planner Reports. https://blogs.vmware.com/performance/2020/09/understanding-view-planner-report.html
About the Authors
James Zubb is a staff engineer in the Performance division of VMware. He has 10+ years of experience in performance engineering and benchmark development. He has contributed to the development of the VMmark benchmark since its initial release.
Milan Potdar is a software development engineer with Intel Corporation supporting performance optimization, benchmarking, and launch collateral for Intel Platforms. She is currently focused on Intel Optane DC Persistent Memory performance on the VMware stack. Milan holds a master’s degree in Computer Science from San Jose State University, CA, USA with 4 years of work experience in various domains of computer science and engineering.
Aravind Bappanadu is a senior manager in the Performance division of VMware. His team specializes in optimizing enterprise application performance like VDI, EDM, and blockchain. He has 10+ years of performance engineering experience in VDI, DR, and benchmark development.
Atul Pandey is a senior engineer in the Performance division of VMware. He develops benchmarks and tools focused on measuring VDI performance at scale. Prior to VMware, he had experience with device drivers, firmware development, and storage arrays. Atul holds a bachelor’s degree in Computer Science from the University of Rajasthan, India.
Vishal Verma is a performance engineer within Intel’s DCG group. He has worked on performance testing and analysis on several storage software stacks such as vSAN, Ceph, and Swift, and is currently responsible for the performance analysis of virtualized desktop infrastructure (VDI) workloads. Vishal did his B.Tech in Electronics & Communication from GGSIP University in Delhi, India and M.S. in Electrical Engineering from Arizona State University.
Acknowledgements
This paper was made possible with the help of the VMware and Intel Performance engineering teams.