
Running Dask on AI-Ready Enterprise Platform on VMware vSphere 7 with VMware Tanzu Kubernetes Grid Service
Executive Summary
This solution provides general design and deployment guidelines for running Dask on AI-ready enterprise platform on VMware vSphere 7 with VMware Tanzu Kubernetes Grid Service. It illustrates how Dask can be deployed, configured, and used with other applications such as PyTorch or RAPIDS on VMware vSphere 7 with VMware Tanzu Kubernetes Grid Service with GPU access empowered by NVIDIA Artificial Intelligence Enterprise (NVAIE) 1.1, it also provides best practices to help customers and partners to design and plan the solution upfront.
It is showcased in this paper running on Dell VxRail. The reference architecture applies to any compatible hardware platforms running Tanzu Kubernetes Grid.
Technology Overview
VMware Tanzu Kubernetes Grid
VMware Tanzu Kubernetes Grid provides organizations with a consistent, upstream-compatible, regional Kubernetes substrate that is ready for end-user workloads and ecosystem integrations. You can deploy Tanzu Kubernetes Grid across software-defined datacenters (SDDC) and public cloud environments, including vSphere, Microsoft Azure, and Amazon EC2.
Tanzu Kubernetes Grid provides the services such as networking, authentication, ingress control, and logging that a production Kubernetes environment requires. It can simplify operations of large-scale, multi-cluster Kubernetes environments, and keep your workloads properly isolated. It also automates lifecycle management to reduce your risk and shift your focus to more strategic work.
This document describes the use of VMware Tanzu Kubernetes Grid service to support machine learning workloads that are distributed across the nodes and servers in the cluster, with high-speed networking and GPUs for higher performance and resilience.
VMware vSAN
VMware vSAN is the industry-leading software powering VMware’s software defined storage and Hyperconverged Infrastructure (HCI) solution. vSAN helps customers evolve their data center without risk, control IT costs, and scale to tomorrow’s business needs. vSAN, native to the market-leading hypervisor, delivers flash-optimized, secure storage for all of your critical vSphere workloads and is built on industry-standard x86 servers and components that help lower TCO in comparison to traditional storage. It delivers the agility to scale IT easily and offers the industry’s first native HCI encryption.
vSAN simplifies Day 1 and Day 2 operations, and customers can quickly deploy and extend cloud infrastructure and minimize maintenance disruptions. vSAN helps modernize hyperconverged infrastructure by providing administrators a unified storage control plane for both block and file protocols and provides significant enhancements that make it a great solution for traditional virtual machines and cloud-native applications. vSAN helps reduce the complexity of monitoring and maintaining infrastructure and enables administrators to rapidly provision a file share in a single workflow for Kubernetes-orchestrated cloud native applications.
See VMware vSAN doc and VMware vSAN 7.0 Update 3 Release Notes for more information.
Dell VxRail
The only fully integrated, pre-configured, and pre-tested VMware hyperconverged integrated system optimized for VMware vSAN and VMware Cloud Foundation™, VxRail provides a simple, cost effective hyperconverged solution that solves a wide range of operational and environmental challenges and supports almost any use case, including tier-one applications, cloud native and mixed workloads. Powered by next generation Dell PowerEdge server platforms and VxRail HCI System Software, VxRail features next-generation technology to future proof your infrastructure and enables deep integration across the VMware ecosystem. The advanced VMware hybrid cloud integration and automation simplifies the deployment of secure VxRail cloud infrastructure.
Dask
Dask is a parallel computing library that scales the existing Python ecosystem and is open source. It is developed in coordination with other community projects like NumPy, pandas, and scikit-learn. Dask provides multi-core and distributed parallel execution on larger-than-memory datasets. See Dask website for more information.
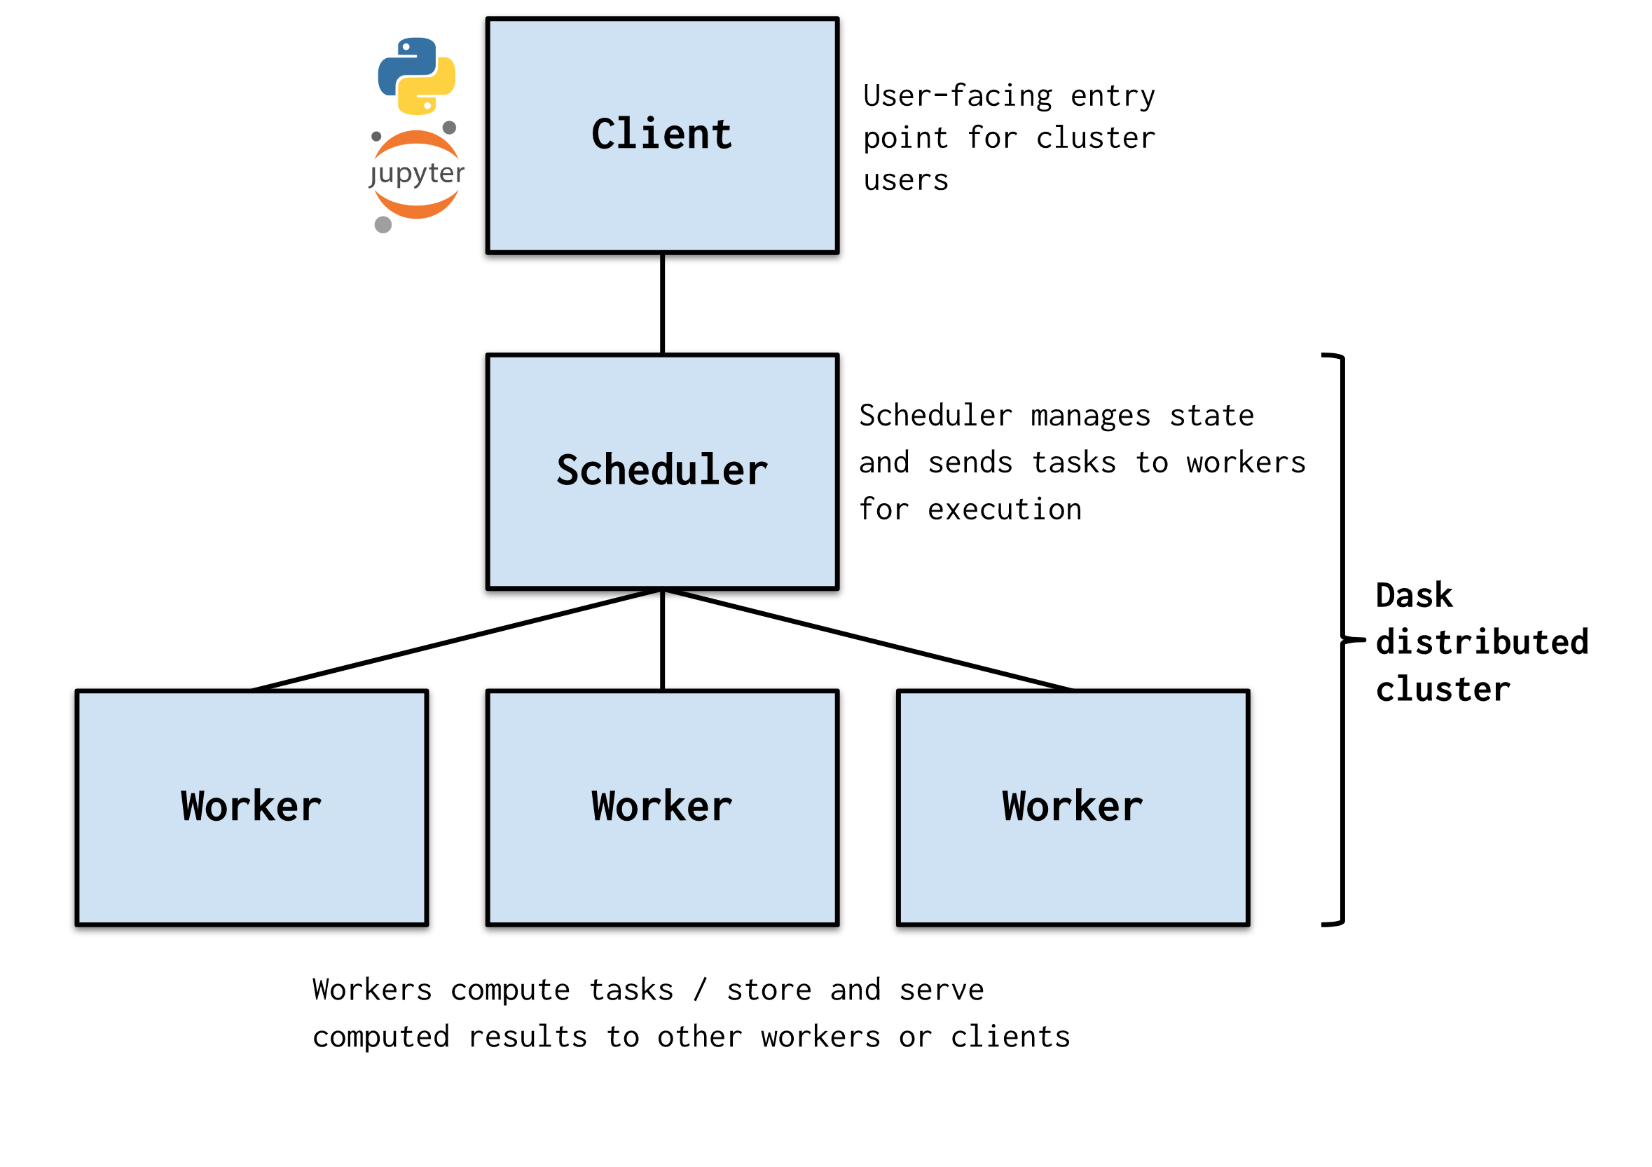
Figure 1 Dask Cluster Architecture
Solution Configuration
In this solution, we demonstrated that an application hosted on Dask works well on a virtualized distributed platform based on VMware vSphere and the NVIDIA AI Enterprise Suite of software - with high-speed networking and GPUs included. We wanted to validate all the components of the solution working together to give a better result for a customer solution.
The deployment and configuration script can be found on Github.
Hardware Resources
In this solution, we used four VxRail P670F servers. The following table shows the hardware components of each server.
Table 1 Hardware Resources - Dell VxRail P670F
|
PROPERTY |
SPECIFICATION |
|
Server Model |
Dell VxRail P670F |
|
CPU |
2 x Intel(R) Xeon(R) Gold 6330 CPU @ 2.00GHz, 28 core each |
|
RAM |
512GB |
|
Network Resources |
1 x Intel(R) Ethernet Controller E810-XXV, 25Gbit/s, dual ports 1 x NVIDIA ConnectX-5 Ex, 100Gbit/s dual ports |
|
Storage Resources |
1 x Dell HBA355i disk controller 2 x P5600 1.6TB as vSAN Cache Devices 8 x 3.84TB Read Intensive SAS SSDs as vSAN Capacity Devices |
|
GPU Resources |
1 x NVIDIA Ampere A100 40GB PCIe |
Software Resources
Table 2 Software Resources
|
Software |
Version |
|
VxRail HCI System Software |
7.0.320 |
|
vSphere |
7.0 update 3c |
|
Tanzu Kubernetes Release |
v1.20.8+vmware.1 |
|
NVAIE |
1.1 |
|
RAPIDS |
21.10 |
|
Dask |
2021.09.1 |
|
PyTorch |
torch: 1.10.1+cu113, torchvision: 0.11.2+cu113, torchaudio: 0.10.1+cu113 |
|
Helm |
3.7.2 |
Architecture Design
The Tanzu Kubernetes cluster was provisioned on top of vSphere consisting of ten worker nodes, where each node is implemented as a virtual machine. Eight of the worker nodes were equipped with a vGPU for the Dask Worker pod deployment. The other two worker nodes, that did not have a vGPU associated with them, were used for the Dask Scheduler and the Jupyter Notebook. The NVIDIA GPU operator v1.9.1 was installed in the Tanzu Kubernetes cluster to allow users to manage the GPU nodes in the cluster. The Dask cluster was also deployed into the Tanzu Kubernetes cluster as a set of pods and configured with one persistent volume from vSAN file service across all the Dask worker pods.
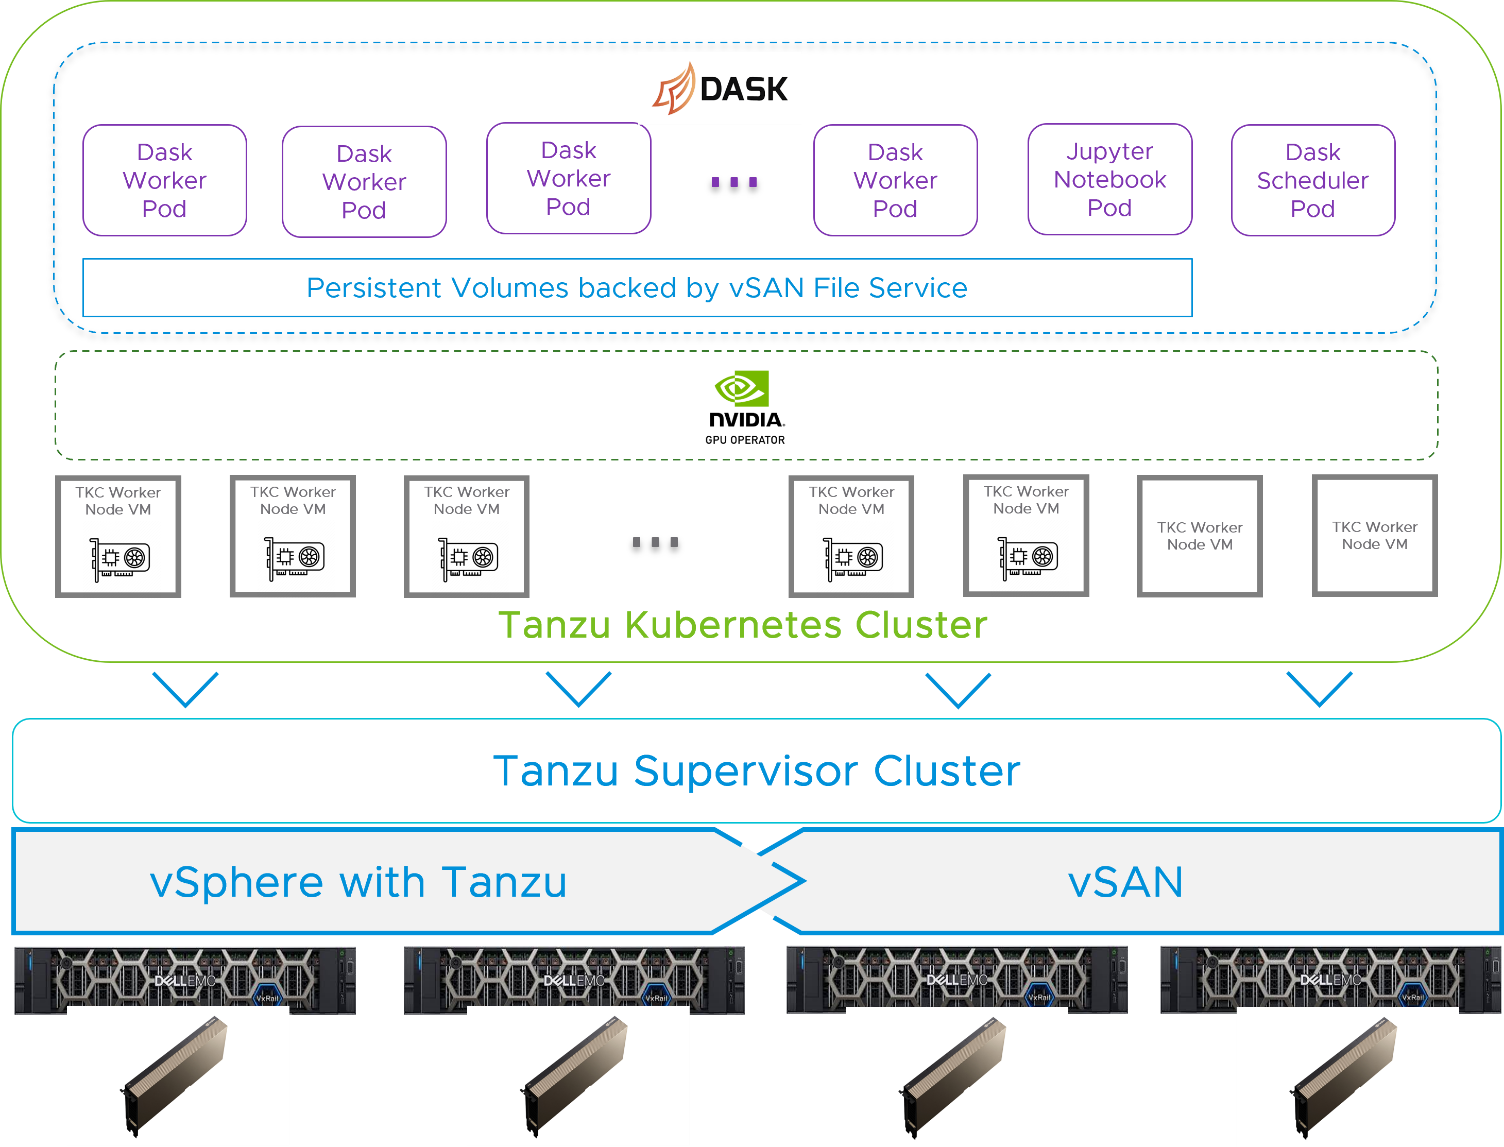
Figure 2 Solution Architecture
Network Design
The Intel 25GbE NICs were used for vSphere management, vMotion, vSAN, and the Tanzu Kubernetes Grid management network. The NVIDIA ConnectX-5 100GbE NICs were used for the vSAN file service and the Tanzu Kubernetes Grid workload network. In this case, the Dask cluster was physically separated from the management and vSAN network. The Dask cluster used the higher network bandwidth supported by the ConnextX-5 NICS for both node-to-node interactions and read or write data on the vSAN file share.

Figure 3 Networking Design
Solution Validation
In this validation section, we introduced the monitoring tools and testing tools, and showcased the scenarios from both vSphere admin and developer perspectives. In addition, we provided two machine learning samples.
Tools and Platforms Used in the Validation
Monitoring Tools
Dask Dashboard
Dask provides a diagnostics dashboard where you can see your tasks as they are processed. See Diagnostics (distributed) to learn more about these graphs.
vSAN Performance Service
vSAN Performance Service is for monitoring the performance of the vSAN environment and helping users to investigate potential problems. The performance service collects and analyzes performance statistics and displays the data in a graphical format. You can use the performance charts to manage your workload and determine the root cause of problems.
Testing Tools
XGBoost
XGBoost is an optimized distributed gradient boosting library designed to be highly efficient, flexible, and portable. It implements machine learning algorithms under the Gradient Boosting framework. XGBoost provides a parallel tree boosting (also known as GBDT, GBM) that solves many data science problems quickly and accurately.
RAPIDS
The RAPIDS suite of open-source software libraries and APIs, developed by NVIDIA and supported in the NVIDIA AI Enterprise Suite, allows you to execute end-to-end data science and analytics pipelines entirely on GPUs.
RAPIDS also focuses on common data preparation tasks for analytics and data science. This includes a familiar dataframe API that integrates with a variety of machine learning algorithms for end-to-end pipeline accelerations without paying typical serialization costs. RAPIDS also includes support for multi-node, multi-GPU deployments, enabling vastly accelerated processing and training on much larger dataset sizes.
PyTorch
PyTorch is a popular open-source machine learning framework that accelerates the path from research prototyping to production deployment.
vSphere Administrative Tasks
In this solution, a vSphere cluster should be pre-configured with vSAN enabled, and the ESXi hosts in the cluster should have NVIDIA GPUs installed.
The vSphere administrator is responsible for preparing the environment with the following configuration aspects:
Enable vGPU on ESXi Hosts
vSphere administrator can follow this article to install the NVIDIA Virtual GPU manager from NVAIE 1.1 package and enable vGPU support on the ESXi hosts.
Configure Tanzu Kubernetes Grid Service with vGPU access
To configure Tanzu Kubernetes Grid service with vGPU access, the vSphere administrator should first enable Workload Management in the vSphere Client, create the Supervisor Cluster and Content Library that is subscribed to https://wp-content.vmware.com/v2/latest/lib.json, create the VM Classes with vGPU access and create a new Namespace with the VM Classes configured with vGPU. Visit here for more detail on the procedures and steps involved in this section.
In this solution, we configured the Tanzu Supervisor Cluster with haproxy v0.2.0 for load balancing. We added the pre-defined best-effort-medium, best-effort-large, and best-effort-2xlarge VM Classes to the Namespace. To allow the worker nodes to have vGPU access, we created and added a VM Class (named 16cpu-64gram-ts-20c-vmxnet3) with the following specifications to the Namespace:
- 16 vCPU
- 64GB RAM
- 1 NVIDIA A100 vGPU with 20c in time sharing mode. (Rapidsai images do not support Multi-Instance GPU (MIG) when we conducted the test https://github.com/rapidsai/dask-cuda/issues/583)

Figure 4 VM Class Details
From the storage perspective, we added two vSAN storage policies to the Namespace, one is vsan-r5 that is with RAID 5 configured to reduce the storage consumption while maintaining good performance, another is vsan-r1-sw8 that is configured with RAID 1 and StripeWidth=8 to maximize the performance for the Tanzu Kubernetes cluster worker nodes.
Configure vSAN File Service for Network File System (NFS)
Most machine learning platforms need a data lake, a centralized repository to store all the structured and unstructured data. With vSAN file service, the Tanzu Kubernetes cluster can be configured with an NFS-backed ReadWriteMany persistent volume across the pods to store the data. In this solution, the size of the NFS file share provided by vSAN file service is 2TB. The storage policy is configured with RAID 1 with StripeWidth=8 to guarantee the best performance by distributing the data across all the vSAN disk groups while not compromising data resiliency. For more information regarding vSAN file service, visit here.
Developer Tasks
After the Kubernetes Namespace was prepared and configured with the developer account for access, the developer used a client to access the Namespace. The client had the kubectl and helm tools installed in their working VM (their “client”) for accessing the TKG cluster. We also mounted the NFS file share created earlier to this client to simplify the data preparation.
Data Preparation
In this solution, we mounted the file share to the client machine with path /ml-share to allow access for preparing the data.
Here we demonstrated two machine learning scenarios:
Run PyTorch with Dask for Image Classification Inference
For this scenario, we downloaded the images from the Stanford Dogs Dataset, and unzipped the folder to the file share from the client machine. The path to the data was /ml-share/dogs/Images. Also, we downloaded the imagenet 1000 classes human readable file to /ml-share/dogs/imagenet1000.txt.
Train XGBoost with RAPIDS with Dask
For this scenario, we downloaded three years (2017, 2018 and 2019) yellow taxi trip data by using the following command to /ml-share/taxi-csv.

Provision the Tanzu Kubernetes Cluster
While provisioning the Tanzu Kubernetes Cluster for Dask, we defined the control planes and worker nodes as follows.
Table 3 Tanzu Kubernetes Cluster Definition
|
Role |
Replicas |
Storage Class |
VM Class |
Tanzu Kubernetes Release (TKR) |
|
Control Plane |
3 |
vsan-r5 |
best-effort-medium |
v1.20.8---vmware.1-tkg.2 |
|
Dask GPU Worker Nodes |
8 |
vsan-r1-sw8 |
16cpu-64gram-ts-20c-vmxnet3 |
v1.20.8---vmware.1-tkg.2 |
|
Dask Non-GPU Worker Nodes |
2 |
vsan-r5 |
best-effort-xlarge |
v1.20.8---vmware.1-tkg.2 |
Additionally, for each of the worker nodes, we configured a 100GB storage volume for the container and 50GB volume for the kubelet. The script we used in this example for Tanzu Kubernetes cluster deployment can be found here.

Figure 5 Tanzu Kubernetes Cluster is Running
Install the NVIDIA GPU Operator
After the Tanzu Kubernetes cluster was up and running, the developer logged into the Tanzu Kubernetes cluster that was just created and followed this link to install NVIDIA GPU operator on the Tanzu Kubernetes cluster. The installation process needs the developer to provide the NVIDIA CLS or DLS license token and the NGC account information.
In this solution, we installed GPU operator v1.9.1 and the script we used for installing NVIDIA GPU operator can be found here.
Configure Persistent Volume Claims
We configured two Persistent Volume Claims on the NFS file share, one for sharing the dataset across pods (mounted to /ml-share) the second for the PIP installation cache (mounted to /root/.cache/pip) to save the time of re-downloading the additional PIP packages while any of the pods were being rebuilt. The script we used for data collection and Persistent Volume Claims creation can be found here.
Install the Dask Cluster
We used Rapidsai Helm chart to install Dask. The table below demonstrates the resource definition of each role.
Table 4 Dask Cluster Definition
|
Role |
Replica |
CPU |
Memory |
GPU per Pod |
Service Type |
|
Dask Scheduler |
1 |
3 |
8GB |
N/A |
Load Balancer |
|
Dask Worker |
8 |
6 |
48GB |
1 |
N/A |
|
Jupyter Notebook |
1 |
3 |
8GB |
N/A |
Load Balancer |
We used the rapidsai container image (21.10-cuda11.2-runtime-ubuntu20.04) from the NVIDIA NGC, and mounted the two Persistent Volume Claims created above to the Dask Worker pods and Jupyter Notebook pod. The number of threads per Dask worker is adjustable. By default, the thread number per Dask worker pod is the number of cores assigned to the pod.
We set the nodeSelector of the Dask Scheduler and Jupyter Notebook to assign those two non-GPU worker nodes to them.
The installation script produced the following objects in the Tanzu Kubernetes cluster:

Figure 6 Dask is Running
After the Dask cluster was up and running, from the client, inside the /ml-share directory, there were two directories created for the Persistent Volume claims, one for the PIP installation cache, the other for the data-set placement. We moved both Stanford Dogs Dataset and yellow taxi trip data into the directory that was created for the data-set. In this case, all the Dask Worker nodes and Jupyter Notebook could access these two directories (dogs and taxi-csv) from /ml-share. The script we used for RAPIDSAI installation can be found here.

Figure 7 Persistent Volume Claims
Then a user was able open a browser and go to http://rapidsai-Jupyter-EXTERNAL-IP (192.168.105.38 in our case) to access the Jupyter Notebook, by default the password is rapidsai. The installation contained the dashboard to show the status and metrics of Dask cluster. This was done by opening a browser and going to http://Dask-Scheduler_External-IP:8787, In our case, it was http://192.168.105.39:8787. The dashboard allowed users to monitor the resource utilization, task progress, performance, and nodes’ information and logs for both the Dask Worker nodes and the scheduler. 
Figure 8 The Dask Dashboard
The Jupyter Notebook was also configured with the Dask plug-in. By clicking on the Dask icon on the left and putting the same http://Dask-Scheduler_External-IP:8787 there, a Notebook user was able to get the metrics.
Run Machine Learning Workload with Dask
Run PyTorch with Dask for Image Classification Inference
Using the techniques described in this blog, we ran image classification inference with an image classification model on PyTorch with Dask on different numbers of Dask Workers. This was done using vGPU or vCPU by setting device to torch.device(“cuda”) for vGPU and torch.device(“cpu”) for vCPU. In total, there were 20,580 photos to be classified. These photos were placed in the shared Persistent Volume Claim and were accessed by all the Dask Worker nodes and Jupyter Notebook. In our testing, the model correctly classified 13,802 photos, and the correct ratio was around 67%. Since we were using a pre-trained image classification model and did not do data cleansing, the accuracy was not overwhelming.
However, as an example, we can see the significant performance improvement by Tanzu Kubernetes cluster with vGPU configured and the scalability from VxRail infrastructure all the way up to Dask platform deployed on the Tanzu Kubernetes cluster.

Figure 9 Image Classification Performance
We configured each Dask Worker node with six vCPU and one vGPU and we used the time consumption as the performance metric. In general, the image classification processed by six 2.00GHz vCPU consumed 7x to 10x of the time than one vGPU with 20GB framebuffer memory.
While running the image classification workload, we could monitor CPU, Memory and GPU utilization of each Dask Worker node and the progress of the tasks. The figure below shows the GPU memory utilization (green bars) was around 70% while running the workload with GPU.

Figure 10 Run PyTorch with vGPU
While running the testing, by looking at the Dask-plugin from the Jupyter Notebook, we saw that in both scenarios (using vGPU or vCPU) we were able to balance the workload distribution to all the vCPUs or vGPUs across all the Dask worker nodes. For the tests handled by vGPU, we saw that all the vGPU were using 80%+ framebuffer memory and the tests handled by vCPU were nearly saturating all six vCPU for all the Dask Worker nodes.

Figure 11 Run PyTorch with vCPU
Train XGBoost Regressor with RAPIDS and Dask
We also ran a familiar machine learning use case: predicting the New York taxi fare using an XGBoost regressor. The data-set used includes all three years (2017-2019) of New York taxi trip data. The entire process flow for this example test exercise included the following steps:
- Data cleansing: drop the rows with invalid data, convert the data format if needed
- Data loading: load the data to the memory
- Data Splitting: split the data to train data set and test data set, the ratio is 75%:25%
- Model Training: train the XGBoost regressor model
- Inference: get the taxi fare predictions using the test data set
- Error Analysis: compare the taxi fare prediction data and the taxi fare in test data set
Using the same deployment, the Jupyter Notebook did not have vGPU assigned, thus we had to use dask.dataframe library to read the csv files. This library handles the data loading and split process in the vCPU on the Dask Worker nodes. Only the XGBoost model training and inference process were handled by the vGPUs. In this example test case, the time spent was 85 seconds on data loading, 13 seconds on data splitting, and 35 seconds on XGBoost Regressor model training.
However, some improvement could be made if that the data loading and split process could be handled by the vGPU. In this case, the dask_cudf library should be used to replace dask.dataframe, and the Jupyter Notebook needed to have vGPU assigned to use the dask_cudf library. So we tested another deployment scenario by assigning one vGPU to the Jupyter Notebook pod and removing one Desk Worker node.
Table 7 Dask Cluster Definition
|
Role |
Replica |
CPU |
Memory |
GPU per Pod |
Service Type |
|
Dask Scheduler |
1 |
3 |
8GB |
N/A |
Load Balancer |
|
Dask Worker |
8 -> 7 |
6 |
48GB |
1 |
N/A |
|
Jupyter Notebook |
1 |
3 |
8GB |
N/A -> 1 |
Load Balancer |
In this test, Dask spent 19 seconds on data loading, 9 seconds on data splitting, and 25 seconds on the XGBoost Regressor model training. Even though there were just seven Dask Worker nodes, the Model Training performance was not compromised. Giving one vGPU to the Jupyter Notebook to use the cudf library for the XGBoost model training shortened the entire training process by more than half.

Figure 12 Train XGBoost Performance
From a resource utilization perspective, the Dask framework distributed the workload evenly across the cluster and in total the vGPU usage was about 73%, while the vCPU was barely used during the training process. The figure below illustrates the vGPU usage with the green bars and the vCPU usage with the blue bars.

Figure 13 Resource Utilization
Best Practices
The following aspects are recommended when deploying a Dask cluster on a Tanzu Kubernetes cluster.
Start with a Small Sized Cluster
For the first deployment, try a smaller size of Tanzu Kubernetes cluster with a smaller size of Dask cluster. Not every workload or model learning job requires that many GPUs or other compute resources. Then use a small portion of the source (training) data to run the machine learning workload. If you are satisfied with the performance, increase the source data gradually until you feel the speed is too slow, then increase the Tanzu Kubernetes cluster and Dask cluster size.
Monitor the Resource
A vSphere administrator can use the vSphere and vSAN performance services to monitor the resources utilization from an infrastructure perspective. For example, using the vSAN performance service can help to identify whether there is any bottleneck on the Tanzu Kubernetes cluster volumes or file share.
A developer or data scientist can monitor the resource utilization using the Dask dashboard to find out if there is any resource including CPU, memory, GPU, storage, and network that is saturated or if any pod becomes the hotspot – so as to identify the performance bottleneck.
Use vSAN for ReadWriteMany Persistent Volumes
Using vSAN file service for ReadWriteMany Persistent Volumes can easily scale out the file share and the security, failure tolerance, performance, and capacity-saving features. This architecture can also be easily balanced by manipulating the storage policy of the file share.
Use the Images from the NVIDIA GPU Cloud (NGC)
NVIDIA has deployed the latest and most stable Rapidsai image from docker hub, in the NGC. By using these NGC images, you do not need to struggle with deciding which build to use. When installing the Dask Helm chart, set the Dask Scheduler, Worker, and Jupyter image repo to nvcr.io/nvidia/rapidsai/rapidsai and set the image tag to 21.10-cuda11.2-runtime-ubuntu20.04.
Install Additional Packages
If additional packages need to be used, like PyTorch, you need to install them on the Dask worker nodes. In this case, while installing the Dask Helm chart, set the dask.worker.env[0].name=EXTRA_PIP_PACKAGES and dask.worker.env[0].value="--upgrade torch==1.10.1+cu113 torchvision==0.11.2+cu113 torchaudio==0.10.1+cu113 -f https://download.pytorch.org/whl/cu113/torch_stable.html --trusted-host download.pytorch.org" to automatically install PyTorch packages on Dask workers after the Dask cluster is deployed. The process can be monitored by using “kubectl logs” to check each individual Dask worker installation process.
Also, we recommend creating a separate Persistent Volume Claim for the PIP cache directory for all the Dask worker nodes and mounting it to /root/.cache/pip within each node. In a situation where any of the Dask worker nodes needs to be recreated, and the PIP wheels downloaded earlier by other Dask worker nodes can be reused to install the package directly without re-downloading.
Use Nodeselector for Dask Scheduler and Jupyter Notebook
We recommend using Nodeselector to place the Dask Scheduler and Jupyter pods onto the Tanzu Kubernetes cluster nodes without a vGPU. In this case, we can easily identify the root cause if there is any issue or bottleneck in the Dask cluster.
So as to plan ahead, if RAPIDS library is used for machine learning, then only the Dask Scheduler can be allocated to a Tanzu Kubernetes cluster node without a GPU and all the other pods, including the Jupyter Notebook pod, should be allocated to Tanzu Kubernetes cluster nodes with GPU. In this case, we need to reduce the Dask Worker node count by one.
NOTE: Kubernetes does not allow pods to share a GPU, so we cannot deploy the Jupyter Notebook and a Dask Worker within the same Tanzu Kubernetes cluster node with GPU. However, this issue is already being taken care by the Kubernetes community per https://github.com/src-d/k8s-nvidia-gpu-overcommit/blob/overcommit/README.md
Conclusion
Dask can parallelize and distribute a machine learning workload by leveraging the CPU or GPU resources on multiple worker nodes, which can help to speed up the workload by adding more Dask Worker nodes.
Running a Dask cluster on Tanzu Kubernetes cluster with vGPU on VxRail simplifies the deployment, configuration, maintenance, and scaling-out factors for machine learning. This end-to-end solution allows the vSphere administrators to add VxRail servers into the vSphere cluster on demand to expand the vSphere cluster size with more GPU power. Then developers can add more worker nodes with vGPUs into the Tanzu Kubernetes cluster and scale out the Dask cluster with more Dask Workers accordingly.
The combination of Dask, Tanzu Kubernetes Grid service, and VxRail enables VMware’s partners and customers to provision and manage the machine learning platform on demand and to run machine learning workloads according to the business needs.
References
PyTorch: https://pytorch.org/
RAPIDS: https://rapids.ai/index.html
XGBoost: https://xgboost.readthedocs.io/en/stable/
Dask: https://dask.org/
About the Author
Chen Wei, Senior Manager of CIBG Application Solutions Team wrote the original contents of this paper. The following people also contributed to the paper review and editing:
- Aaron Chu, Senior Solutions Engineer, VMware
- Catherine Xu, Manager of CIBG Application Solutions Team, VMware
- Justin Murray, Staff Technical Marketing Architect, VMware
- Vic Dery, Sr. Principal Engineer of VxRail Technical Marketing in Dell Technologies
- Jason Marques, Sr. Principal Engineer of VxRail Technical Marketing in Dell Technologies
- Tony Foster, Sr. Principal Engineer of VxRail Technical Marketing in Dell Technologies
