
Skyline Health for vSphere
Understanding vSphere Health
 This walkthrough will demonstrate how to use vSphere Health.
vSphere Health works to identify and resolve potential issues before they have an impact on a customer’s environment. Telemetry data is collected from the vSphere environment then used to analyze pre-conditions within customer environments. Learn More: https://blogs.vmware.com/vsphere/2019/01/understanding-vsphere-health.h…
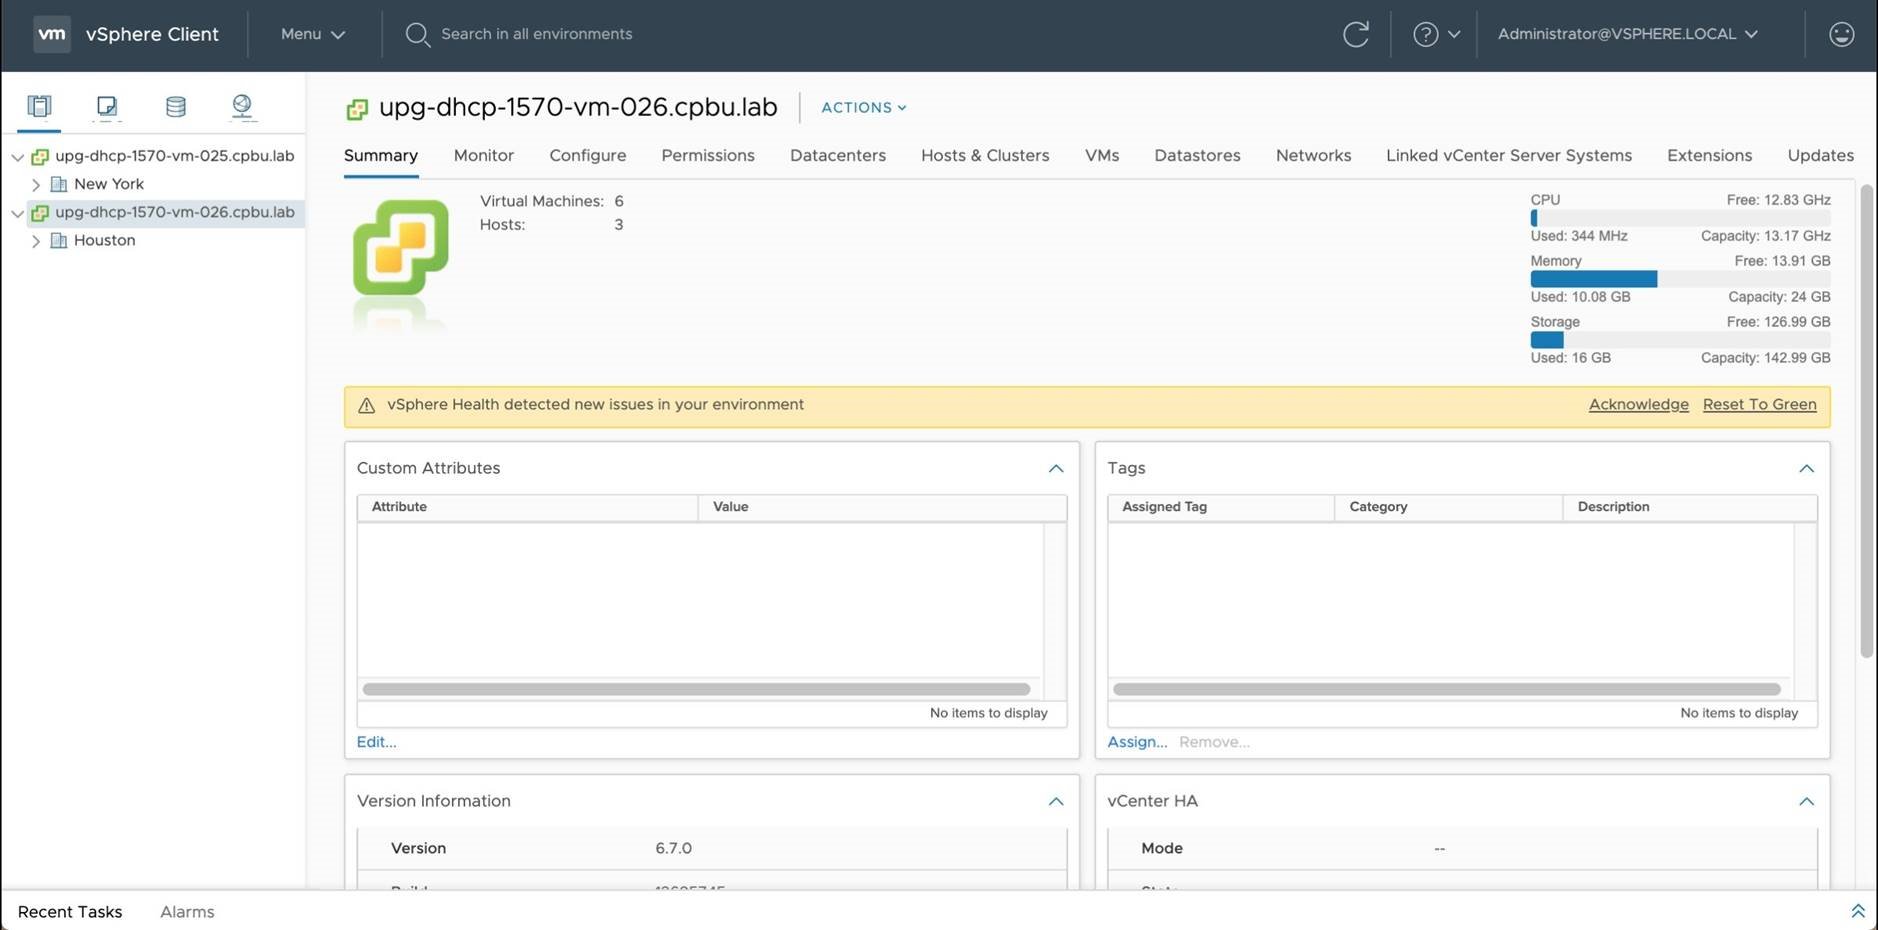
After logging into the VCSA you will notice a vSphere Health alarm indicating that new issues have been detected in the environment. Begin by clicking on [Monitor]
Next we will click on [Triggered Alarms]
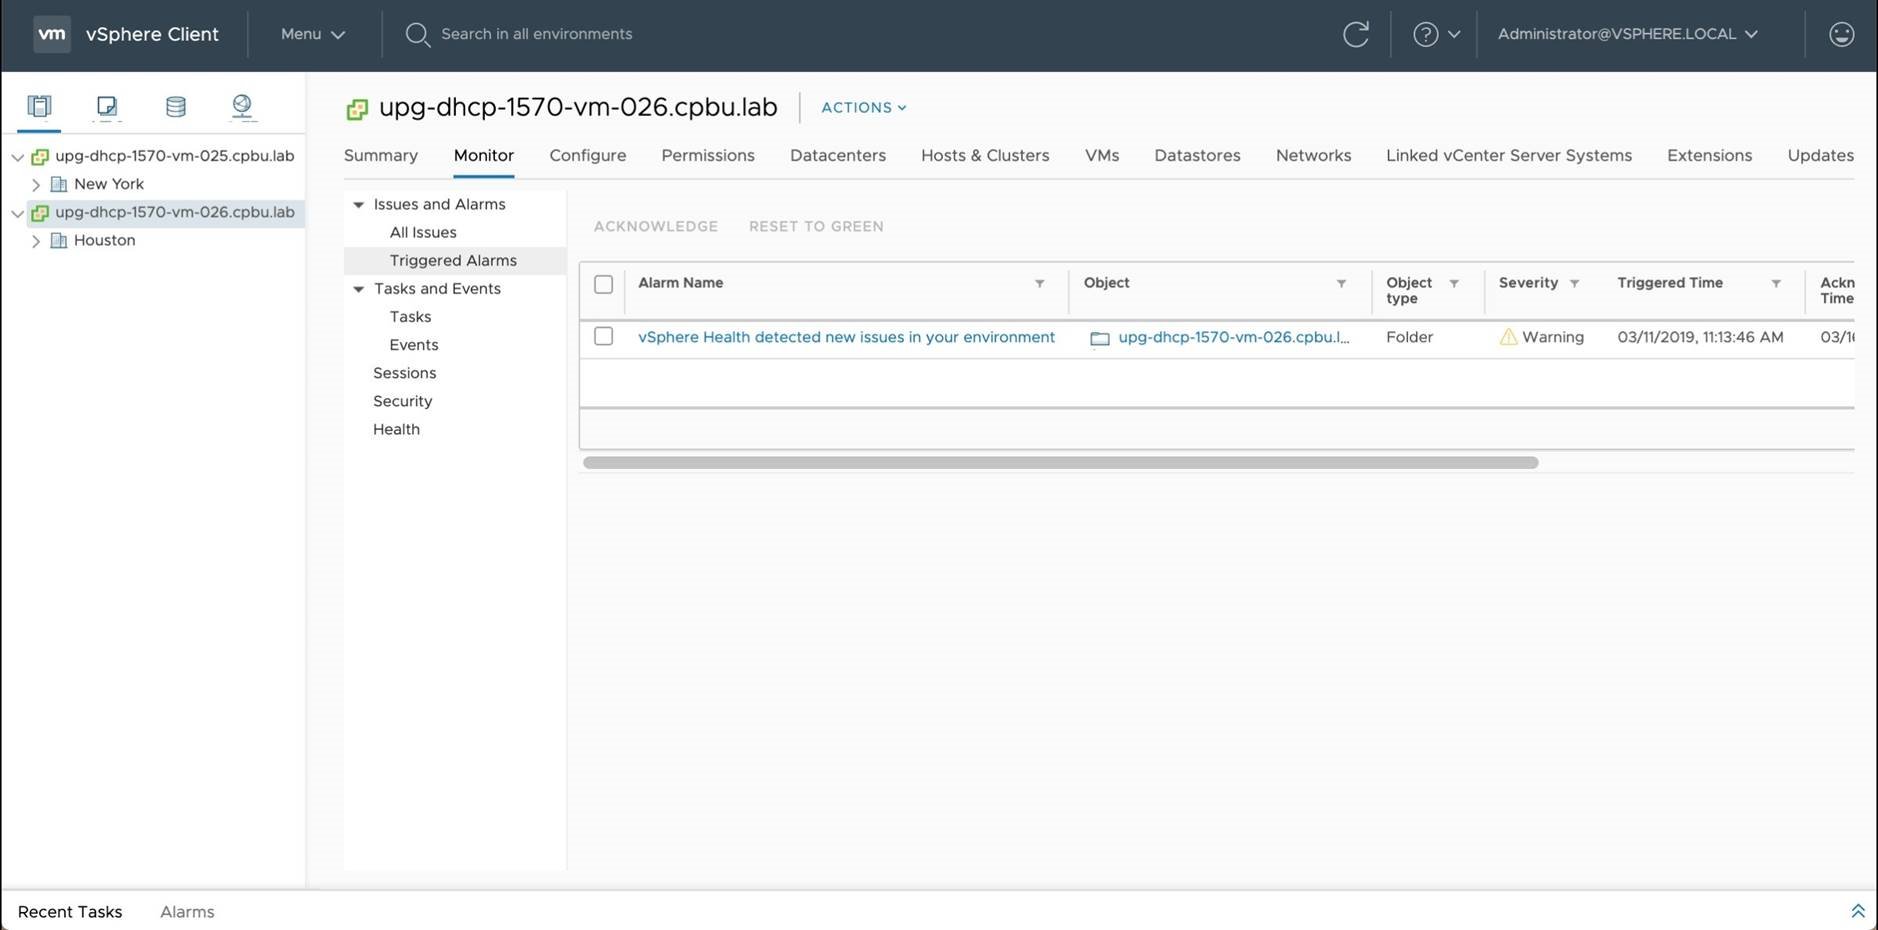
The Triggered Alarms view will show the vSphere Health alarm. Let's set this alarm back to Green. Click the checkbox [ ] to the left of the vSphere Health alarm.
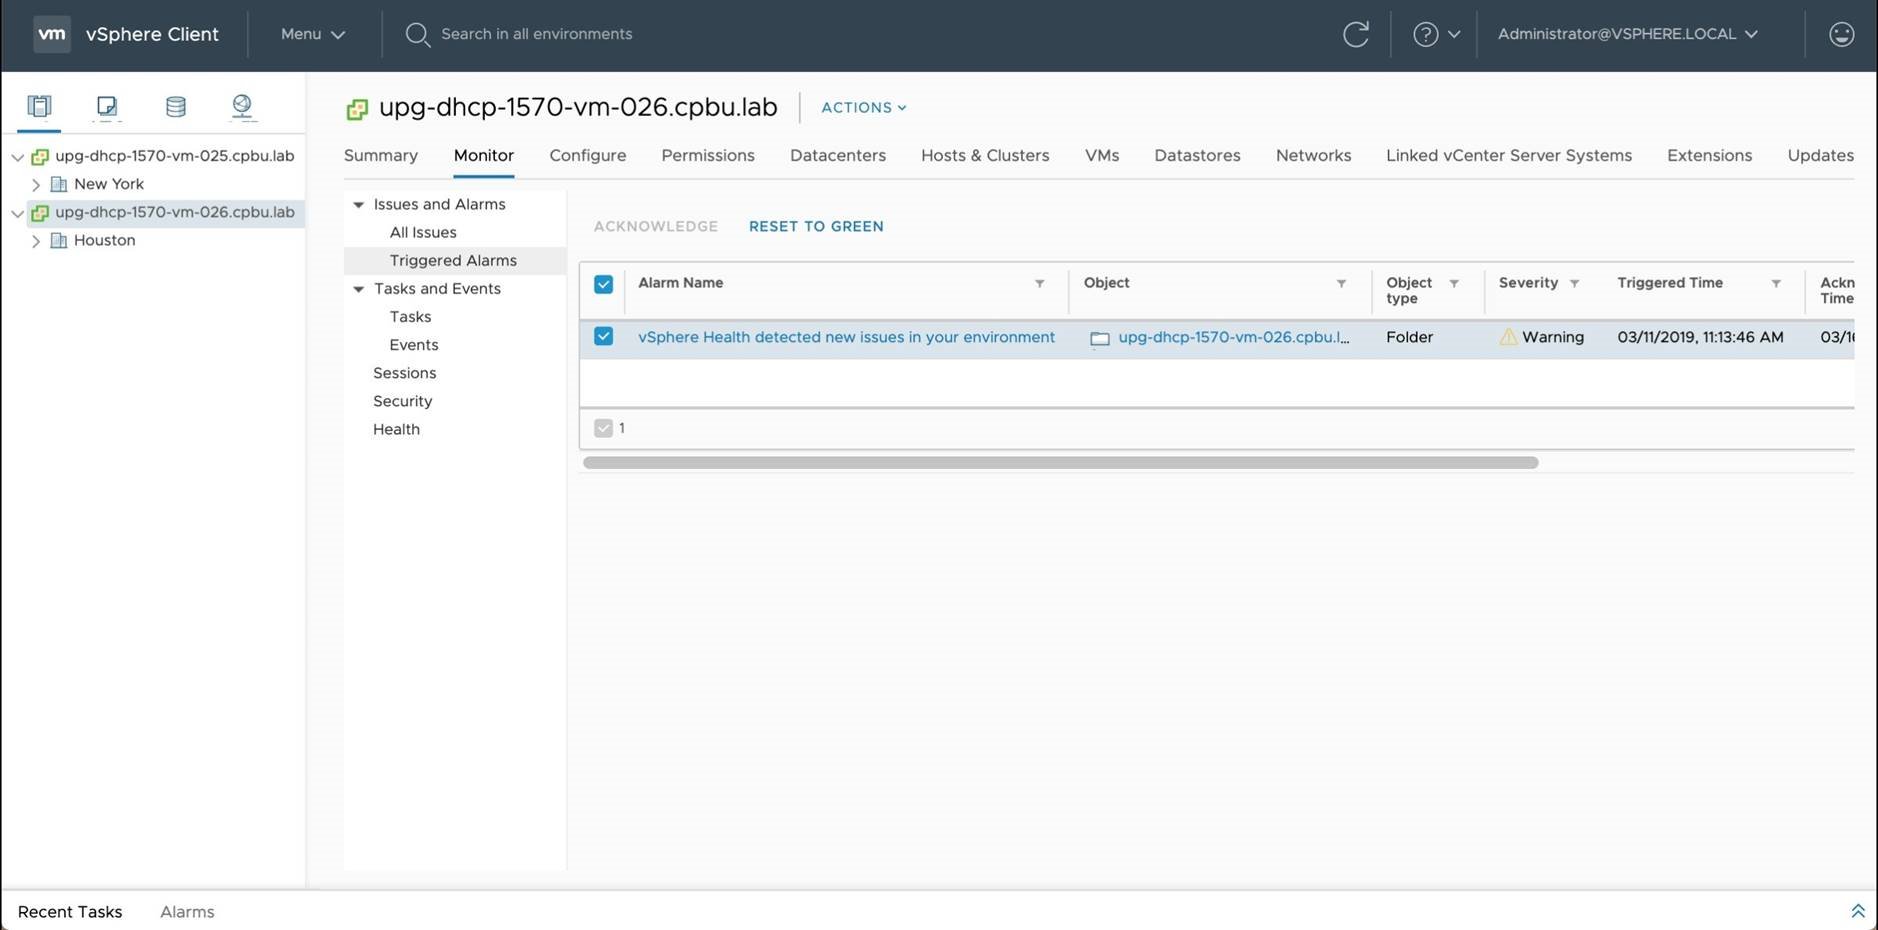
From here, click [Reset To Green] to clear the vSphere Health alarm.
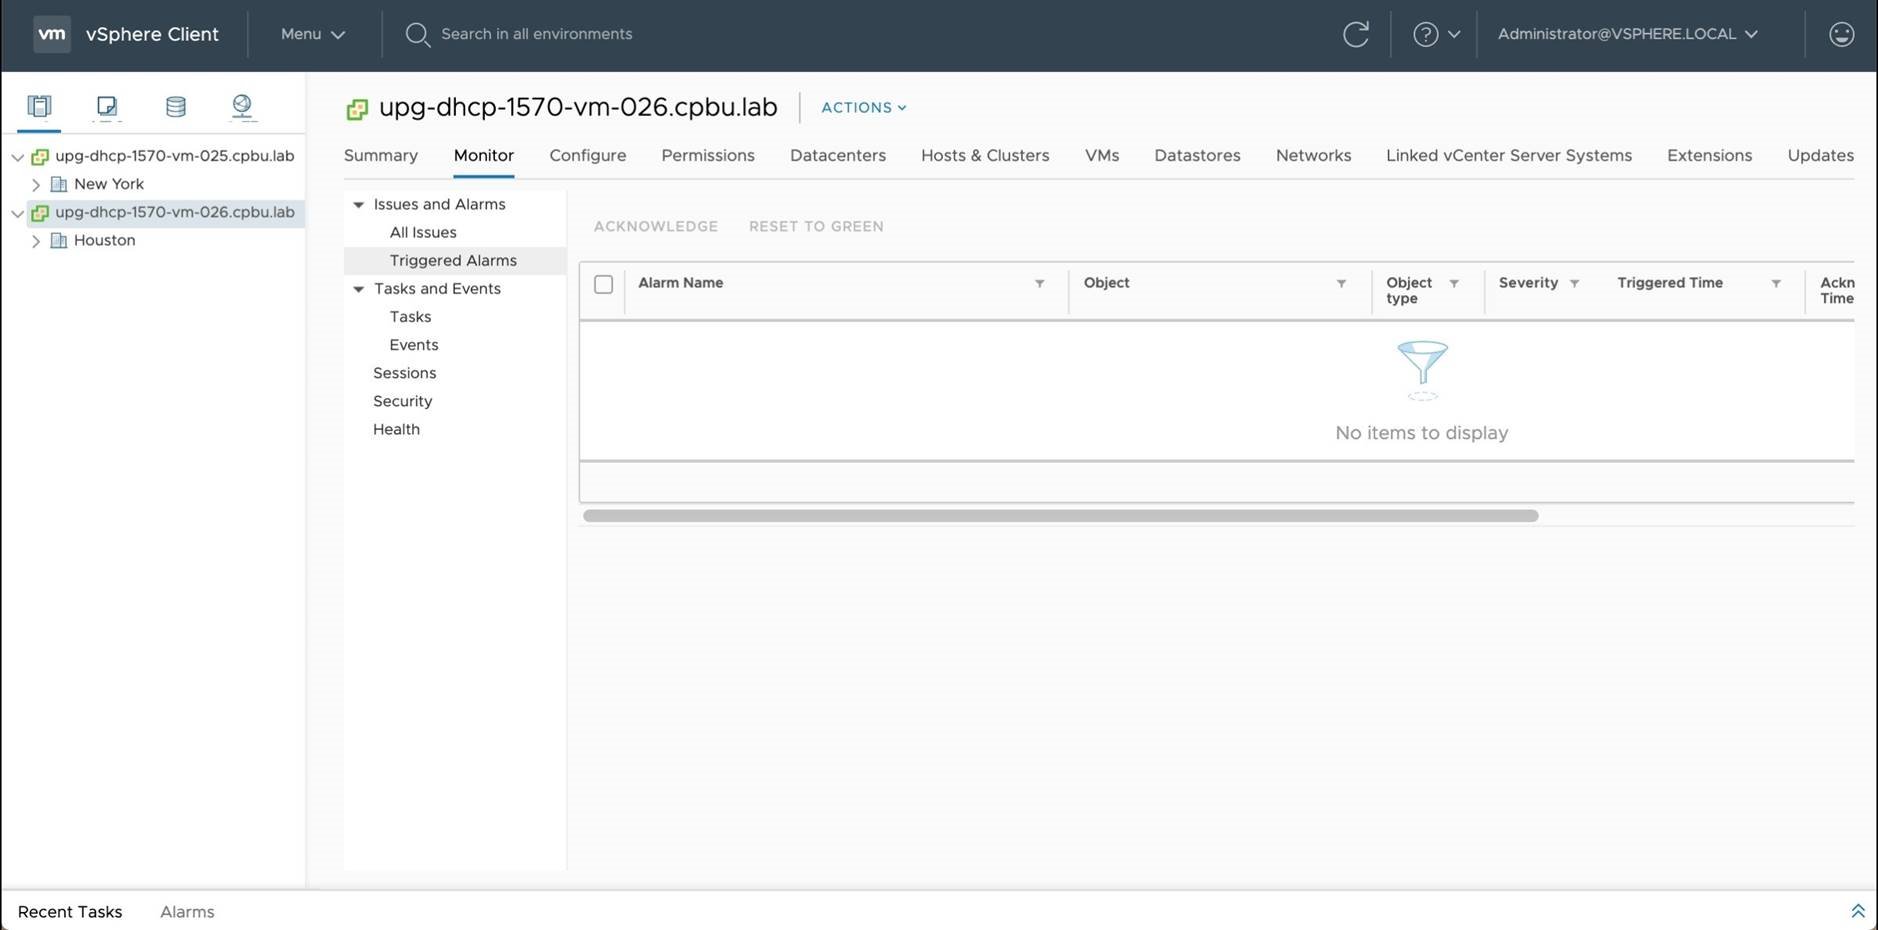
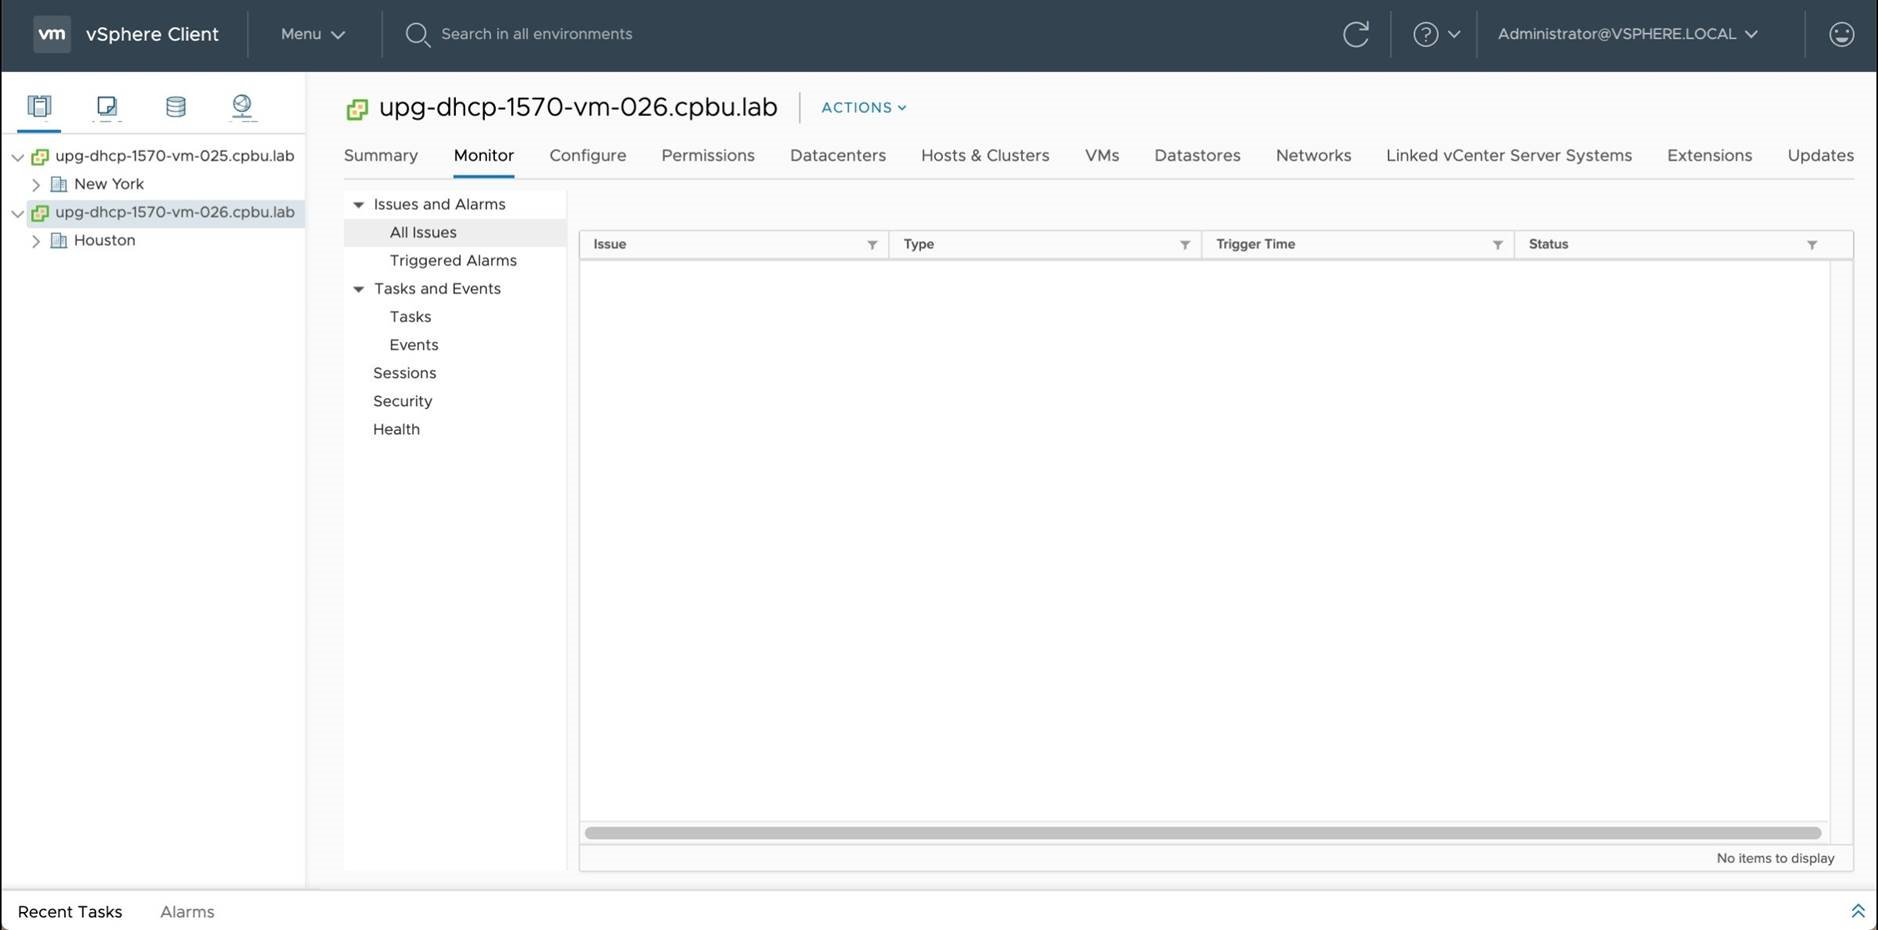
All alarms are now cleared. Let's check the health of this vSphere environment. Click [Health] to begin.
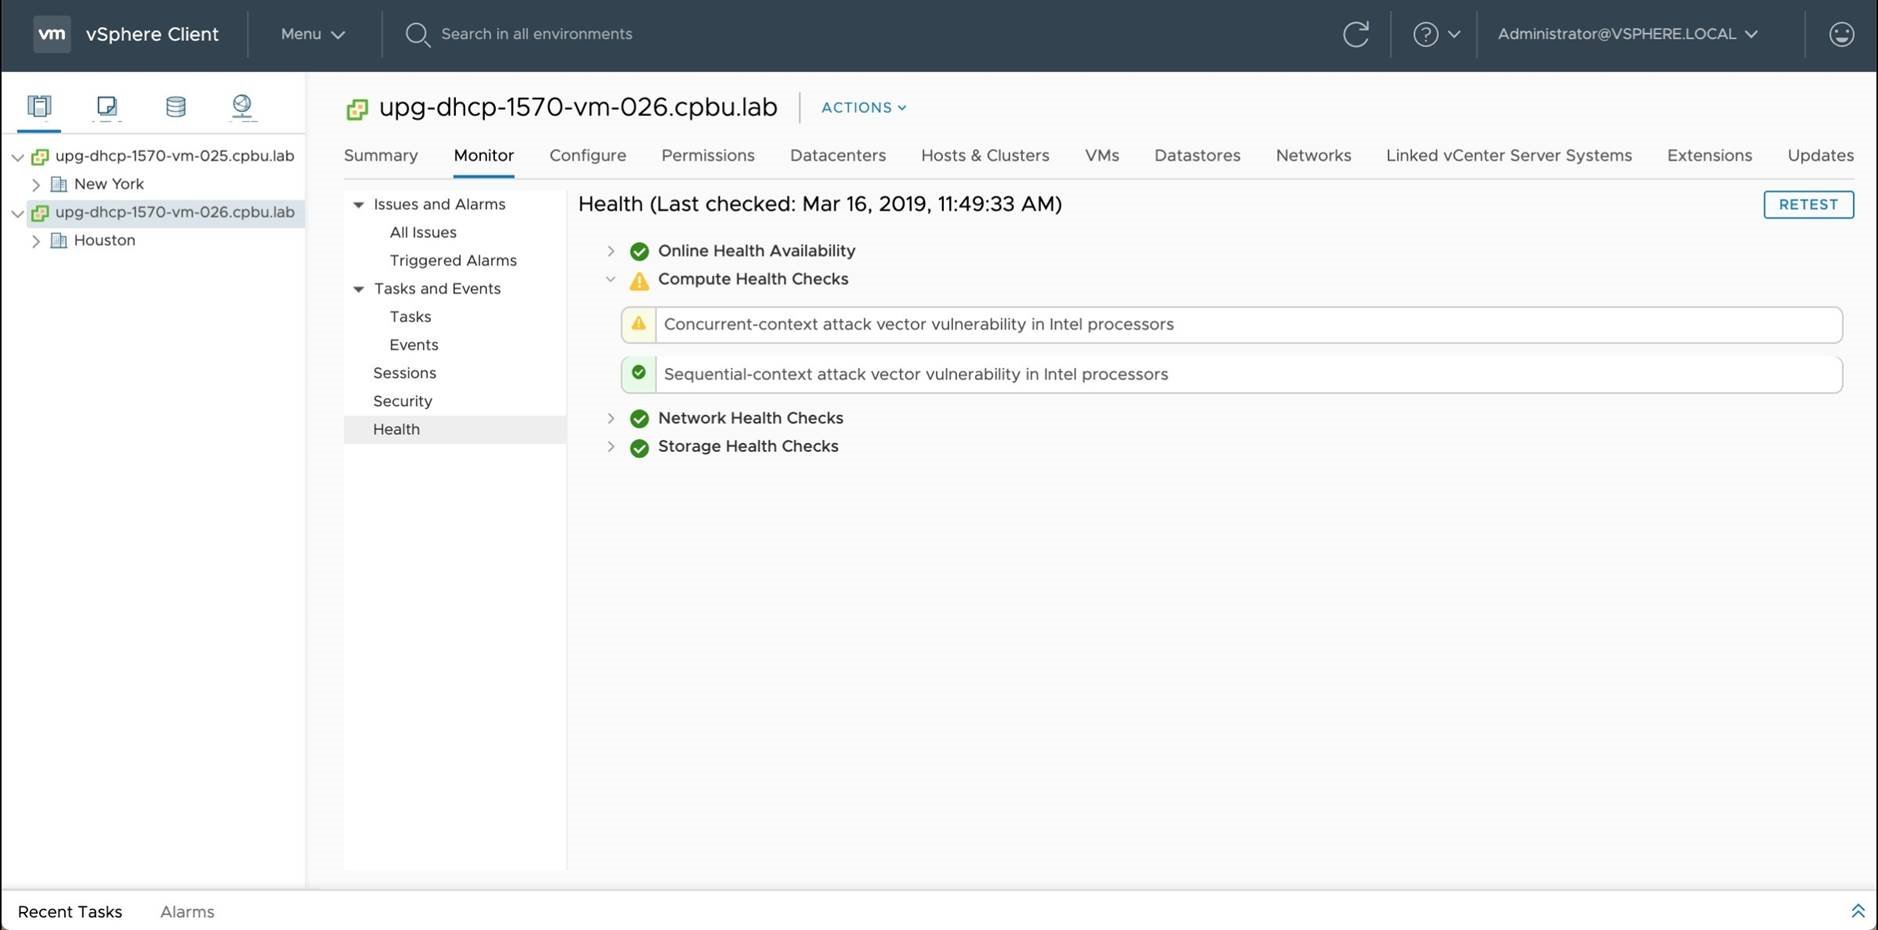
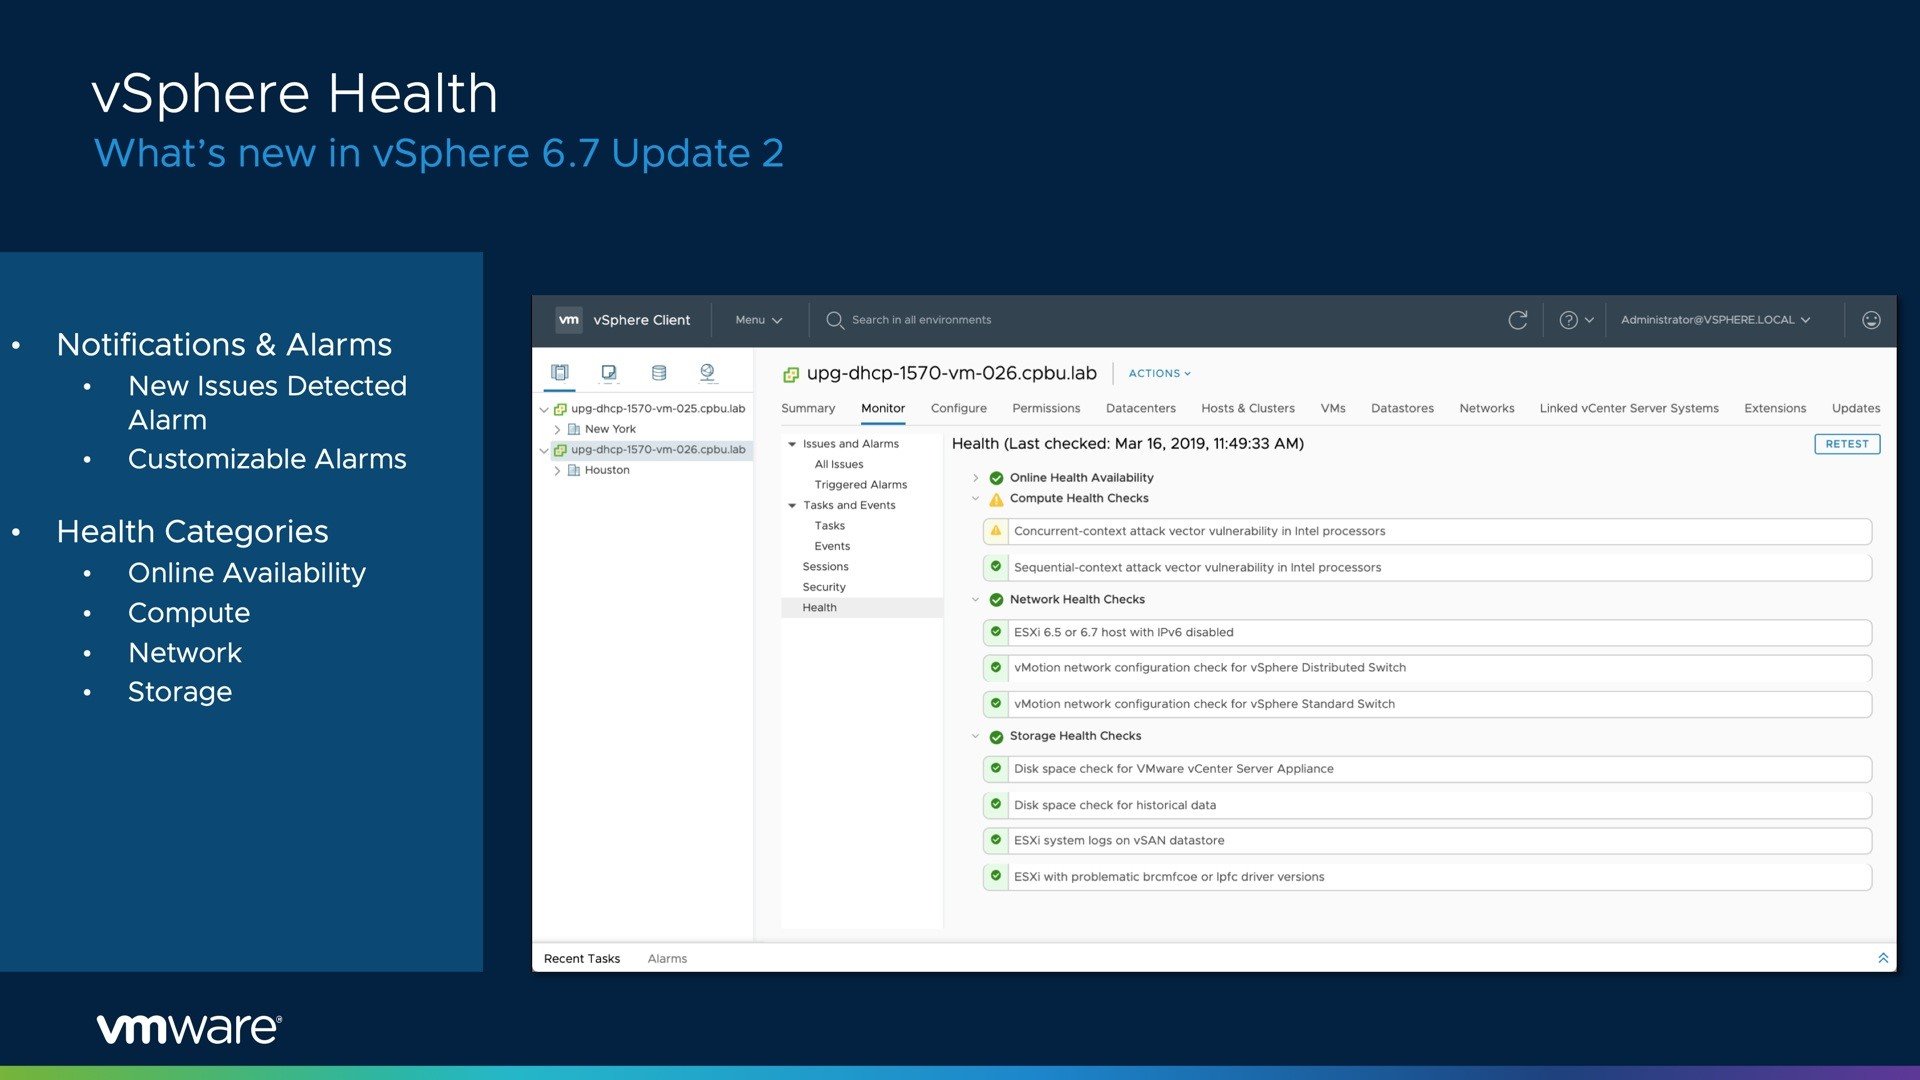
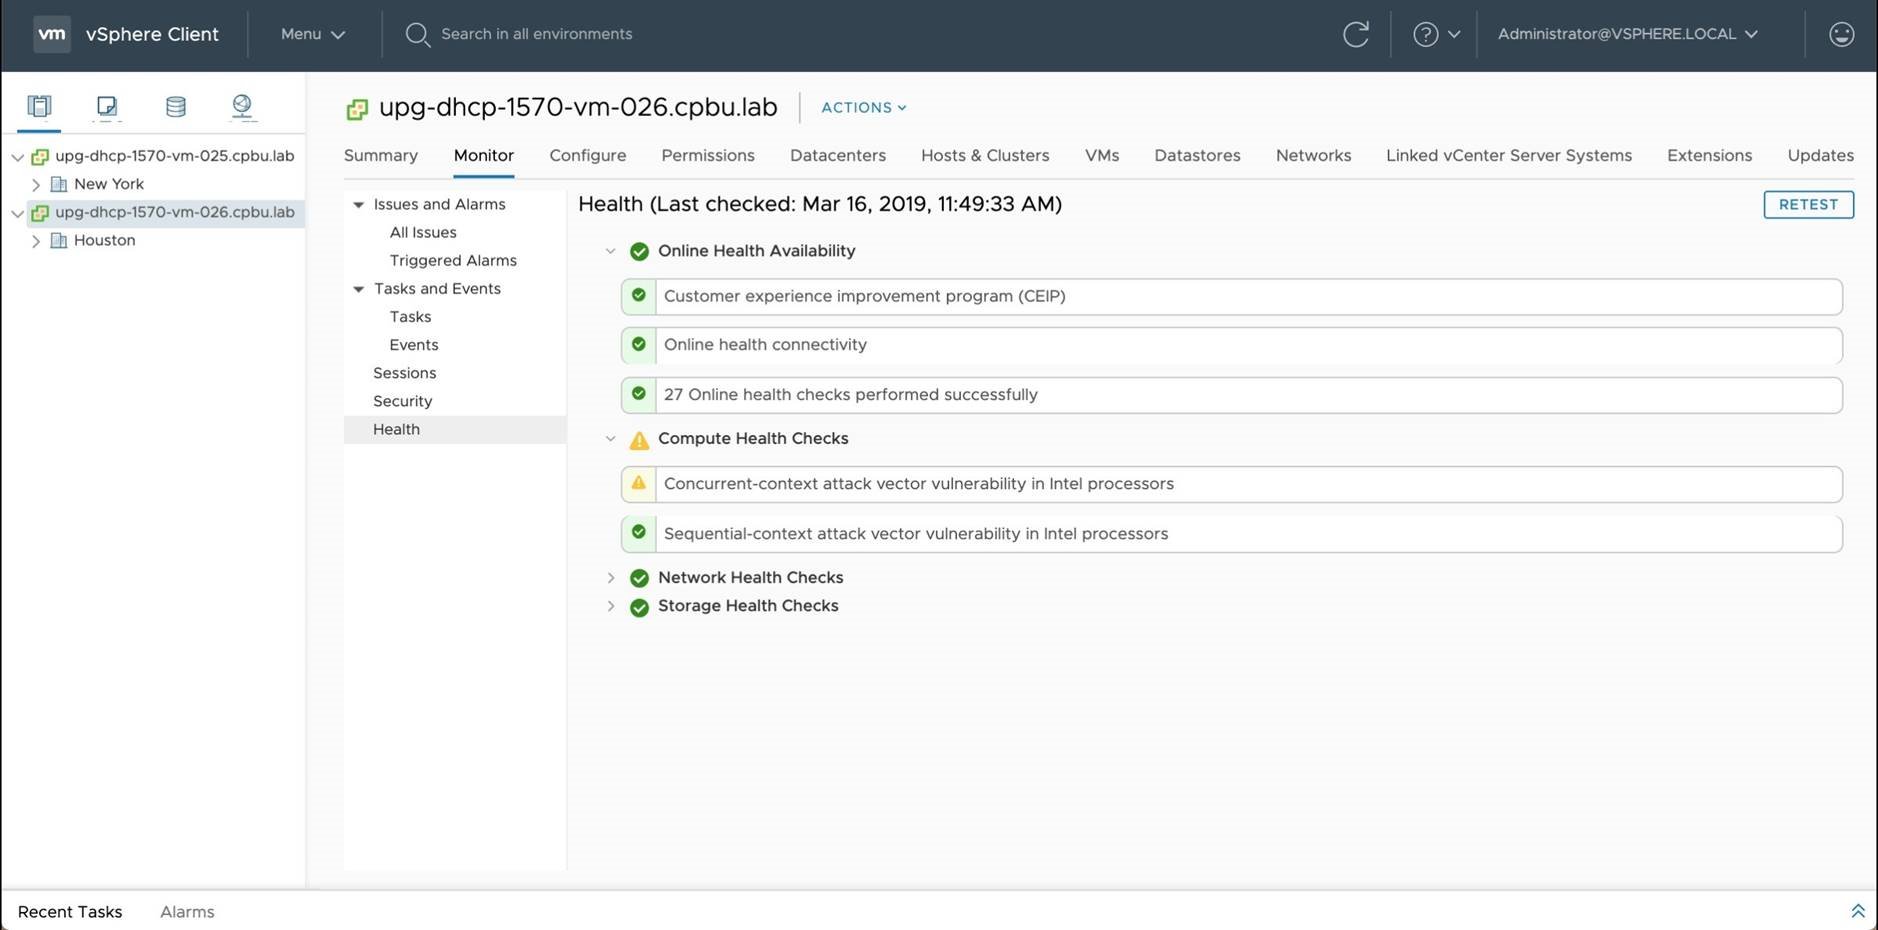
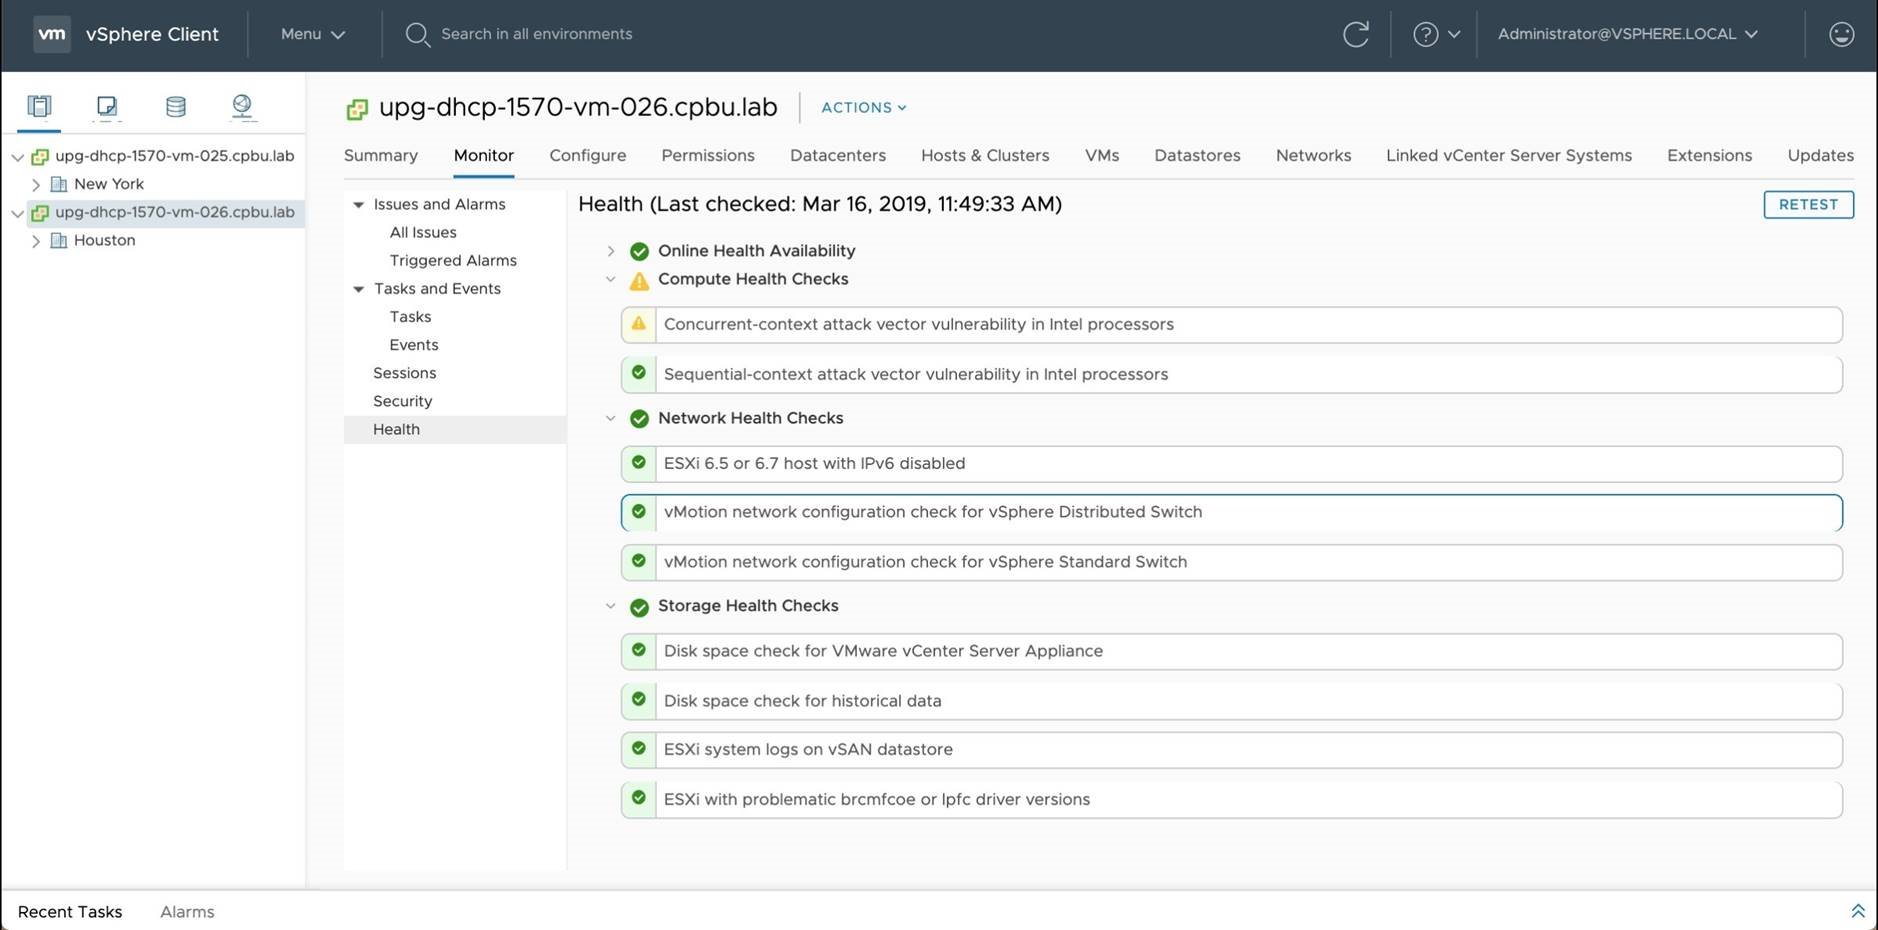
This is vSphere Health's main dashboard. From here you will be able to see all health checks that have run within the environment. Each vSphere Health check belongs to a category (Online Availability, Compute, Network, and Storage)Click [Online Health Availability] to expand the health checks
Click [Network Health Checks] to expand
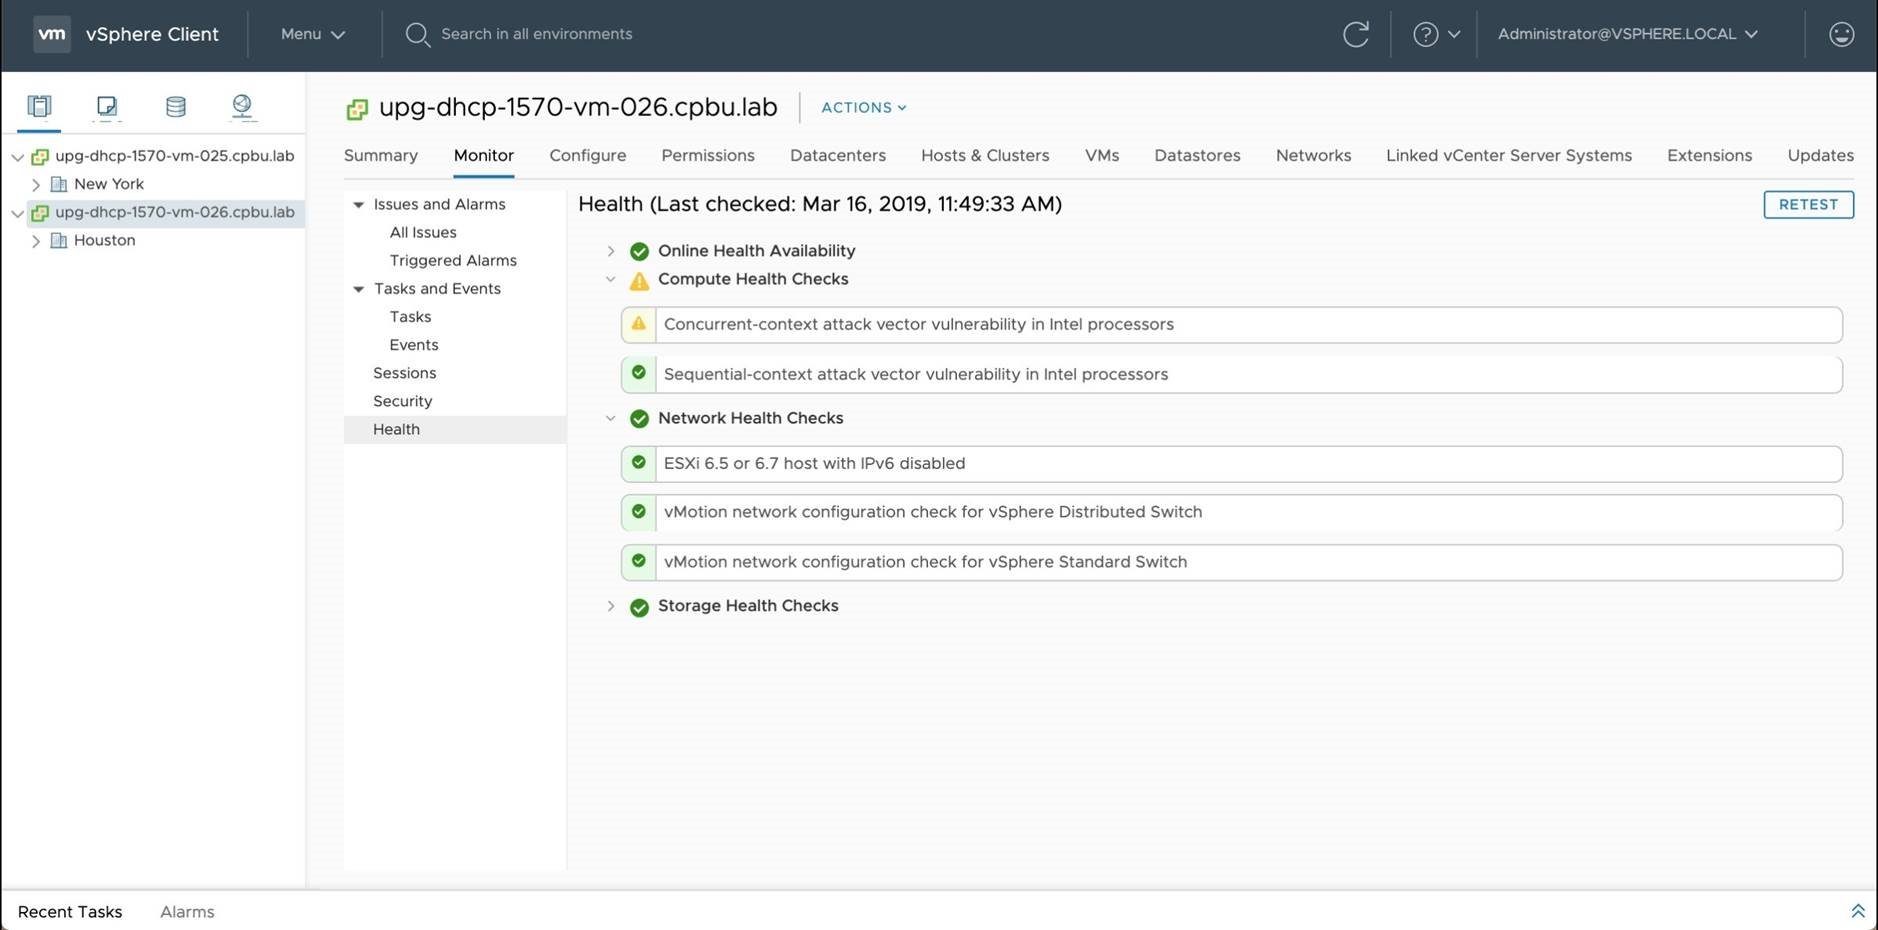 Review the Network related vSphere Health checks.Click [Storage Health Checks] to expand
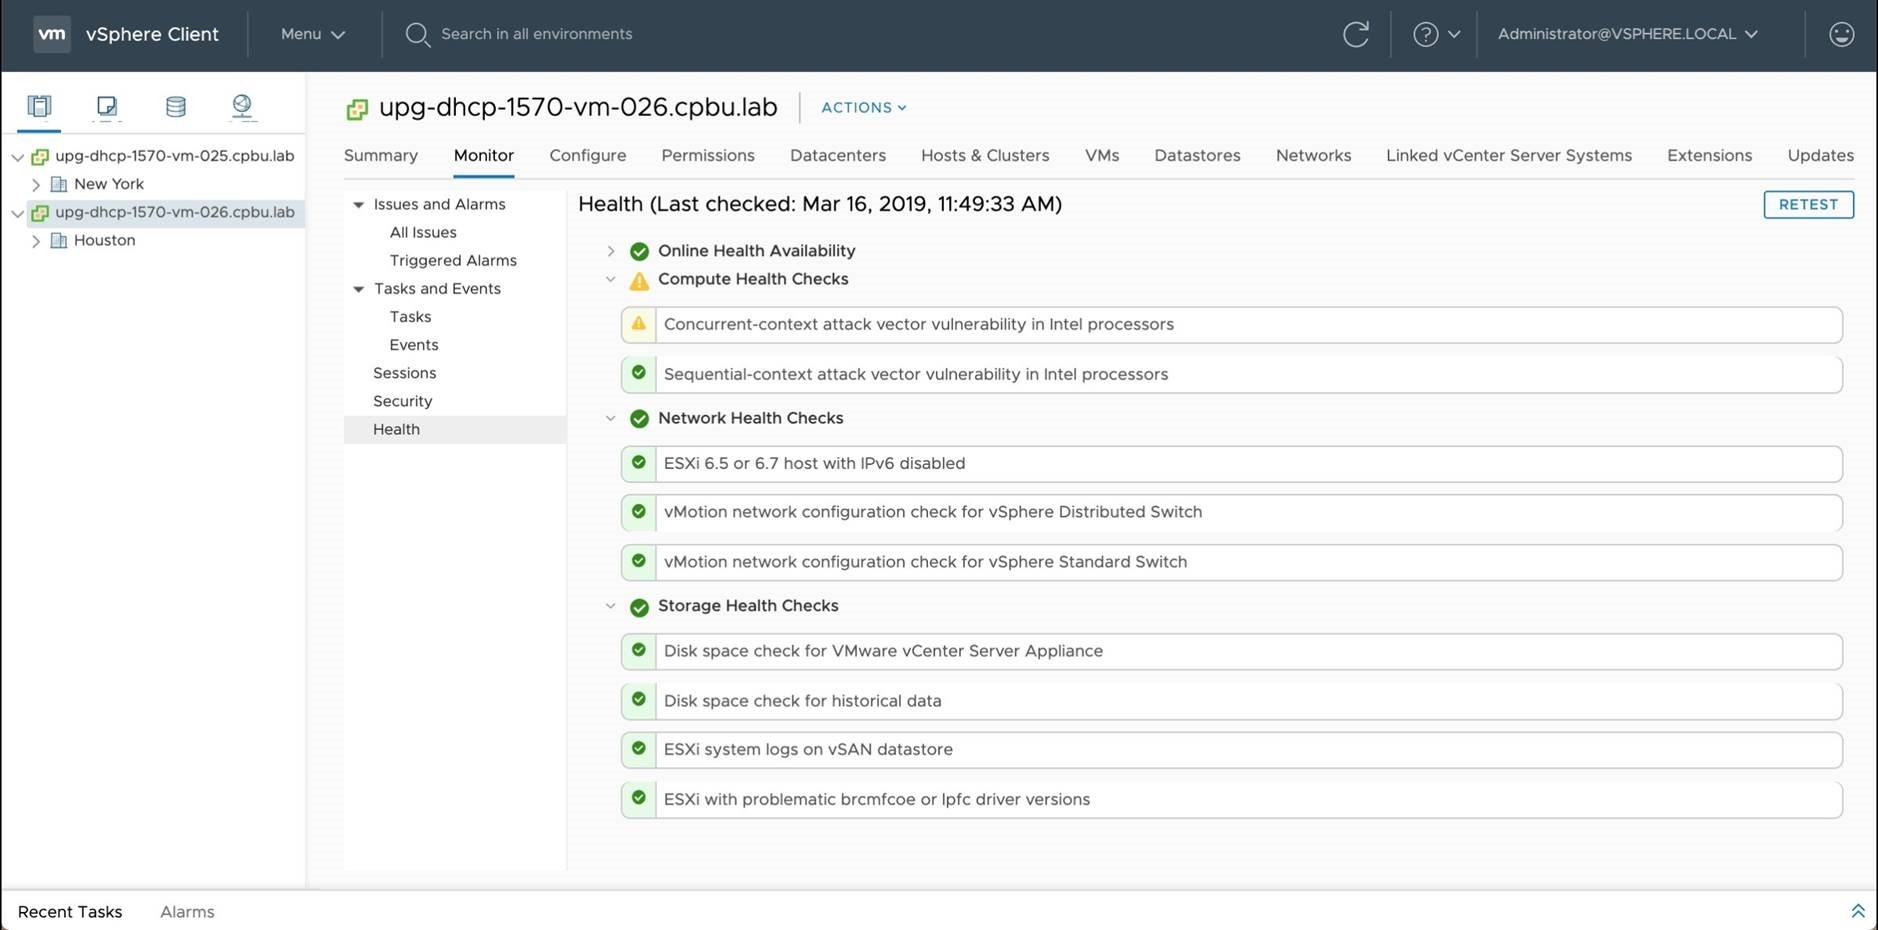
Review the Storage related vSphere Health checks.
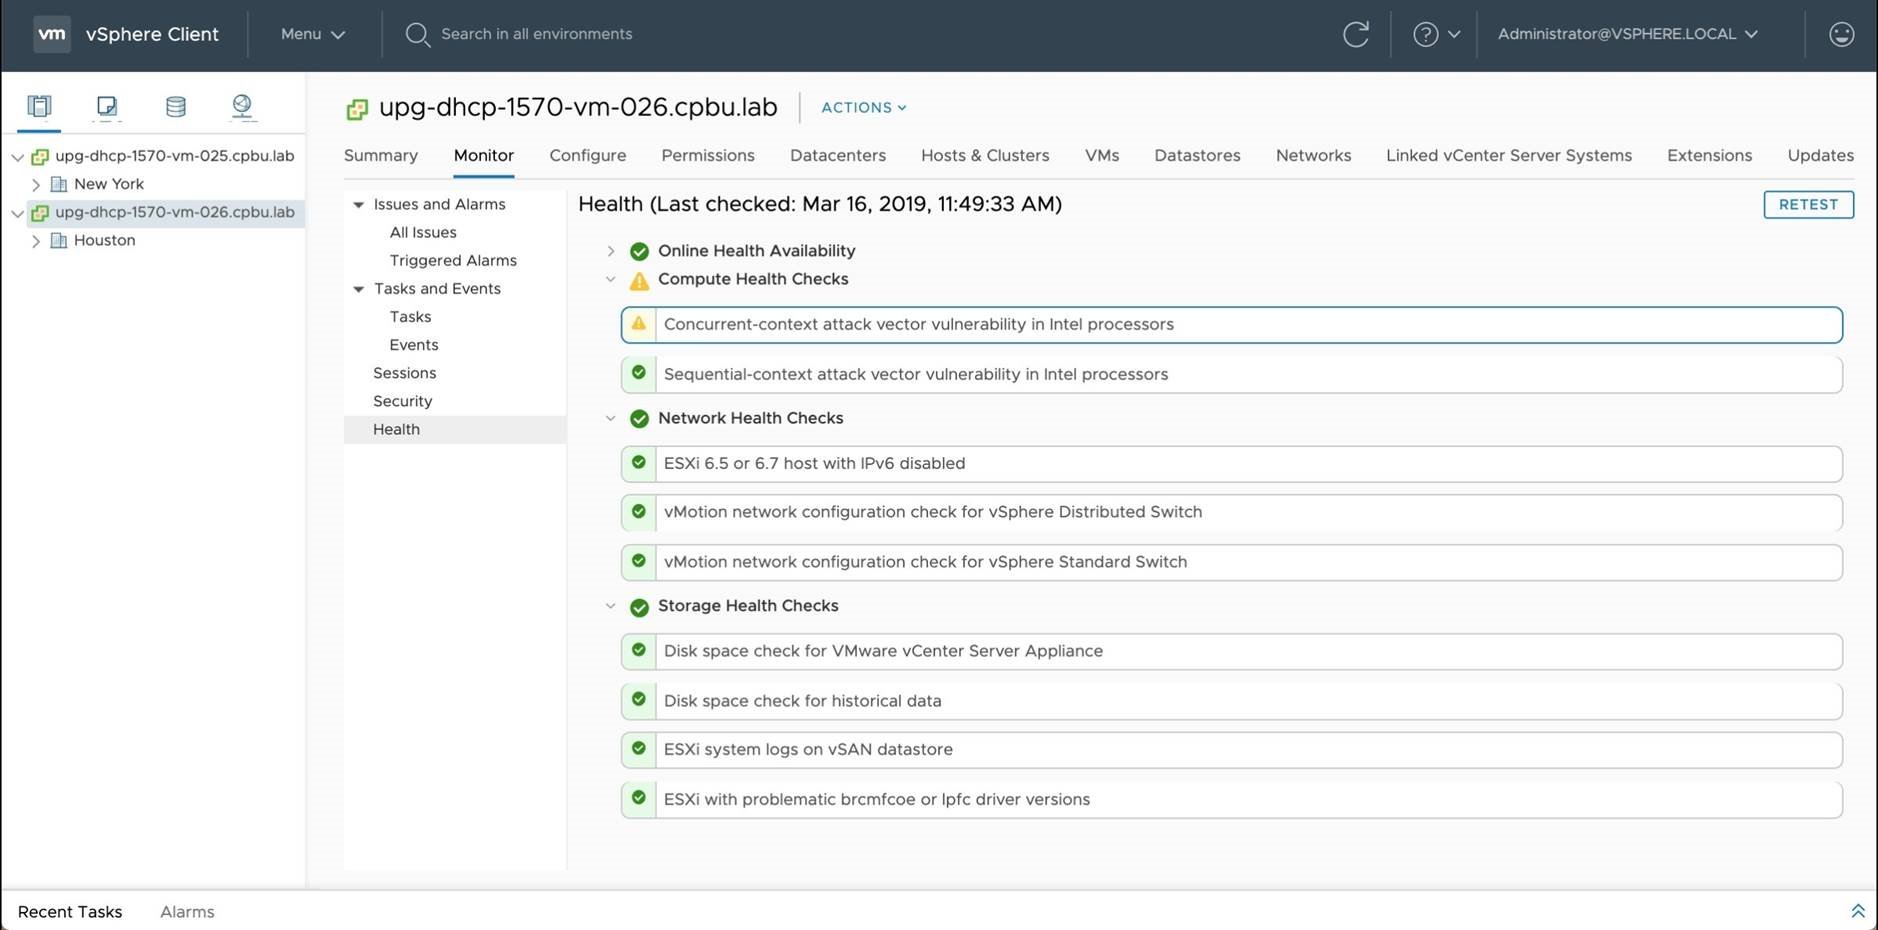
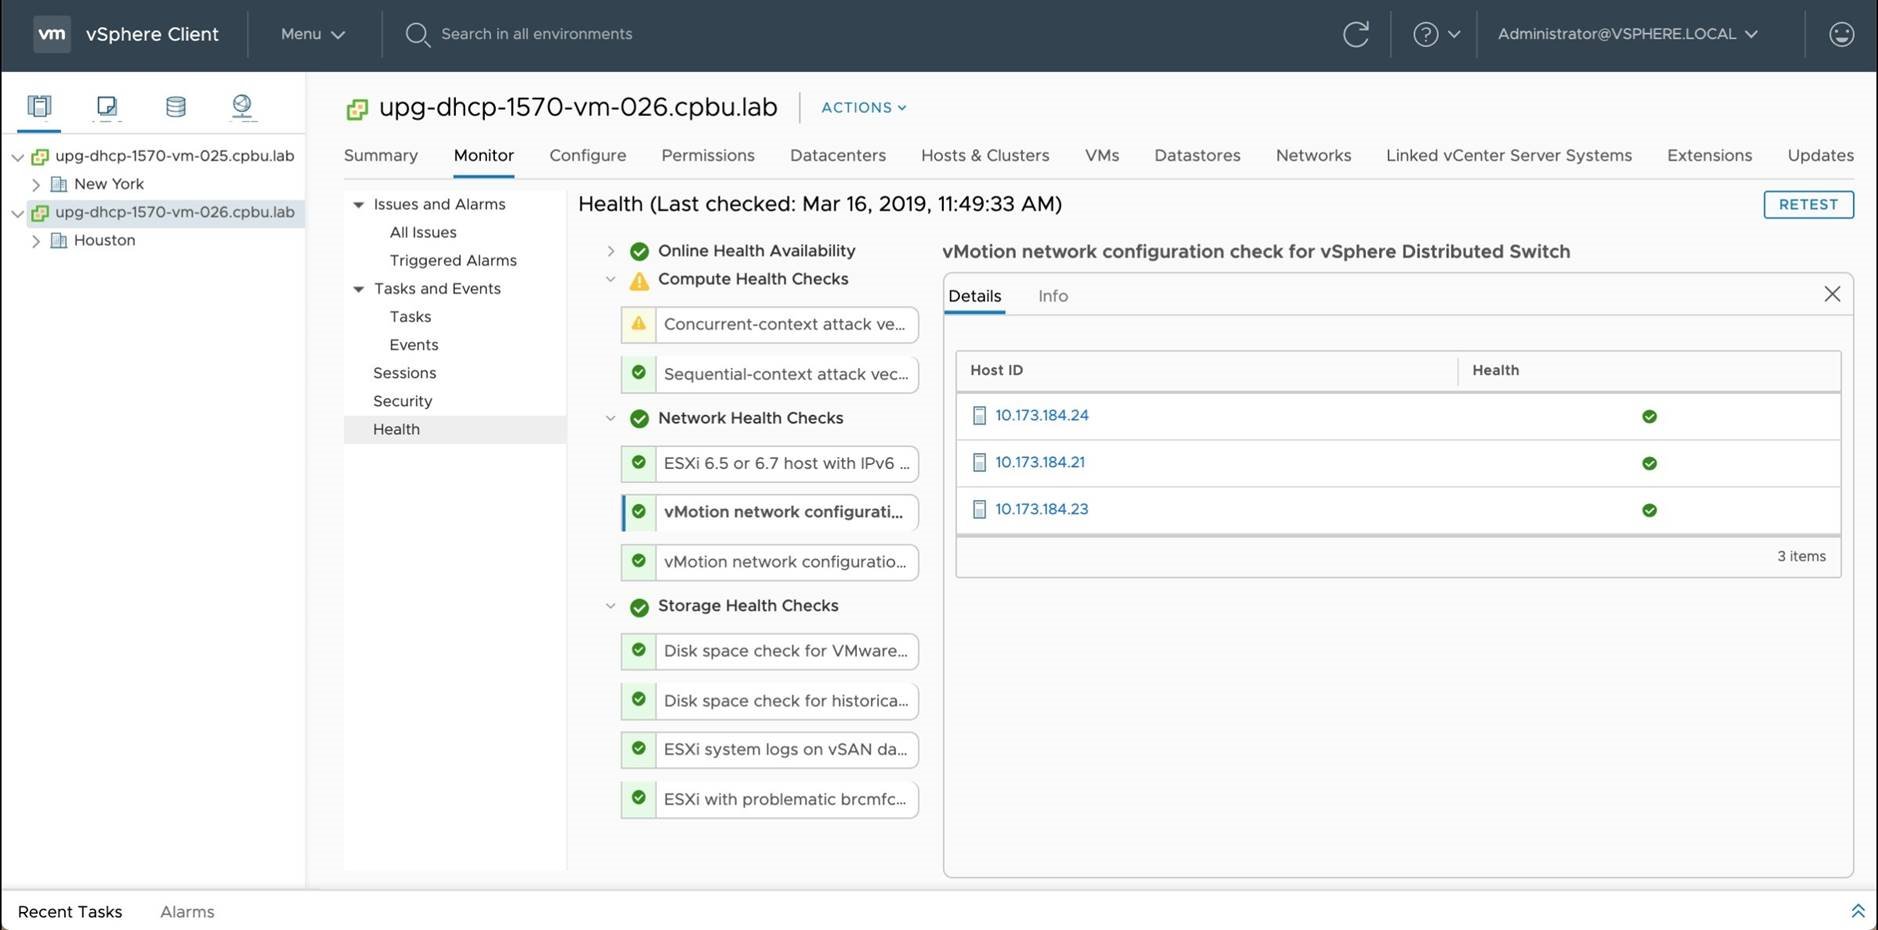
Let's dig in and review why there is a Yellow alert under the Compute Health Checks. Begin by selecting the health check named [Concurrent-context attack vector vulnerability in Intel processors]
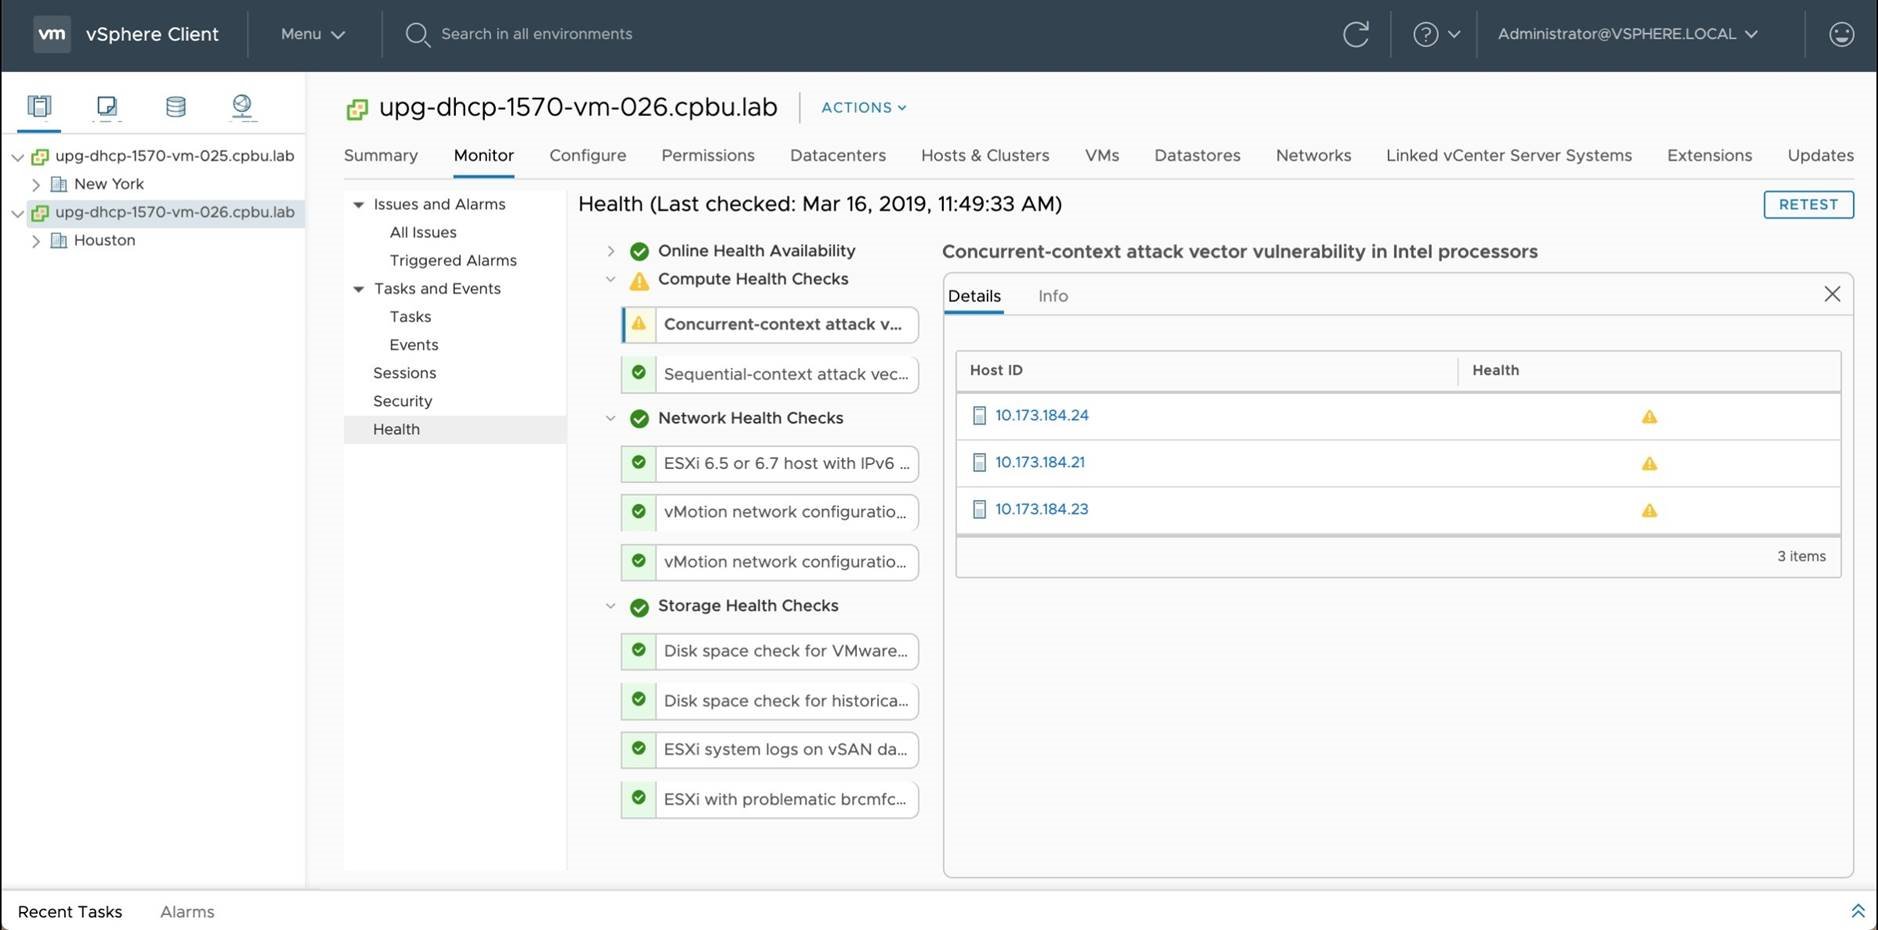
By clicking on the health check we are able to see what ESXi hosts are affected by the vulnerability. Click [Info] to learn more about this health check.
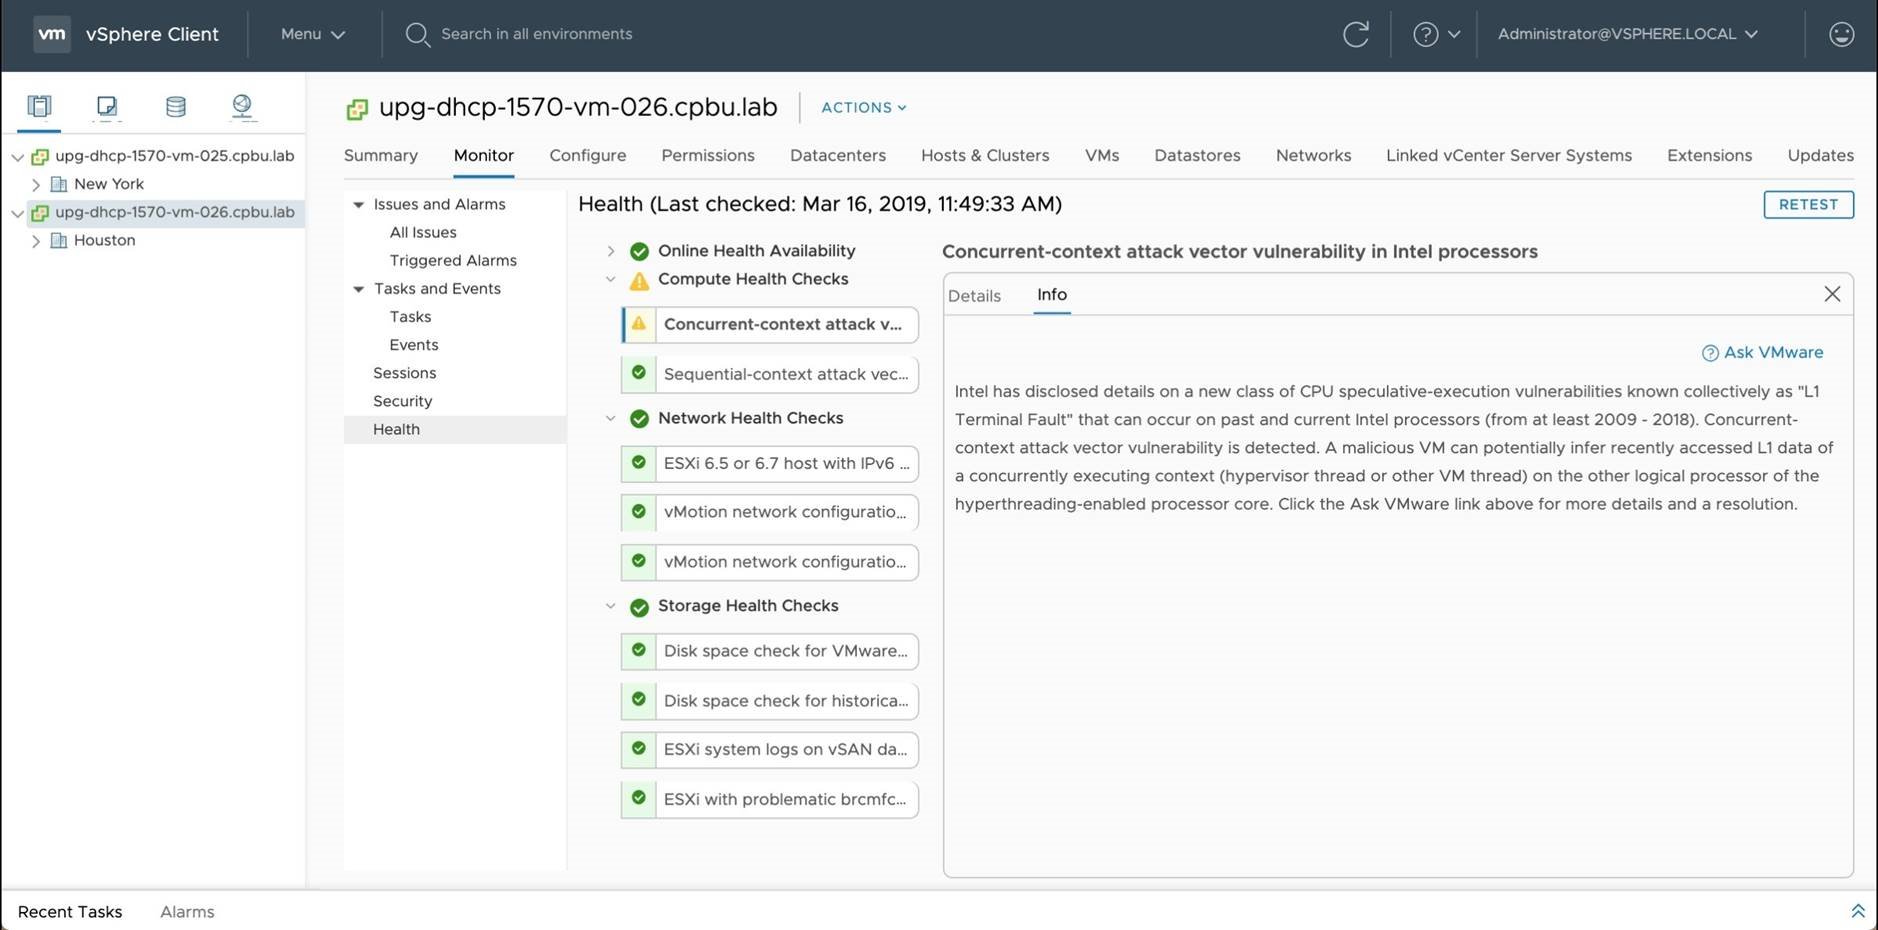
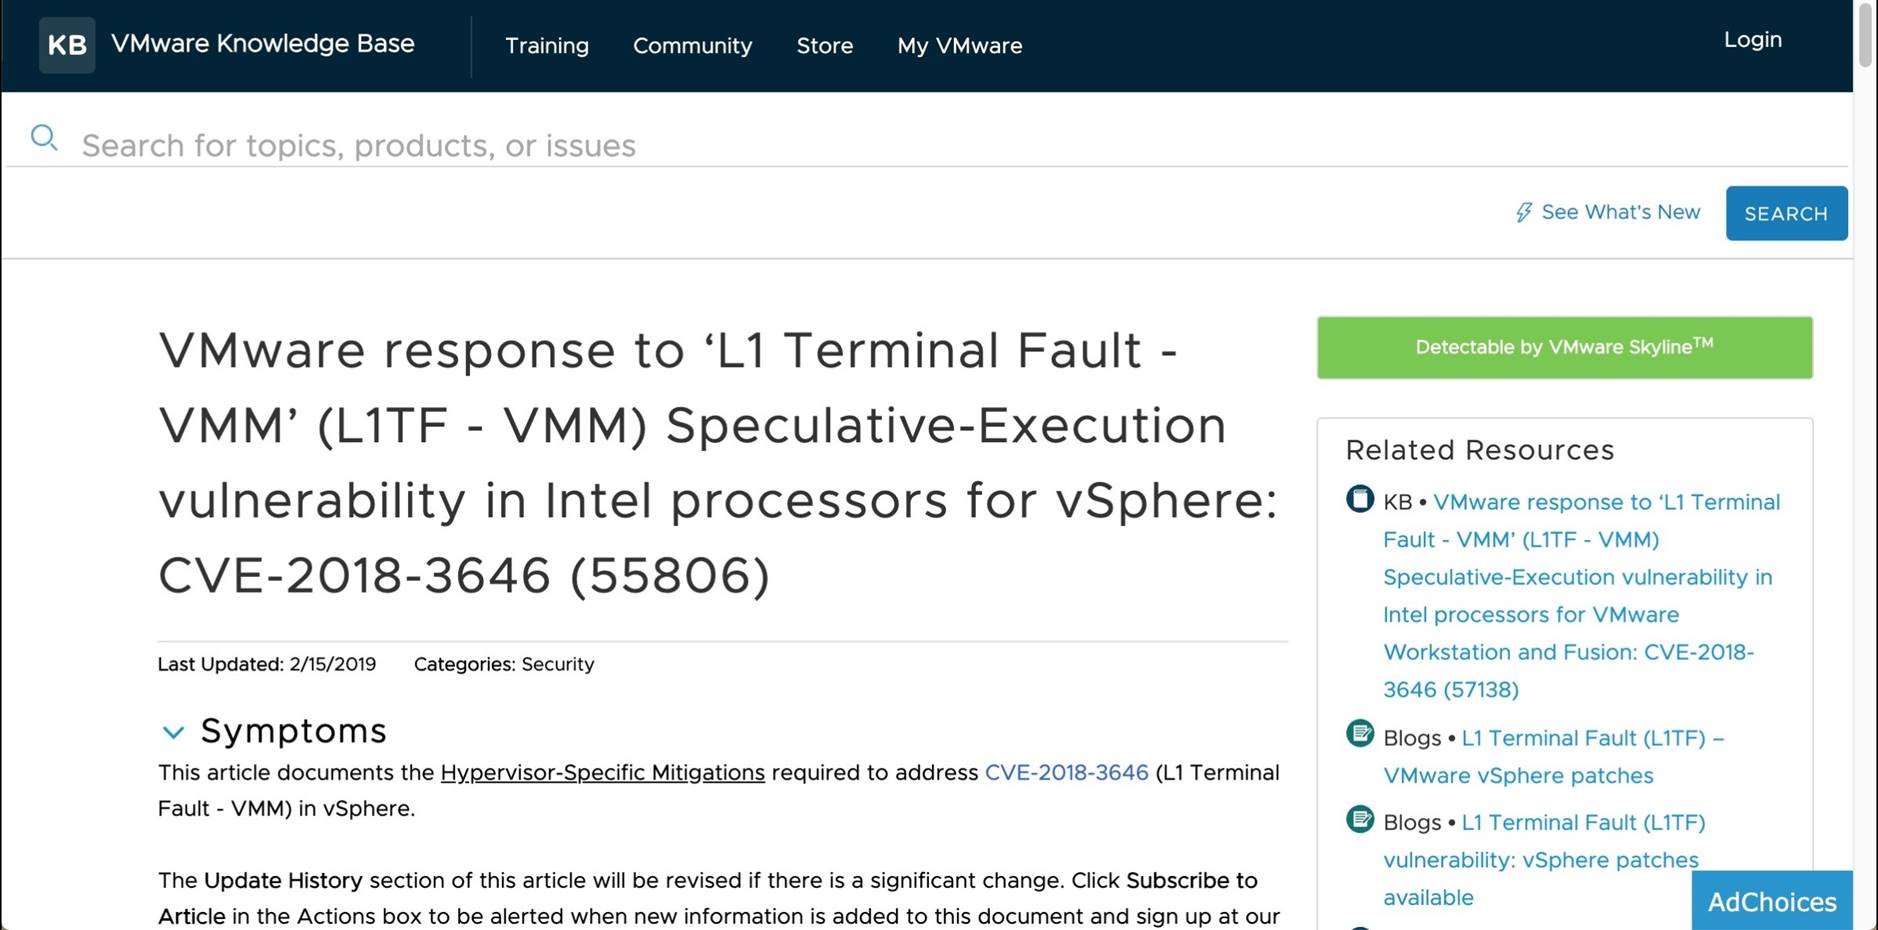
By clicking on a specific health check we can get more information. In this example we can read about Intel's "L1 Terminal Fault" execution vulnerability. By clicking [Ask VMware] you are redirected to a KB article to provide more information or steps to resolve the issue found.
Finding answers to an environmental issues has not been easier.
Let's review a few other health checks. Health checks are easy to understand as detailed information is always available on the Info tab. Click the Health Check to continue.
The Details screen quickly shows the offending systems. In this case, we have a healthy Green checkmark so no issues to report. Click [Info]
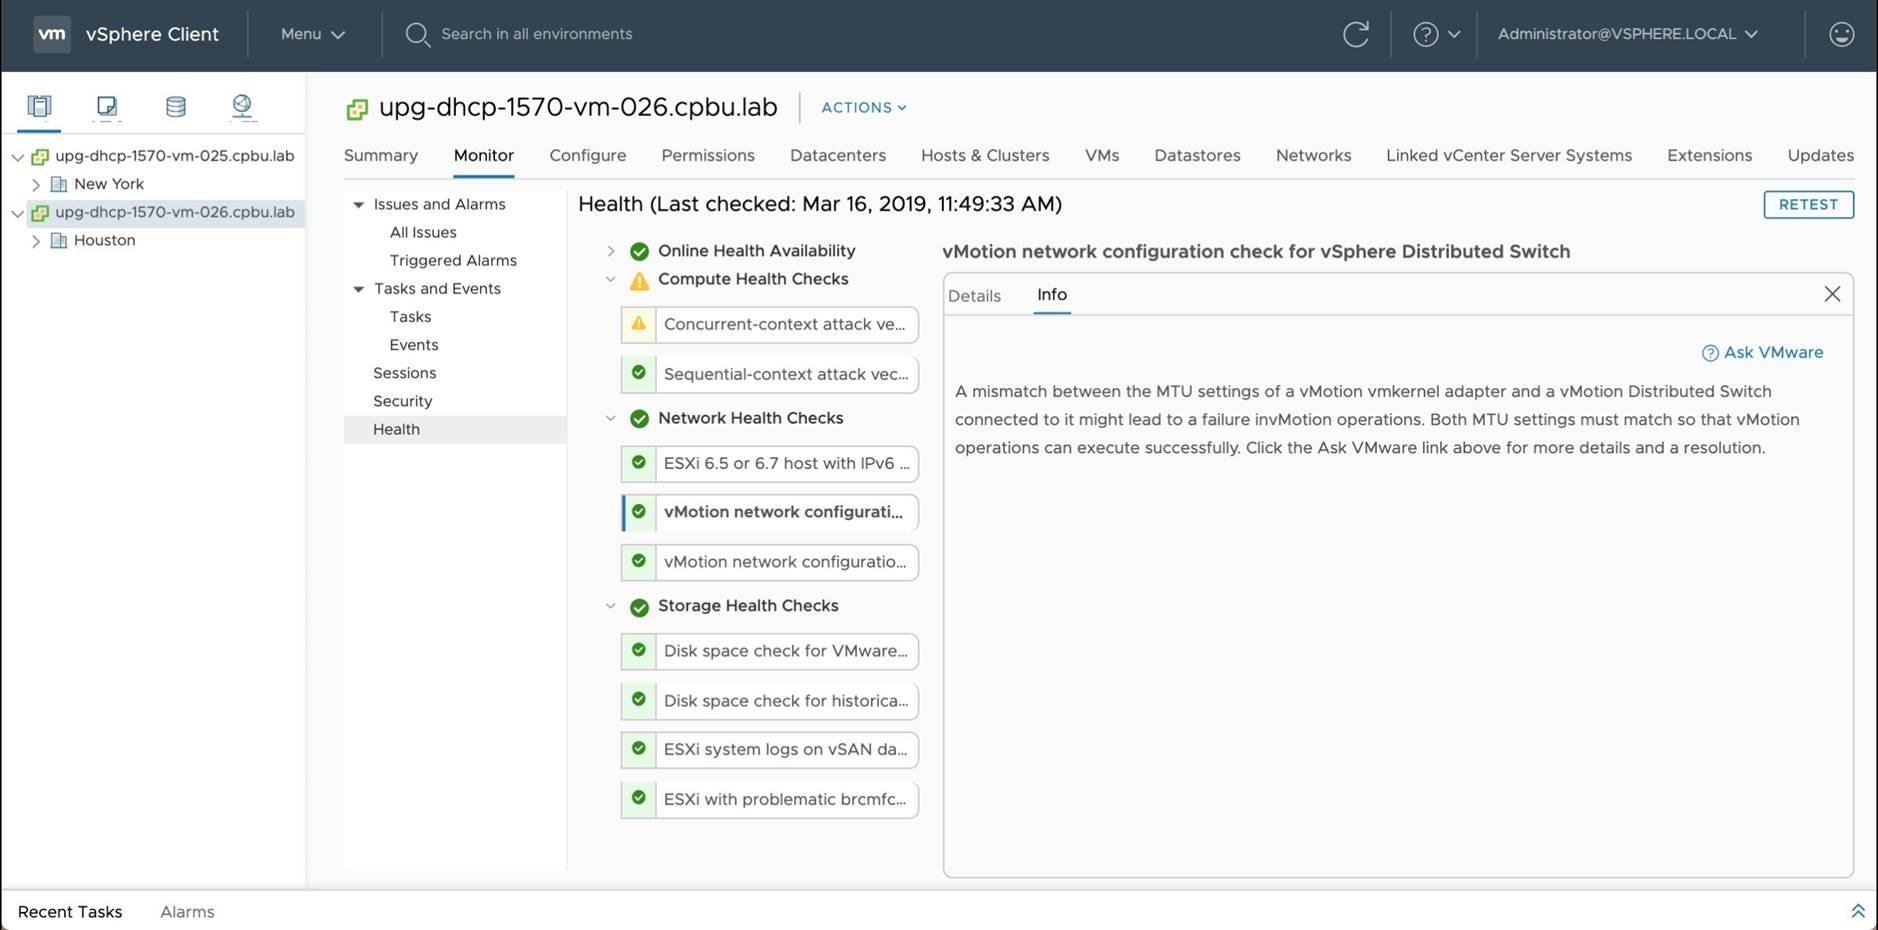
Understanding this potential environmental impact is made easy by reviewing the Info tab.
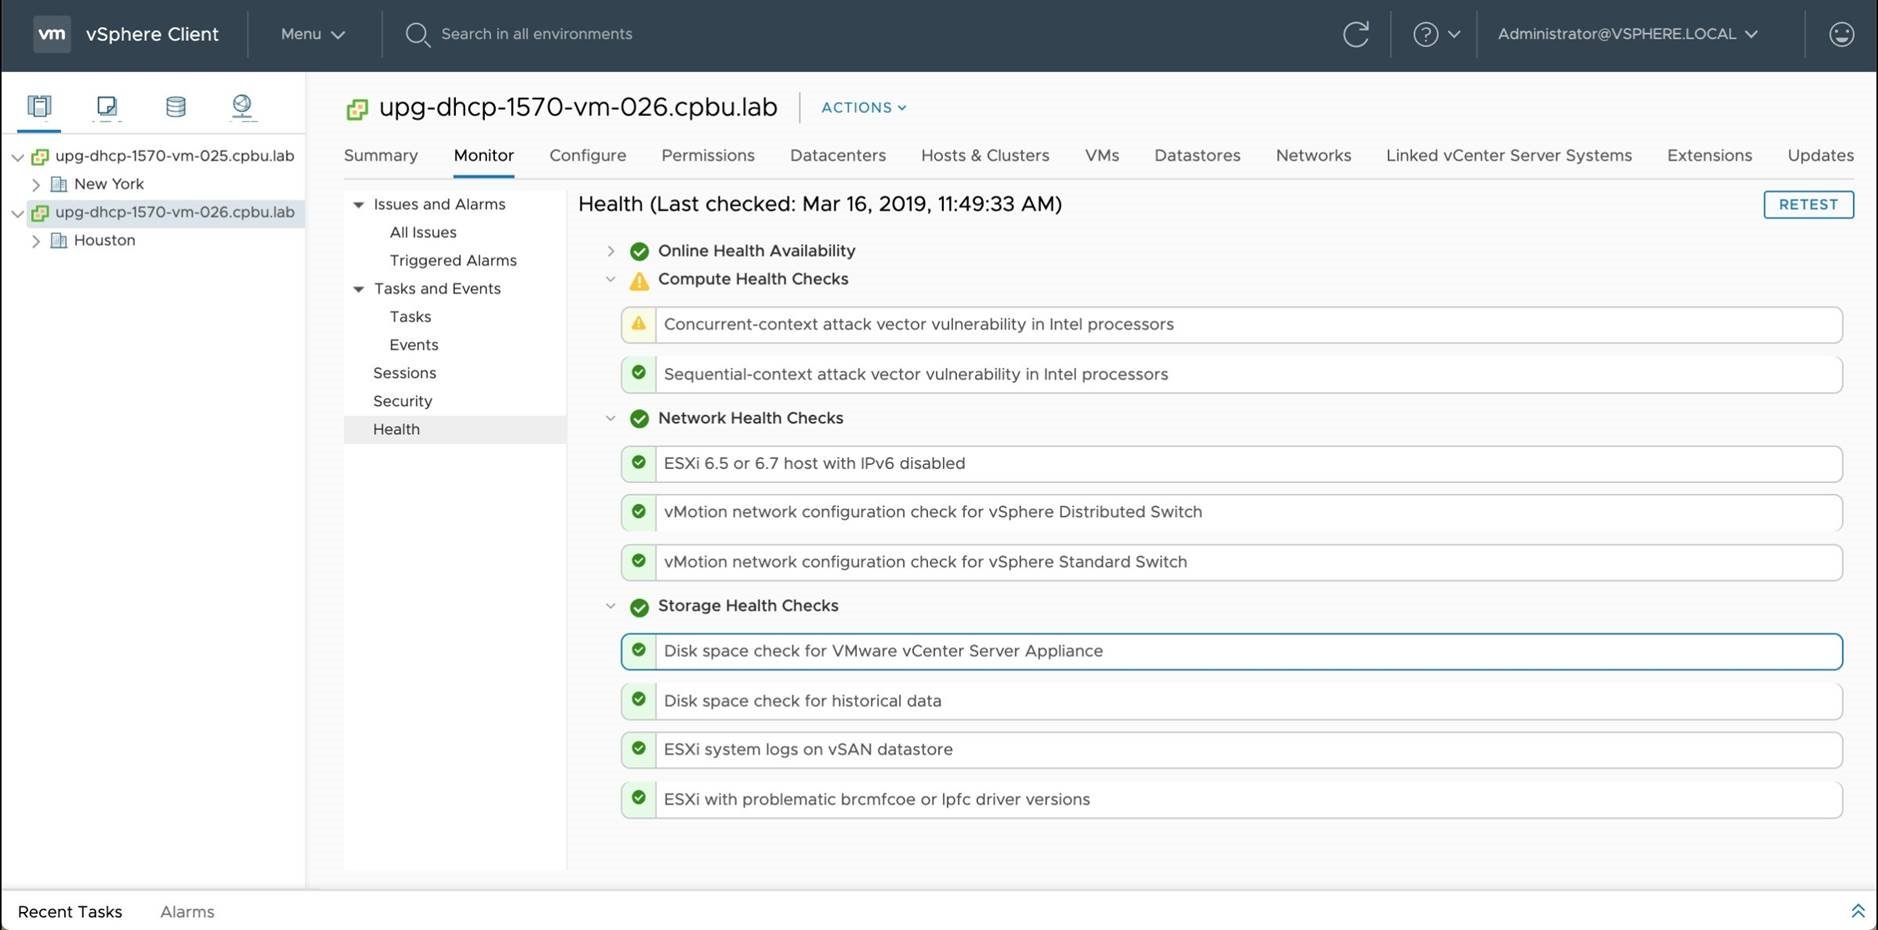
Click the next Health Check named [Disk space check for VMware vCenter Server Appliance]
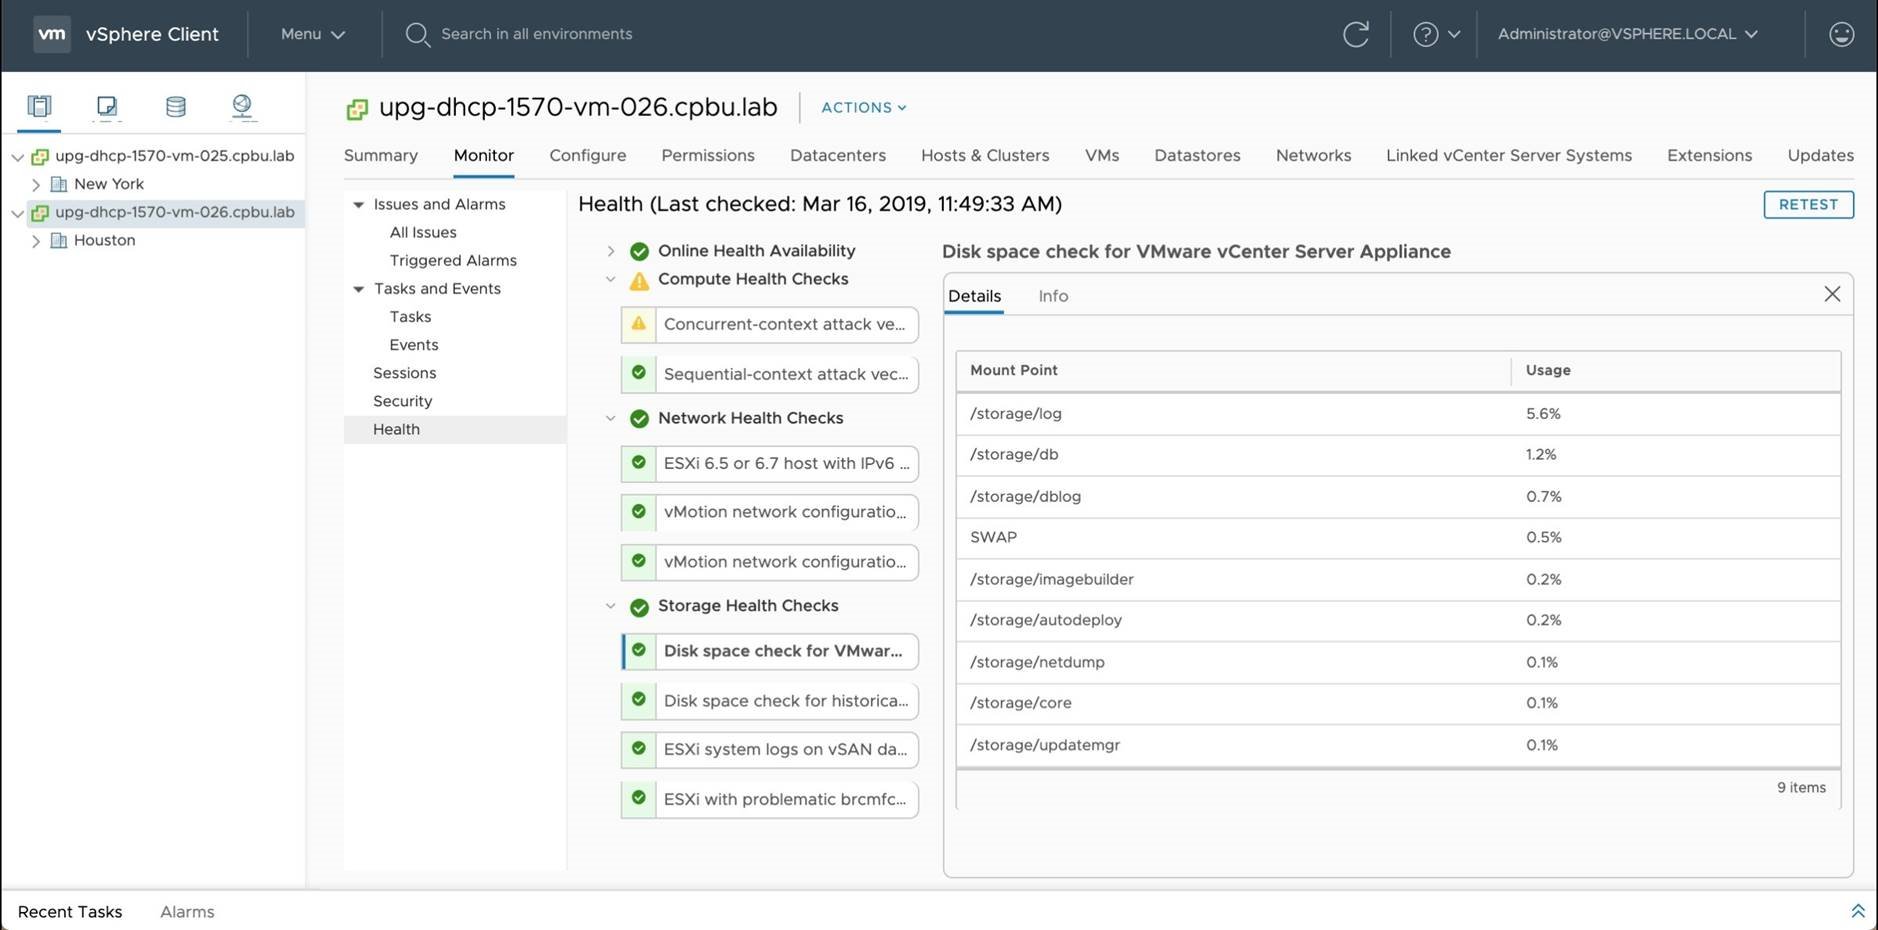
This Storage Health check is nice because it shows the Usage percents of each VMDK drive on the VCSA. By clicking [Info] we can learn more the affects of decreased disk space on the VCSA.
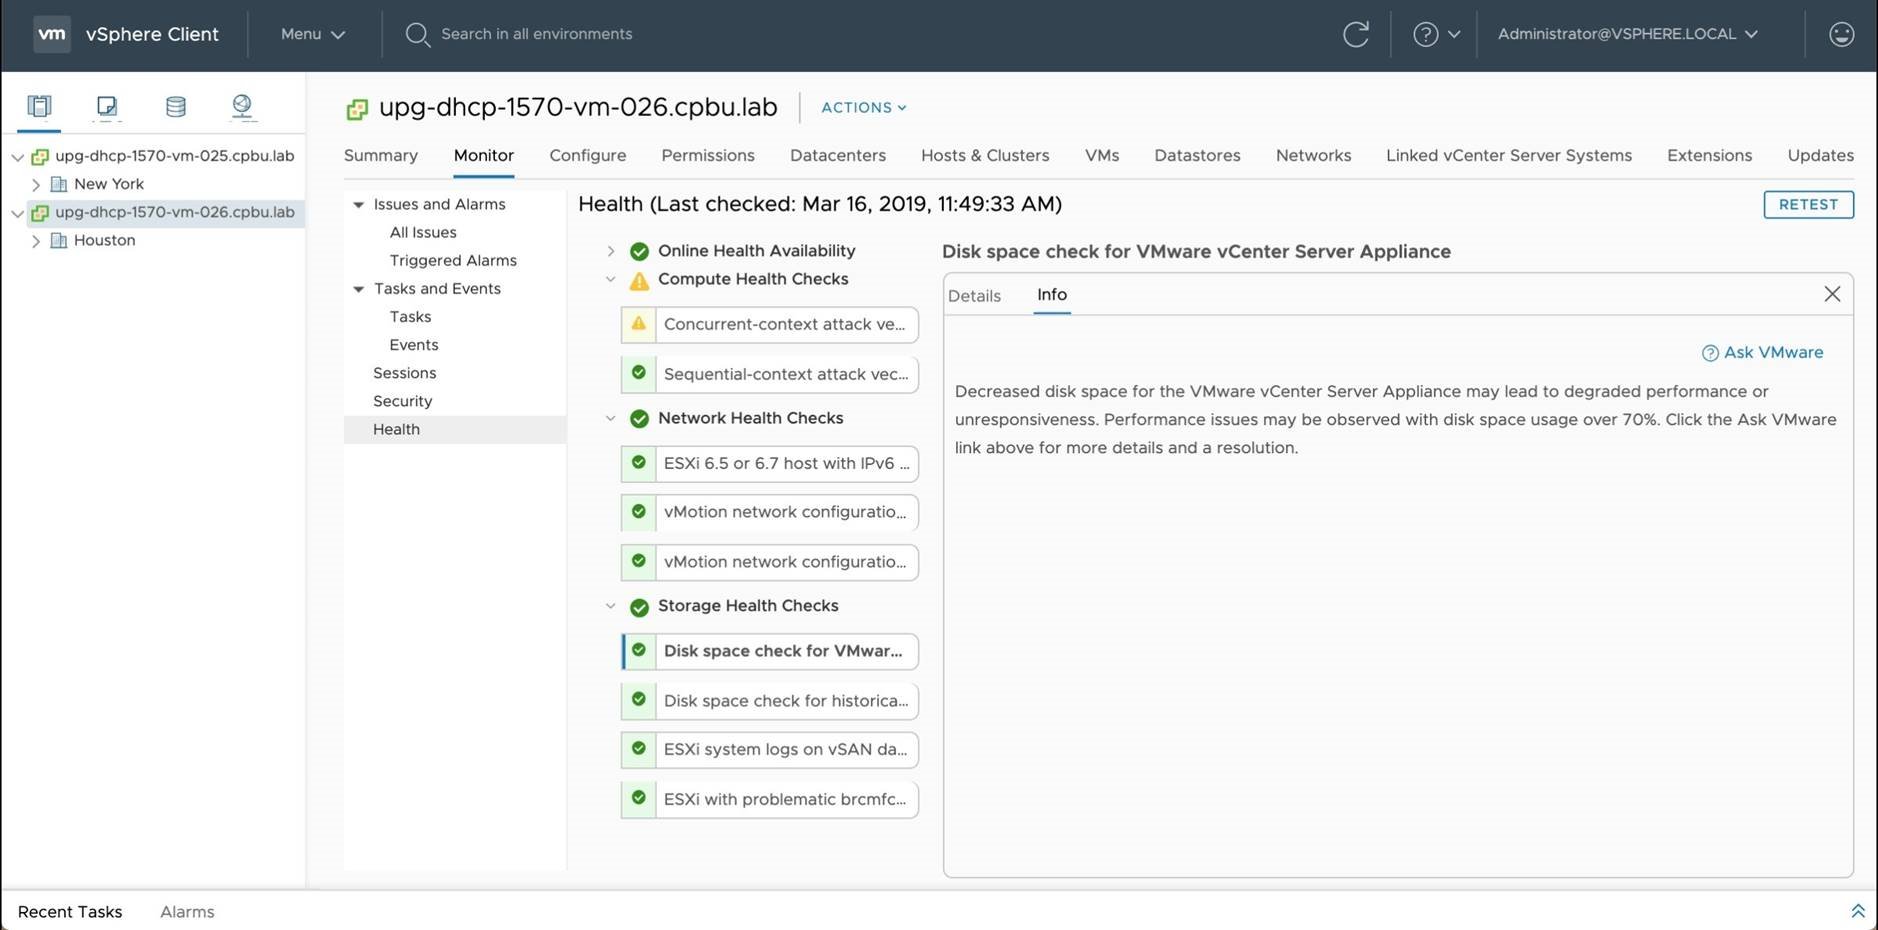
vSphere Health checks can also be a great place to learn the details of an environmental issue by simply reviewing the Info tab.
 This concludes the "Understanding vSphere Health" Walkthrough. To learn more about vSphere Health, begin here: https://blogs.vmware.com/vsphere/2019/01/understanding-vsphere-health.html Also, visit vSphere Central for more Product Walkthroughs: https://vspherecentral.vmware.com