
VMware Aria Suite in vSAN Environments
Executive Summary
Data center administrators are under tremendous pressure to deliver applications that perform better, with an infrastructure that is optimized for both performance and resiliency. These environments often generate a myriad of disparate bits of information about the infrastructure that powers an assortment of business applications and data. This data, which comes from multiple sources across the data center, and resides in the form of metrics, stateful and stateless conditions, and log events.
Fundamental questions arise when attempting to decipher this data. What does this information mean? What metrics deserve the most attention? How can intelligence into event data help drive smart choices in ongoing operations? How can this data help with strategic planning for growth? Infrastructure analytics helps answer these questions. By bridging the gap between raw metrics, and the desire for actionable steps by the administrator, Infrastructure analytics uses intelligence gathered from the infrastructure to help IT organizations achieve their goals of an optimized, efficient data center.
VMware vSAN plays a significant part in the transformation of infrastructures being dependent on proprietary hardware to a fully software defined data center (SDDC). Since vSAN provides a fully distributed storage solution that is integrated directly into vSphere, this strengthens the position of the hypervisor as the ideal control and monitoring plane for infrastructure analytics. VMware Aria Operations and VMware Aria Operations for Logs can offer a supreme level of infrastructure analytics for any vSphere environment, but especially those environments that are powered by vSAN.
This document is targeted at vSAN administrators who use VMware Aria Operations and VMware Aria Operations for Logs. It aims to provide tangible examples of operationalizing these solutions in a vSphere environment that is partially, or fully powered by vSAN. In addition to the examples provided, an assortment of operational tips, explanations, and guidance will be provided that will help an new and experienced users make the very best use of these solutions.
Role of VMware Aria Suite
VMware Aria Operations and Aria Operations for Logs offer a unique level of insight and intelligence of a data center. By using sophisticated analytics engines, VMware Aria take raw metrics, and provides meaning and context an environment. It extracts the data collected by VMware vCenter, as well as many other solutions through its extensible framework. A set of APIs are used to collect this data from vCenter and vSAN, and allows for further analysis and manipulation of data that is not available in vCenter.

Figure 1-1. The relationship between VMware vCenter (VCSA) and VMware Aria Suite of solutions
These two applications help deliver the following:
- A common control and monitoring plane ensuring data is being measured and interpreted in a consistent manner.
- Short-term and long-term visibility for more effective trending analysis.
- Flexible alerting and notification mechanisms tailored to suite an organization's needs.
- Insight and suggestions to common infrastructure metrics.
- Centralized log collection of various aspects of the software and hardware infrastructure.
- The ability to correlate log events to performance anomalies to provide contextual awareness of events.
- Deep level mining of log data for more effective trouble shooting and root cause analysis.
VMware Aria Operations and VMware Aria Operations for Logs focus on two different aspects of the data center, and can be used separately, or together. The distinctions between the purpose of each product will be provided later in this document.
VMware Aria Operations for Logs
VMware Aria Operations for Logs is a log aggregation, management, and analytics solution that gives the data center administrator an easy way to see context, correlation, and meaning behind otherwise obfuscated log content. VMware Aria Operations for Logs can aggregate log data from a variety of sources, and is extensible to over 40 applications using its content pack framework. When used correctly, with the right tools, log data can provide context and understanding to changing conditions in the data center.
VMware Aria Operations for Logs' streamlined integration with VMware's portfolio of solutions is immediately noticeable upon first use. As Figure 1-2 illustrates, log data is automatically collected from vCenter, analyzed, and presented in a manner that is easy to consume. Many of VMware Aria Operations for Logs' prebuilt dashboards offer unique intelligence around vCenter log data. It can be used to easily track changes in the data center without extensive knowledge by the administrator of the actual log entries.

Figure 1-2. A prebuilt vSAN Object Events dashboard as a part of VMware Aria Operations for Logs
VMware Aria Operations for Logs still uses the content pack framework from previous editions, but vSAN dashboards, as shown in Figure 1-3, are now included at the time of installation, making it easy to deploy and use in a vSAN powered environment. Out of the box, VMware Aria Operations for Logs provides the following:
- Ten, prebuilt vSAN dashboards that disseminate key log data entries. Intimate knowledge of log syntax not required.
- Captures and intelligently disseminates all vSAN urgent traces.
- User friendly drill-down filtering abilities all within the UI.
- Exposes back-end vSAN activity to better understand historical conditions and non-error related activities.
- Dashboard widgets with predefined filters to discern various host and object states.
- Dashboards can be cloned, and are fully customizable, allowing as a good stepping stone for additional customization.

Figure 1-3. A prebuilt vSAN Object Events dashboard as a part of VMware Aria Operations for Logs
VMware Aria Operations for Logs also allows for a user to easily drill into the log events and queries behind a given widget for further analysis. Figure 1-4 illustrates the "Interactive Analytics" view of the "Object Component State - Resyncing" widget found in the vSAN "Object Events" dashboard. Interactive Analytics are available from the home page of VMware Aria Operations for Logs, or within each widget.

Figure 1-4. "Interactive Analytics" view available in all widgets
While many associate VMware Aria Operations for Logs core competency as the ability to detect and find logged errors and failures, this overlooks one of its most valuable capabilities: Viewing non-error event data to provide a clear understanding of activities by the system. This provides a comprehensive understanding into a health operating data center, and is why many of the dashboards are focused on non-error event data.
RECOMMENDATION: Use the Interactive Analytics within a widget. By clicking on the "open in Interactive Analytics" icon in the upper right of a selected widget, this will jump to the Interactive analytics view, but do so using the query used by the widget being viewed. This can also be a helpful way to understand how queries are built in VMware Aria Operations for Logs.
VMware vSAN generates a high volume of log data. This log data is saved in a binary, compressed format to /var/log/vsantraces on each ESXi host in a vSAN cluster, and is comprised of two types of data.
- vSAN urgent traces. This is log data that includes all critical event messages from vSAN.
- vSAN non-urgent traces. Additional low-level logging for vSAN that is not designed for human consumption.
When redirecting vSAN trace-level messages to a syslog server , urgent traces will continue to be written to the host. Urgent traces are simultaneously decompressed, and converted from binary to human readable format as they are forwarded to a syslog server. Acting as a syslog collector, VMware Aria Operations for Logs will ingest vSAN urgent traces, and make them available for prebuilt, or custom dashboards and widgets. The installation of it in an environment will automatically configure the vSAN hosts to send vSAN urgent traces to VMware Aria Operations for Logs.
VMware Aria Operations for Logs is primarily focused on collecting logs from vCenter, and other sources through it's "content pack" framework. ESXi host crash dumps and other host logs are NOT collected by Aria Operations for Logs. Furthermore, due to the intensity of writes of log data, hosts that use a USB/SD device as an ESXi boot device are not used in the same way if booting ESXi from a traditional storage device. Booting ESXi from a traditional storage device (SSD, HDD, SATADOM) offers much more flexibility than from USB/SD , and may be a design consideration to reevaluate in both vSAN, and non-vSAN clusters.
Integrated vSAN dashboards in VMware Aria Operations for Logs
The following information describes each dashboard included in the VMware Aria Operations for Logs content pack for vSAN, which is now integrated directly into version 4.5 and newer.
Host State Information
The Host state information dashboard, as seen in Figure 1-5, is a good overview of how vSAN treats host membership and roles. Its primary focus will be around activities of the host itself, such as additions or changes in host membership to a vSAN cluster.

Figure 1-5. Host State Information Dashboard
This dashboard consists of seven widgets, and will capture log entries for hosts entering and exiting maintenance mode, vSAN host discovery events. It will also capture when hosts rejoin a cluster, and role initialization. This dashboard is most helpful in understanding if a vSAN host is being recognized correctly.
Disk group Failures
The disk group failures dashboard, as displayed in Figure 1-6, is a collection of widgets that look a disk group activity. Disk groups are an important construct of vSAN, and this dashboard gives visibility to disk group failure events that are logged by vCenter, but not readily visible.

Figure 1-6. Disk group Failures Dashboard
All seven widgets in this dashboard will report any event activity associated with the one or more disk groups of each host in a vSAN cluster. Note near the bottom of Figure 1-6 the "Component creation failure" widgets. These can be extremely helpful in understanding why an object isn't able to meet a specific policy compliance due to insufficient capacity remaining, or exceeding the component maximum for the host.
Networking
The networking dashboard, as shown in Figure 1-7, filters log events display vSAN network creation events in a cluster. It is common to see events in this dashboard when hosts are coming online, or vSAN is being enabled on the hosts across a cluster. These are not errors, but simply confirmation that vSAN is now using a specific VMkernel NIC on a specific host for vSAN traffic.

Figure 1-7. Networking Dashboard
The networking dashboard contains two widgets, but can work nicely in conjunction with the "Host State Information" dashboard, or perhaps other network related dashboards found in the content pack for vSphere. East-west host connectivity is critically important to the operation of vSAN, and using this dashboard with other dashboards found in the vSAN and vSphere content packs will provide the visibility needed to understand if there are any issues with east-west connectivity.
Congestion
The Congestion dashboard, displayed in Figure 1-8, aims to provide better visibility of events generated from congestions. “Congestions” is a unique measurement introduced to vSAN. It’s how vSAN measures pressure throughout the stack, and use these measurements to introduce flow control to smooth out this traffic so that VMs have enough resources for guest VM storage needs.

Figure 1-8. Congestion Dashboard
This dashboard has five widgets that capture congestion related log events. This dashboard can be most helpful when viewed in conjunction with the congestion metrics provided in the vSAN performance service. The value of the congestions metrics is not for meaningful interpretation of an absolute value, but identifying a change over the course of time. Capturing log events related to congestions can provide more context behind any spikes or other statistical outliers found in the vSAN performance service.
Object Configurations
The object configurations dashboard shown in Figure 1-9 takes a high-level view of activities of objects. This will generally report activities when vSAN is seeing that an object isn’t meeting compliance with its assigned storage policy, or perhaps some other activity such as assigning a policy to a new or existing VM. This dashboard, in combination with ”object events” dashboard are often the two most useful dashboards in the content pack for vSAN.

Figure 1-9. Object Configurations Dashboard
The seven widgets in this dashboard capture events such as create (placement), change, and repair configurations, as well as rebalance, decommissioning, cleanup and vote rebalance configurations. As with many other widgets found across dashboards in the vSAN content pack, log events such as object configuration changes are not necessarily an alert to something not operating as expected. These log events help capture log entries in a manner that can provide context to some other operational activity.
Decommissioning
Figure 1-10 shows the Decommissioning dashboard. This dashboard focuses primarily on hosts that are entering maintenance mode. Entering maintenance mode may be for planned maintenance activities, or in preparation for host or disk group decommissioning. Event activities will be captured for all of these conditions.

Figure 1-10. Decommissioning Dashboard
The six widgets in this dashboard can often be helpful in rolling upgrades across one or more vSAN clusters, as you can see the order in which hosts went through an upgrade process. A "disk decommissioning failed" widget can assist in situations where disks are unable to be decommissioned from a disk group, or entire disk groups are unable to be decommissioned successfully.
Configuration Failures
The configuration failures dashboard, as seen in Figure 1-11, presents widgets that are focused on attempting to configure and object based on a certain policy. If the environment cannot accept a particular performance or protection level for a VM based on the environmental conditions, such as cluster size, and disk layout, vSAN prevent that policy from being applied, and will generate an event. These types of events will show up in the configuration failures dashboard.

Figure 1-11. Configuration Failures Dashboard
The six widgets in this dashboard target specific failure events in configuration changes. These are most commonly due to policy changes attempting to be made to a VM, but the cluster does not have the required conditions for support. For example, errors of "Insufficient fault domains" could be a result of attempting to change a VM's primary level of failures to tolerate (FTT) of 3 while having less than the required minimum level of hosts (7) to support FTT=3 when using a failure tolerance method (FTM) of RAID-1 mirroring.
Operation Failures
The dashboard shown in Figure 1-12 is a “failures” based dashboard that targets vSAN related operations, and if they did not end in success. The types of failure events captured here focus on the creation and configuration for objects and components. It will also touch on some levels of congestion, and resync operations.

Figure 1-12. Operations Failures Dashboard
The Operations Failures dashboard consists of five widgets. Two of the widgets capture activities around resync start events, and ingress congestion. These are included in this dashboard, as often these types of events will be related to each other. For example, object component creation failure events, which is monitored in this dashboard may be the result of network connectivity or partitioning issues. Therefore, having resync operation start events in the same dashboard can offer additional insight into possible causes.
Health
The Health dashboard, as shown in Figure 1-13, gives a good overview of health status changes for object components, capacity devices, and cache tier devices. In particular, the disk health changes may be correlated to degraded device handling events as seen in the vSAN UI in vCenter.

Figure 1-13. Health Dashboard
This three-widget dashboard is an effective way to determine if is a historical issue with a device that over the course of time, was not noticeable in the vCenter UI. Permanent Device Loss (PDL) events can be the result of failed devices, or a supporting device such as a storage controller. Occasionally, the disk health change widget may report component "absent" messages which may be part of other operations.
Object Events
The Object Events dashboard shown in Figure 1-14 reports component state changes. This dashboard provides an easy way to track when a component that has gone into an undesired state (degraded, absent, stale) and seeing potential related activities over a period of time.

Figure 1-14. Object Events Dashboard
This dashboard consists of five widgets, and may be the most useful dashboard integrated into the vSAN content pack . The state changes provide context to a series of events that otherwise may go unnoticed. For instance, this dashboard will immediately report what objects lost "liveness." This will also be reflected in the object component states of degraded, absent, or stale. Subsequent resyncing events are captured in the "Object component state - Resyncing" widget at a time based on the type of failure that occurred. Component resyncing can begin immediately if vSAN receives a sense code that places that device in a degraded state, or resyncing can begin 60 minutes after a period in which an object component went absent.
RECOMMENDATION: Do not be overly concerned if you do not see much activity in vSAN related widgets. Often times VMware Aria Operations for Logs may not always show a lot of information in the dashboards. This is quite common for environments that do not have much activity on them, have fully operational hardware, or do not consume much capacity. Lack of data in VMware Aria Operations for Logs is not a bad thing, and will likely report more events once there is more activity in the environment as capacity and workload increases.
VMware Aria Operations
VMware Aria Operations provides a window to all monitoring, events, and analysis of metrics in a vSphere environment. VMware Aria Operations primary point of data collection comes from vCenter, where it consumes raw metrics and events for further analysis and correlation. VMware Aria Operations is built on an extensible framework that allows it to collect data from dozens of types of sources, including guest OS and other application specific information. Extending its functionality can be done quite easily through the VMware Solutions Exchange Marketplace , where purpose-built management packs can be downloaded and installed to tailor VMware Aria Operations specifically for a given environment.
Since VMware Aria Operations uses data collected from vCenter Server, it takes advantage of vCenter's role as a control and management plane, and reshapes the data in a number of ways. This level of infrastructure analytics offers up insight into a data center that would otherwise be difficult to decipher across disparate, raw metrics. Figure 2-1 shows an "Operations Overview" dashboard that succinctly highlights the top VMs experiencing CPU contention, guest memory utilization, and disk I/O latency.

Figure 2-1. A prebuilt "Operations Overview" dashboard for all vSphere environments
Out of the box, VMware Aria Operations provides the following:
- Four, prebuilt vSAN dashboards, as shown in Figure 2-2, with multi-cluster visibility and analytics.
- Dashboards display vSAN and non-vSAN metrics together to show critical correlation across various resources.
- Dashboards can be cloned, and are fully customizable, allowing as a good stepping stone for additional customization.

Figure 2-2. Locating the four prebuilt vSAN dashboards.
VMware Aria Operations uses vSAN's enhanced set of APIs to fetch data collected by the vSAN health and performance service. The vSAN health and performance service was introduced in vSAN 6.2, and provides a way for vSAN administrators to look at basic performance metrics of vSAN directly in vCenter. Unlike other metrics, vSAN performance metrics are not stored in vCenter. It is housed as an object that resides on the vSAN datastore. With each subsequent release of vSAN, additional metrics have been exposed in the performance service. However, the metrics in the performance services are not customizable, and have a limited window in which data can be viewed (1 hour to 24 hours), and a limited retention time (90 days). VMware Aria Operations fetches this vSAN performance data, and provides the user with much more flexibility in manipulation and retention of the data. VMware Aria Operations requires that the vSAN health and performance service be enabled to properly collect vSAN related metrics.
Many of the integrated vSAN dashboards use a similar approach in the layout of the dashboard. As shown in Figure 2-3, the dashboard presents aggregate statistics of all clusters across the top of the dashboard, while the lower half of the dashboard will present metrics only for the cluster selected.

Figure 2-3. Layout of a vSAN dashboard
VMware Aria Operations uses the Clarity UI , which offers a new style of widget that displays a metric as a single value, and "sparkline" below each number. This sparkline will show a time-based history of the measurement in the form of a line graph. These are interactive in two ways. As shown in Figure 2-4, moving the mouse cursor across the sparkline will show the value of the metric for the specified point in time.

Figure 2-4. Hovering over metrics displaying sparklines
A double-click on the sparkline will provide a "Details" window that allows for closer inspection of the metric. As shown in Figure 2-5, a user can interactively zoom in and out on a particular area.

Figure 2-5. "Details" view of metric presented as a sparkline
The transition to a new HTML5 based user interface, and improvements with the API used by Aria Operations to collect vSAN data means that Aria Operations now has the ability to show more data in useful ways than ever before.
Integrated vSAN dashboards in VMware Aria Operations
VMware Aria Operations includes four built-in dashboards to immediately address the most common vSAN administration needs. The following information describes each integrated vSAN dashboard included in VMware Aria Operations
vSAN Operations Overview
The vSAN Operations Overview dashboard aims to provide a broad overview of the status of one or more vSAN powered clusters in an environment. As shown in Figure 2-6, this dashboard allows an administrator to see aggregate cluster statistics, along with cluster specific measurements. Not only does this dashboard touch on some of the key indicators of storage such as IOPS, throughput, and latency, it also provides other measurements that contribute to the health and well-being of the cluster, such as the host count, CPU and Memory utilization, and alert volume.

Figure 2-6. vSAN Operations Overview Dashboard
The horizontal widget near the top of the screen shows the aggregate statistics for all vSAN clusters. A double-click of those metrics allow for further detailed analysis. Upon selecting the desired vSAN cluster in the widget located near the left side of the screen will automatically update the eight other widgets in the dashboard to show vital statistics for the selected vSAN cluster.
Unique to this dashboard is the "Alert Volume" widget. This will show a time-based representation of alerts in a vSAN environment for the past seven days. Each category of an alert can be clicked on to toggle off/on the visibility of that type of alert. Viewing alter history in this manner is especially important for issues that may be transient in nature, and would be readily visible when looking at active alerts at a later date.

Figure 2-7. Alert Volume widget
vSAN Capacity Overview
The vSAN Capacity Overview dashboard provides a wealth of vSAN capacity information not available in the point-in-time storage capacity statistics found in vCenter. This dashboard takes advantage of VMware Aria Operations' ability to capture capacity utilization over a period of time, which offers extensive insight into past trends of capacity usage. Capacity is about more than just storage resource usage. It is about CPU and memory capacity as well, and as shown in Figure 2-8, this dashboard gives a window in to remaining CPU and memory capacity for a vSAN cluster. This data, paired with the storage utilization data will give an administrator a better understanding on if scaling up (adding more storage to each host) or scaling out (adding more hosts) will be the best approach for an environment.

Figure 2-8. vSAN Capacity Overview Dashboard
This dashboard presents ten widgets. The three across the top of the dashboard represent the aggregate vSAN capacity statistics for all vSAN powered clusters. Many of the widgets use the sparkline based metrics described earlier in this document. Highlighting the desired cluster will update the widgets showing the cluster-specific metrics. As shown in Figure 2-9, the right-hand side of the dashboard will display a 30 day history of deduplication and compression ratios, and how that impacts overall cluster usage.

Figure 2-9. vSAN Cluster level deduplication & compression rates
NOTE: Variability in deduplication and compression ratios is normal behavior. The number and type of new VMs provisioned, object space reservation (OSR) settings, disk group layout, the ability of new data to be deduplicated or compressed, and the activity level on each host are among the many reasons behind the variability. Storage systems rely heavily on the need for free storage space, and this variability should be factored in when maintaining the recommended free space in a vSAN cluster.
The dashboard also gives a visual representation of the balance data across the storage devices in each host across the vSAN cluster. Each filled in rectangle represents a storage device on the host, and will be sized and colored based on the percentage of space used.
The bottom portion of the dashboard targets CPU and memory capacity. On the bottom left hand side of the dashboard, and as shown in Figure 2-10, a "Capacity Remaining" widget displays a score indicating the remaining computing resources as a percent of the total consumer capacity.

Figure 2-10. Capacity Remaining widget
The "Time Remaining" widget, as shown in Figure 2-11, displays how much time remains before the resources of item are exhausted. The time remaining score can be used to plan for acquisition of additional resources, for better incremental purchasing strategies.

Figure 2-11. Time Remaining widget
The capacity dashboard can summarize the capacity needs of one or more vSAN clusters that is simply not available with the vSAN capacity view in vCenter.
Troubleshoot vSAN
The Troubleshoot vSAN dashboard assembles a collection of alerts, metrics, and trending results to help determine the source of what changed in an environment, and when the change occurred. It assembles them in a systematic, layered approach to assist with troubleshooting and root cause analysis of an environment.
As shown in Figure 2-12, the dashboard begins with widgets showing any active alerts for the cluster, and identify the hosts contributing to the alerts. Also displayed are key performance indicators at the cluster level. Highlighting the desired cluster will expose trending of cluster related resources (CPU Workload, Memory workload, Capacity remaining, etc.) over the past 12 hours. Widgets for VM read and write latency show a history of storage performance for the past 24 hours.

Figure 2-12. Upper portion of the Troubleshoot vSAN dashboard
Scrolling further down on the Troubleshoot vSAN dashboard reveals more widgets designed to drill into specifics of the hosts participating in the vSAN cluster. This allows the administrator to easily look at host specific elements such as disk groups, and host resource usage, and compare them to other hosts in the cluster. As shown in Figure 2-13, two widgets provide visibility to any I/O error activity on the hosts, such as I/Os canceled, and any bus resets on the disk group.

Figure 2-13. Middle portion of the Troubleshoot vSAN dashboard
The Troubleshoot vSAN dashboard also looks at the health and performance of cache and capacity disks of the selected vSAN cluster. These widgets allow you to choose from one of the seven defined data types, and will then render the amount of activity in the heat map, as shown in Figure 2-14. The data types that can be viewed include bus resets, commands canceled per second, and five types of SMART data measurements.

Figure 2-14. Bottom portion of the Troubleshoot vSAN dashboard
RECOMMENDATION: Use multiple tools to help pinpoint the root cause of an issue. VMware Aria Operations excels at the aggregation and analysis of a variety of metrics of an infrastructure, but often, other tools are purpose built and maintain special intelligence that may provide valuable insight to help pinpoint the cause of an issue. For instance, VMware Aria Operations for Logs might contain valuable log event messages generated in vCenter. VMware Global Support Services (GSS) may choose to collect host logs for deep granular analysis of events upon a failure. Taking advantage of all available tools, and enabling the "vSAN Support Insight" through the Customer Experience Improvement Program will help produce the quickest path to a resolution of an issue.
Optimize vSAN Deployments
The "Optimize vSAN Deployments" dashboard is designed to assist with migration efforts over to vSAN. The dashboard provides a comparison of critical storage metrics of a VM running on a data store running on traditional storage against a VM powered by vSAN. This dashboard recognizes the phased approach that can occur when transitioning to a new storage system, and is intended to monitor what matters most in the transition: the effective performance behavior between storage systems as seen by the application, or VM.
While each VM's workload will be unique, and not an exact moment by moment mirror of another VM's workload, one can compare similar systems effectively. For example, applications farms such as SQL clusters, ERP systems, SharePoint servers, or some other multi-tiered application use a cluster of VMs to provide back-end, middle-tier, or front-end services. Any of these examples would be an ideal scenario for comparison, as one of the systems in the application farm can be migrated over to vSAN, and compared to a similar system running on the legacy storage. In Figure 2-15, two systems with a nearly identical workload were compared, and this dashboard shows that the VM running on vSAN had a 10x reduction in latency as compared to the VM running on a traditional, all-flash datastore.

Figure 2-15. Optimize vSAN Deployments Dashboard
The two most important widgets are near the bottom of the dashboard. The widget on the lower left will show the aggregate virtual disk IOPS, read latency, and write latency of the selected VM running on a legacy data store. The widget on the lower right will show the same metrics of the selected VM running on a vSAN powered data store.
Thanks to the power of customization, you may wish to simplify this dashboard. This might allow you to utilize a larger portion of the screen for key metrics, and simplify operation, or reduce the time window of observation to a smaller window.
RECOMMENDATION: When using this dashboard, untick the line in the key of each widget that represents IOPS. This will change the display so that only read latency, and write latency are shown, and will help us better understand the real performance comparison between storage systems. Note however that each y-axis is independently scaled relative to the highest peak of a given time window. In the example provided in Figure 2-15, the latency of the VM running on vSAN (on the right) was below 1ms, while the latency for the VM running on a traditional all-flash array (on the left) was peaking at nearly 8ms.
Using VMware Aria Operations for Logs to better understand network connectivity issues in vSAN
Introduction
Hyper-converged infrastructures bring a change in architecture, and shifts dependencies of components in the data center. In traditional three-tier architectures, hosts were only responsible for compute resources. However, in a hyper-converged environment, hosts are also responsible for storing persistent data. As a distributed system, each host contributes to the storage capacity, storage performance, and data resiliency of the systems it is providing. With this change in areas of responsibility, it makes sense that what is monitored, and its relative significance should also be shifted as well. Let's look at one way that monitoring and alerting practices should be adjusted to accommodate HCI.
Hyper-converged solutions like VMware vSAN are highly dependent on the connectivity between nodes to provide access to all distributed storage resources. There can be many reasons why east-west connectivity can be intermittently or permanently interrupted. Typical reasons would include:
- Host NIC adapter port failure
- Host NIC adapter failure
- Host NIC driver issue
- Host NIC firmware issue
- Physical cable disconnection
- Physical switchgear disconnection
- Physical switchgear reboot
- Virtual network changes on switchgear (e.g. VLAN assignment changes)
Note that four of the eight reasons listed above could come as a result of another team performing tasks that might the virtualization team may be unaware of. With the increased level of importance on maintaining proper connectivity across hosts, administrators need a way to sufficiently monitor these traits in the data center. This topic will demonstrate how to use Log Insight with vSAN to gain better visibility with network connectivity issues for detection of changes.
Existing challenges
With a sophisticated health checks framework built right into vSAN, the administrator will be alerted to any current condition detected in an environment. When host connectivity issues occur, vSAN has the built-in logic necessary to reconfigure and repair the data to reflect the object's assigned storage policy. Even though vSAN can repair the affected objects accordingly, underlying network issues can cause a lot of unnecessary vSAN activity, and may compromise levels of performance and availability.
Host connectivity issues can be highly transient. A connection may drop for an intermittent period of time, and restore itself for some unknown reason. The outage may have been an anomaly, or a representation of a more systemic issue. Whatever the reason, the causes behind these undetermined outages warrant further investigation. vCenter was not designed to deliver a method to visualize current and past connectivity issues.
RECOMMENDATION: Audit your existing cluster to ensure proper redundancy of host network connectivity. There are several redundancy options for host connectivity , and determining the best approach is dependent on a number of factors. Applying common practices can help avoid unforeseen connectivity issues should some element of the host connectivity. See the vSAN Network Design Guide for more information.
Operational approach
The following example will demonstrate how VMware Aria Operations for Logs eliminates many of the operational blind spots described earlier. This example will show how to create a custom dashboard to visualize current, and past vSAN object component states, and how they may correlate with host connectivity issues.
Create new dashboard
- In Log Insight, under "My Dashboards" click "New Dashboard." Name it "vSAN Fabric Connectivity."
- Click on the "VMware - vSAN" content pack, and click the "Object Events" dashboard.
- Locate the "vSAN - Object component state - Absent" widget. Click on the gear icon in the upper right-hand corner of the widget, then click "Clone…"
- Select the destination dashboard of: "vSAN Fabric Connectivity" and click "Clone"
Customize new dashboard
- Click on "My Dashboards" and select "vSAN Fabric Connectivity."
- Hover over the right side of the widget, and click on the "Click to expand widget" button to use more of the screen.
- Click on the gear icon for the "vSAN - Object component state - Absent" widget, and click "Clone…"
- For a Name, type in "Connectivity issues with host NICs" and select the destination dashboard of "vSAN Fabric Connectivity" and complete the task by clicking the "Clone" button.
- Click on gear icon of new widget, and select "Edit in Interactive Analytics."
- Remove the first three filters, so that only the "hostname = exists" filter remains.
- Change the hostname from "exists" to "contains" and enter in the host names for one or more vSAN clusters.
- Click on "Add Filter" and select the "text" for type, while using "contains" for the condition. Enter in " vmnic* is down " (without the quotes) to establish the specific string of text it should look for in the logs.
- Click Save to complete, followed by "return to dashboard" to view the completed dashboard.
Result
The new custom dashboard will display a time-based view showing vSAN object component states of "absent" paired with notifications of host NIC connectivity issues. As shown in Figure 4, both widgets will indicate what host the events are associated with for easy diagnosis and root cause analysis, and align the time period for easy correlation between events. As with all dashboards in Log Insight, the custom dashboard provides an easy way to quickly adjust the window of time that is of interest.

Figure 3-1. New custom dashboard showing vSAN component states paired with host connectivity.
If there is a need to temporarily isolate a specific host with these dashboards, all of the other hosts can be deselected by clicking on the hosts in the right-hand side of each widget. In Figure 3-2, all hosts except ESX04 are deselected.

Figure 3-2. Temporary isolation of a specific host by deselecting hosts in key on right hand side of each widget.
The activity shown in Figure 5 reveals an interesting observation. Note that there are periods of time reporting issues with a NIC on host ESX04, while no component "absent" events are logged for vSAN. This can be a result of several factors. Ideally, virtual distributed switch (VDS) should have redundant uplinks to so that another uplink is available for failover. If the uplinks are sharing the same adapter, and there are issues with firmware or drivers for that adapter, this may interfere with the overall connectivity of the host. In some circumstances, physical switch issues could cause this behavior. In any event, these would be events worth looking into, and this dashboard will be a great way to identify issues that are not immediately visible using other forms of management.
Conclusion
Host connectivity is critical for any distributed storage solution. Pairing up VMware Aria Operations for Logs with vSAN is an ideal way to provide the visibility you need in order to ensure the infrastructure is performing the way it was designed.
Analyzing Capacity Utilization with VMware Aria Operations
Introduction
Managing resource capacity is often a continuous challenge in the data center. While resource capacity management can come in many forms, such as CPU, network, and memory, it is most often associated with storage capacity. VMware vSAN makes storage design and management significantly easier than with legacy architectures. In a vSAN powered cluster, multiple LUNS and datastores are replaced by a single datastore, where VMs are housed as objects. Scaling storage resources is also no longer an issue, since performance and capacity characteristics are driven by the design of the hosts that power a vSAN cluster, and not limited by the constraints of a storage array. Since local devices in hosts across a cluster are always aggregated as a single datastore, this gives an administrator and ability to granularly add to their capacity and performance requirements without incurring large capital costs.
vSAN provides basic performance and capacity metrics directly in vCenter. Capacity metrics for vSAN in vCenter are limited to global statistics for a single cluster at a time. These statistics also are limited to the current state of capacity utilization of the selected cluster. While the built-in capacity metrics provide basic utilization statistics, there is a tremendous opportunity for further analysis and insight. Understanding capacity utilization trends is one of the best ways to minimize potential shortages of capacity in the future. This topic will demonstrate how to use VMware Aria Operations with vSAN to gain better visibility of storage capacity usage.
Existing challenges
vSAN changes the capacity management paradigm for the better. With that comes a need to understand how capacity in vSAN is presented and consumed. vSAN uses a distributed architecture, and can apply performance and availability settings on a per VM basis using VMware's Storage Policy Based Management (SPBM) framework. This means that new factors are introduced in how capacity is served, and consumed. Factors influencing capacity presented and used are noticeably different in vSAN when compared to traditional storage architectures. Key differences include:
- Each host provides capacity and performance to a vSAN cluster.
- Some management activities can temporarily, or permanently change the amount of capacity available. This would include occurrences of planned, and unplanned host maintenance events.
- Adding storage capacity can be performed by scaling up or scaling out.
- Increasing capacity can be achieved by scaling up, where adding more devices, or higher density devices to each host increases the overall capacity of the cluster.
- Increasing capacity can also be achieved by scaling out, where adding hosts automatically increases the effective capacity of the cluster.
- Applying storage policies that dictate specific performance and protection settings at a per VM, or per VMDK level will result in VMs consuming different amounts of space on a vSAN datastore.
- Reducing capacity usage can be achieved by using space efficiency technologies such as deduplication and compression, using RAID-5/6 storage policies, or reducing the levels of failures to tolerate in storage policies.
Understanding how the variables above influence available and consumed capacity will help improve operations, management, and planning for an organization. Better understanding comes through enhanced visibility and analytics of infrastructure metrics. VMware Aria Operations is the solution that enhances visibility of raw metrics to provide correlation, and actionable insight through its analytics capabilities.
RECOMMENDATION: Aim for host resource uniformity across a vSAN cluster. Host uniformity across a cluster has always been a good design principle in any vSphere cluster, and is highly recommended. This recommendation is no longer limited to CPU, memory, and network connectivity. In a distributed storage environment like vSAN, asymmetrical implementations are fully functional, but just like CPU, memory, and network connectivity resources, can become extremely challenging in planned, and unplanned maintenance events. Host uniformity across a cluster minimizes the challenges of maintaining sufficient resource availability in the event of host, fault domain, and site failures.
The VMware Aria Operations Deduplication and Compression Savings widget
The vSAN capacity view in vCenter displays key statistics related to capacity of the selected vSAN cluster. As shown in Figure 4-1, this view focuses on the most current capacity statistics, with emphasis relating to used, versus available capacity. The static, point-in-time nature of this view does not allow the administrator to properly understand the dynamic nature of storage capacity utilization in an environment. This widget displays the same data provided in vCenter, but do so in ways that allows for a more detailed understanding of consumption.

Figure 4-1. The vSAN Capacity view in vCenter
In VMware Aria Operations, the vSAN Capacity Overview dashboard provides an easy way to show capacity information for each cluster managed by vCenter. As shown in Figure 4-2, the "List of vSAN Clusters" widget provides an enumerated, at-a-glance view of cluster capacity statistics and information. Viewing the capacity "remaining (%)" column is an easy way to see if all clusters are maintaining 30% or greater free space. Ensuring sufficient free space of a vSAN datastore is one of the most important steps for maintaining proper health of a vSAN cluster.

Figure 4-2. "List of vSAN Cluster(s) widget in the vSAN Capacity Overview Dashboard
This widget also provides a forecast of time remaining before cluster resources may be fully depleted. Like other widgets on this dashboard, (but not discussed in here) the "Time Left in Days" column extrapolates past consumption rates to forecast when additional resources may be necessary. It is an estimation of resources remaining, and does not reflect operational changes that could impact utilization rates, such as storage policy settings, host evacuation activities, or any other operations that may impact space efficiency.
Highlighting a cluster will update many of the widgets to reflect statistics specific to the selected cluster. The "Deduplication and Compression Savings" widget, shown in Figure 4-3, provides the current status, and 30-day history (fully adjustable) of the following:
- Deduplication and Compression Ratio
- Deduplication and Compression Savings (in GB)
- Deduplication and Compression Used (after savings)
- Deduplication and Compression Used (before savings)
Each one of the four boxes in this widget will show a value, and a "sparkline." This sparkline will show a history of that value, and will note the high and low value with an orange dot for that given time window. Hovering over the sparkline will show the value for the given point in time. The sparkline will automatically adjust its scale to show the maximum and minimum values in the view. The delta between the high and low value will determine the scale. The large numerical value reported in each box represents the latest value. It is not an average of the displayed time period.

Figure 4-3. Deduplication and Compression Savings widget
The window of time displayed can be adjusted in two ways. Clicking on the "Edit Widget" icon in the upper right-hand corner (the icon in the shape of a pencil) will present basic property settings of the widget, as shown in Figure 4-4. The period length can be easily adjusted as desired. The default for this widget is 30 days, as storage trends tend to develop over longer periods of time.

Figure 4-4. The "Edit Widget" dialog box
Viewing a more detailed time window can be achieved by double-clicking on the sparkline. As shown in Figure 4-5, a pop-up box will appear. One can drag and click over the time desired, or use the adjustable slider bars near the bottom of the box in order to resize the time period desired. Resizing the vertical height of this pop-up box can improve the usefulness of the view, as it will expose the parent timeline, and show the selected time window with a light blue color.

Figure 4-5. The pop-up box when double-clicking one of the views
The Deduplication and Compression Savings widget can offer a substantial amount of insight into understanding the changes in capacity consumed for a vSAN cluster. To better understand why an active cluster may see constant changes in the capacity consumed, let's review what occurs in vSAN when a new policy is assigned to an object, or the attributes of an existing policy are changed.
With vSAN, storage policies can be applied at a granular level. While they are most commonly applied on a per-VM basis, they can be applied at an object level: the individual virtual disks, or the VM home namespace. Since each storage policy may establish different performance and protection criteria for objects, this means that changing policies can influence the capacity used by an object.
Let's first look at the capacity usage for an object using a failure tolerance method (FTM) of RAID-1 mirroring, where the level of failure to tolerate (FTT) is changed from 1 to 2. Figure 4-6 shows an object using an FTM of RAID-1 mirror, with an FTT=1. The second copy/replica will consume approximately the same amount of space as original copy. Figure 4-6 represents this used capacity as "overhead." When an object's policy is changed to FTT=2 as shown in step 2, an additional replica of the object will be constructed, and will result in the object consuming more "overhead" capacity to comply with the new policy setting. In the example below, the total capacity consumed for the object went from 2x, to 3x.

Figure 4-6. Consumed capacity when changing object from FTT=1 to FTT=2
Now let's look at the capacity usage for an object using an FTM of RAID-1, but changed to an FTM of RAID-5 (with an implied FTT=1). Figure 4-7 shows an object using an FTM of a RAID-1, with FTT=1. When the policy is changed to an FTM of RAID-5, as shown in in step 3 of Figure 4-7, the new RAID-5 stripe must be constructed prior to any full replicas being removed from vSAN. This means that for a temporary period of time, the overhead will consist of the replica of the object, and the newly constructed stripe while it is being built. Once the RAID-5 stripe is completed, the mirrored replicas will be deleted. In the example below, the total capacity consumed for the object started as 2x, went to 3.3x during the RAID-5 stripe construction phase, then went to 1.3x once the stripe was completed.

Figure 4-7. Consumed capacity when changing object from RAID-1 to RAID-5
Policy changes can also impact current deduplication and compression ratios. Deduplication and compression occur when the data is destaged from the buffer/cache tier, to the capacity tier, as shown in Figure 4-8. When changing an object from an FTM of RAID-1 to RAID-5, data will be synchronized to meet the new policy setting, and will be inflated as it traverses back through the stack to be placed in another disk group on the same host, or on a different host. vSAN destages this data in batches, at a rate that is dependent on the level of write activity in a cluster. Disk groups with large cache tiers and a relatively small number of incoming writes many not destage the data for an extended period of time. For this reason, vSAN might occasionally report a reduced, or even a negative deduplication and compression ratio for a short period of time. This is expected behavior.

Figure 4-8. Data deduplicated and compressed as it moves through the data path
This temporary impact of deduplication and compression ratios may occur with any activity that moves the data through the data path. Data evacuations due to maintenance activities, vSAN object rebuilds, cluster-wide adjustments, and storage policy changes are the most common reasons.
RECOMMENDATION: Variability in deduplication and compression ratios is normal behavior, and should be factored in when maintaining the recommended 30% slack space in a vSAN cluster. The number and type of new VMs provisioned, object space reservation (OSR) settings, disk group layout, the ability of new data to be deduplicated or compressed, and the activity level on each host are among the many reasons behind the variability. Storage systems rely heavily on the need for free storage space, and should be emphasized in all design and operational procedures.
Operational approach
Using the vSAN Capacity Overview dashboard in VMware Aria Operations, we can gain a visual understanding of how these capacity changes may impact a cluster. For this exercise, the time window has been changed to 24 hours to look at a few activities in more detail.
In Figure 4-9, we see that the Deduplication and Compression ratio (upper left sparkline) had a steady state ratio of 1.6x. It then took a dramatic dip to under 1x, followed by regaining to a 1.3x ratio. We can see that the savings in gigabytes from deduplication and compression (upper right sparkline) also reflects a similar pattern, where there was a dramatic dip in space savings, followed by a slow recovery to nearly the level prior to the change.

Figure 4-9. Deduplication and Compression Savings widget showing a change
In situations where only deduplication and compression ratios are monitored, a reduction in the ratio might be cause for concern for an administrator. This metric alone is not sufficient for a proper understanding of space efficiency of a cluster, as described below.
The lower left sparkline in Figure 4-9 notes the "Usage with Deduplication and Compression." The sparkline shows that this spiked upward sharply. If the metric is double-clicked, we can zoom up to a more specific time window, as shown in Figure 4-10. A zoomed in view shows that the usage with deduplication and compression started out as 963GB, spiked upward to 2.8TB, then dropped back down to 951GB after about 45 minutes.

Figure 4-10. Usage with Deduplication and Compression widget - a detailed view
We see that even though the deduplication and compression ratio went from 1.6x to 1.3x (as reported in Figure 4-9), the overall consumed usage, as shown in Figure 4-10, was lower than prior to the increase. Once again, this may strike an administrator as unexpected, since the deduplication and compression ratio went down.
To understand this fully, we will close this details view, and double-click on "Usage without Deduplication and Compression" as shown in Figure 4-11. Zooming into roughly the same time window, we see that the initial usage of 1.6TB was followed by a spike in usage of 2.13TB. In approximately 15 minutes, this space consumed was dramatically reduced to an all new low of 1.26TB.

Figure 4-11. Usage without Deduplication and Compression widget - a detailed view
What Figure 4-11 shows is that there was a dramatic improvement in capacity utilization when looking at capacity usage WITHOUT deduplication and compression. This suggests that a large number of objects were changed to a policy using RAID-5/6 erasure coding.
RECOMMENDATION: Be mindful of the differences between various space-efficiency techniques such as RAID-5/6 erasure coding, and deduplication and compression. RAID-5/6 erasure codes are a space-efficiency technique that make the data redundant while consuming less space than a traditional RAID-1 mirror. Erasure codes GUARANTEES space reduction, while deduplication and compression are opportunistic space efficiency techniques that will depend on the conditions of the data and the topology of the cluster.
VMware Aria Operations for Logs can be used to aid in correlating events that may suggest the causes for the change in capacity utilization. While policy changes do not show up as an explicit action with a vCenter log event, we can still track log events that indicate potential changes. In Figure 4-12, we see that object resynchronizations occurred at the same time as possible storage policy assignment/adjustment events. And these changes correspond with the times of the deduplication and compression statistics shown above.

Figure 4-12. A custom dashboard showing object component resyncing, and potential storage policy assignments and adjustments
Findings
The information provided in VMware Aria Operations paired with the intelligence gathered with VMware Aria Operations for Logs helps us understand that a large number of VMs had their storage policies changed from an FTM of a RAID-1, to RAID-5. This introduced a significant increase in storage capacity (for a temporary amount of time) for the transition to occur. The result was an overall decrease in storage capacity usage, even though the deduplication and compression ratio was decreased.
In this particular scenario, deduplication and compression ratios went down because there was less opportunity to deduplicate and compress the data. All but two VMs were assigned a new storage policy using RAID-5. In practice, VMs using RAID-5/6 may see lower deduplication and compression ratios, as it is inherently more space efficient than RAID-1 mirroring. Since there were only two remaining VMs using RAID-1, there may have been less opportunity to deduplicate and compress shared blocks.
Additionally, we were able to learn the following:
- The precise times in which capacity usage changed.
- The amount of slack space that was used to accommodate the temporary requirements of the policy changes (which were nearly 3x in this scenario).
- The rate of recovery of steady state capacity utilization.
- A detailed understanding of how storage policies using space efficiency techniques like RAID-5/6 erasure coding impacts deduplication and compression ratios.
RECOMMENDATION: Instead of changing attributes of an existing policy, consider assigning VMs to another, or new policy with the desired settings. This technique allows a user to limit the number of VMs (or amount of data) that may resynchronize at any given time, which will require less temporary space in your vSAN cluster.
Conclusion
VMware Aria Operations not only provides better visibility to the history of behavior of a vSAN cluster, it can also help provide a better understanding on guidance as it relates to maintaining sufficient free space for cluster activities.
Using Webhooks and VMware Aria Operations for Logs to Integrate vSAN Alerts with Slack
Introduction
When it comes to system administration and operations, we all know it can sometimes be tricky to get the visibility into your environments at the granularity and verbosity level that you want. No one wants a call at 3:00am to say a NIC flapped, unless, for example, it’s happening across 10 hosts within a short period of time.
It is also true that no two companies monitor and operate their environments the same way, so finding solutions that work with your particular setup can be tricky. VMware Aria Operations for Logs (which comes with 25 free licenses with all vCenter editions) allows you to set up webhooks to send arbitrary messages to any web service based on alerting conditions you define within the product, this is extremely powerful and essentially allows you to route alerts to any service you can think of.
In this post, we’ll take a look at how you can set up vRLI to send alerts to Slack (or any other service of choice) based on particular vSAN states and log messages. This can, of course, be extended to other solutions like PagerDuty, ServiceNow, or indeed any of the services listed here.
What you need
This is pretty simple to set up, but we’re going to outline the requirements here – we assume you have the following already set up and operating within your environment:
- vSAN
- VMware Aria Operations for Logs
- Slack
- A linux box with Docker installed
In addition to the above, we are going to deploy a very simple container that acts as the aggregation layer for all these services, it allows us to take the message fired by vRLI and translate it into whatever service you want the message to go to without having to do any coding.
The how
The container
You’ll need a linux box to run the container on, or if you’re running vSphere Integrated Containers it can run there, a Kubernetes cluster, PKS, etc. In this particular example, I am simply running the container on an Ubuntu VM for brevity and simplicity.
SSH into the linux box and pull down the latest version of the vmware/webhook-shims container:
docker pull vmware/webhook-shims
With the container image pulled down locally, let’s deploy it and set it to always restart if it fails:
docker run -d -p 5001:5001 vmware/webhook-shims --restart=always
The above command, when broken down does the following; Runs the container as a daemon process (in the background), maps port 5001 of the container to port 5001 of the host machine and restarts the container on all failures or host restarts.
Ensure the container is running by issuing the below command:
myles@docker01:~$ docker ps
CONTAINER ID        IMAGE                  COMMAND                  CREATED             STATUS              PORTS                NAMES
5f5dab820dc6        vmware/webhook-shims   "/root/webhook-shims…"   4 months ago        Up 14 minutes       0.0.0.0:5001->5001/tcp   practical_mcnulty
At this point, if we visit the host’s IP on port 5001 we will see a webpage like the below that contains the setup instructions for each plugin – this confirms the container is working as expected:

Slack
With the container set up, you will need to create an “Incoming Webhook” app for your slack team – instructions for doing so can be found here (follow steps 2 and 3). At the end of step 3 you should be furnished with a URL in the below format:
https://hooks.slack.com/services/T00000000/B00000000/XXXXXXXXXXXXXXXXXXXXXXXX
Take note of the three sections in the URL, beginning with,T, B and the random last string, as we will need them later on.
VMware Aria Operations for Logs
Within the “Interactive Analytics” tab, click the Alerts icon and then “Create new alert”. Give your alert a name – I called this one “Slack Webhook” as we can route these alerts to multiple services and have discrete alerts set up for each.
Check the “webhook” checkbox and fill in the URL with the following format:
http://[your container IP]:5001/endpoint/slack/Txxxxxxx/Bxxxxxxxx/xxxxxxxxxxx
Substitute in the IP address of your container, as well as the sections of the Slack URL from above.
As an example, let’s say my container host’s IP is 192.168.0.100 and my Slack URL is https://hooks.slack.com/services/T123456789/B87654321/ABCKSFSHDFKNGSDIGDFG then my webhook URL in vRLI would be the below:
http://192.168.0.100:5001/endpoint/slack/T123456789/B87654321/ABCKSFSHDFKNGSDIGDFG
And set up whatever alerting frequency you would like as the last item.

From here, click the Alerts icon again and then “Manage Alerts”, find the “Slack Webhook” alert we just created and click the “edit” button. At the bottom of the dialogue box that pops up you will see an “Edit Query” button – This is where you define the conditions that the alert will be raised to.
The query shown below is based on one of the built-in queries and looks for component state changes where a component changes from active to any other state (like degraded, stale, absent, etc):

With your alert defined – click “Save” on the bottom right-hand side of the window. Now that the alert is defined and has a query associated with it, all that needs to happen is for the query to match some results from the syslog it ingests – if you used the above example, put a host into maintenance mode and you will receive your alerts straight into the Slack instance you defined. Here’s a clip from our test lab:

And that’s it, an end-to-end solution to get your VMware Aria Operations for Logs alerts into Slack, but as mentioned at the start – there are many services supported by the webhook-shims container and we encourage you to try these out for other things like automatic ticketing in ServiceNow, paging with PagerDuty, kicking off Jenkins jobs or other workflows.
Upgrade Considerations for VMware Aria Operations for Logs
The process of upgrading VMware Aria Operations for Logs is relatively simple, and can be performed in the Administration console, as seen in Figure 5-1. Administration console access can be gained by specifying the "/admin" page in the URL for your server (e.g. https://vmwareariaoperationsforlogs.localdomain.com/admin )
Upgrades require incremental upgrades to be applied in the order they have been released. For example, in order to update an environment from version 4.0 to version 4.5, it requires that the environment be updated to version 4.3 prior to updating to version 4.5.

Figure 5-1. The VMware Aria Operations for Logs administration console
While it does require this serialized, incremental approach to upgrades, most find the process of upgrading predictable, and nearly effortless.
Once the upgrade is complete, the server(s) will resume collecting and reporting log event data. VMware Aria Operations for Logs can be upgraded with any account with the "Edit Admin" permission, as seen in Figure 5-2.

Figure 5-2. The "Edit Admin" permission that is necessary for upgrading
Upgrade considerations for VMware Aria Operations
VMware Aria Operations and vSAN have both seen a number of enhancements to deliver more value to the customer. Improvements in integration is courtesy of enhanced APIs in vSAN. VMware Aria Operations is highly dependent upon these APIs in order to collect the proper vSAN related data. While interoperability matrices will show the compatibility between the relative versions of VMware Aria Operations and vSAN, both products have continuous improvements related to the APIs in order to create as much integration as possible. Even when there is a basic level of compatibility, any disparity between versions may translate to less functionality between the two products than if they are both running the most up-to-date versions.
Since VMware Aria Operations is a tool that can interact with a number of different systems in the infrastructure, prudent planning is always highly recommended to ensure that planned upgrades are smooth and predictable. For a complete understanding of product interoperability, visit the VMware Product Interoperability Matri x site.
The process of upgrading is relatively simple, and can be performed in the administration console, as seen in Figure 6-1. Administration console access can be gained by specifying the "/admin" page in the URL for your Aria Operations server (e.g. https://vmwareariaoperations.localdomain.com/admin)
Once in the administration page, a node will need to be "offline" prior to the actual upgrade. This is simply a matter of clicking the "Take Offline" button, as seen in Figure 6-1. This step may take a while, as it is flushing all data and placing the system in a state where it is no longer ingesting data.

Figure 6-1. Taking the VMware Aria Operations instance offline prior to running an upgrade
Once a node is taken offline, installing an update is as easy as clicking "Install a software update" button, as shown in Figure 6-2. A dialog box will prompt for the .pak file downloaded from VMware, which contains the binaries for updating the product.

Figure 6-2. Installing a software update from the administration console
Customizing dashboards in VMware Aria Operations for Logs
The user interface of Log Insight allows an administrator to easily customize the type of log content that rendered. This is achieved through the use of dashboards and widgets. Dashboards are generalized groupings of data that can be presented in a single view. Widgets reside in a dashboard, and are used to present data. These widgets are simply predefined queries that present the query results in the manner desired, such as a graphical chart over time, or a summary of event counts based on an entity in your data center.
Dashboards and widgets in VMware Aria Operations for Logs
VMware Aria Operations for Logs presents these dashboards in one of two possible locations, as shown in Figure 7-1: Content pack dashboards, or custom dashboards. Content pack dashboards are dashboards integrated directly into the product, or added to Log Insight by downloading and installing from the VMware Marketplace .

Figure 7-1: Custom Dashboards and Content Pack Dashboards
Predefined dashboards and widgets are usually delivered through a plugin, known as a content pack. Custom content packs can be created and distributed across an organization, while other content packs can be found and downloaded from the VMware Marketplace .
When importing dashboards, one of two options are presented, as shown in Figure 7-2, below.
- The "Install as content pack" option will place the dashboards in the "Content Pack Dashboards" section, and cannot have modifications saved to them.
- The "Import into My Content" option will import the custom dashboards into the "Custom Dashboards" section, where adjustments to queries and other modifications can be saved.

Figure 7-2. Options for importing content packs
Choosing the best option depends on your intention of the dashboards that you will be using. The "Install as a content pack" option offers a level of control and standardization of the dashboards but limits the ability to save customizations within those same dashboards. This can be helpful for multiple team members who benefit from a consistent accessibility to specific dashboards. The "Import into My Content" option offers full customization of dashboards and widgets to suite an individual, but may not offer the standardization, consistency, or accessibility sought by other team members.
RECOMMENDATION: You may wish to import a predefined content pack using the "Import into My Content" customizing for your organization as necessary, then redistributing it as a content pack for distribution across your organization. This approach allows for an organization to take advantage of the customization features of Log Insight while maintaining consistency across your organization.
Cloning and customizing dashboards and widgets
Widgets found in dashboards in the "Content Pack Dashboards" (such as the vSAN dashboards) cannot be customized. However, as shown in Figure 7-3, you can easily clone individual widgets to build your own custom dashboards.

Figure 7-3. Widget options limited to only "Clone" for widgets in a dashboard installed as a content pack
As shown on Figure 7-4, once the widget is cloned to a custom dashboard, many more options become available, such as customizing the query generating the results in the widget, and changing how it will render the data, such as chart type.
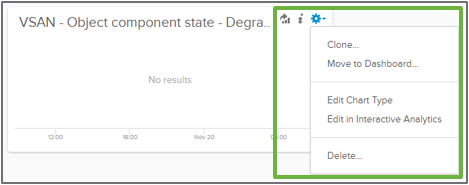
Figure 7-4. Expanded widget options for widgets in a dashboard in the "My Dashboards" section
When selecting "Edit in Interactive Analytics" all changes made to the query in the Interactive Analytics view will persist in the view presented in the widget.
RECOMMENDATION: Keep the prebuilt dashboards found in published content packs available for future reference. They can be a great tool for learning, and a template for items that are most important for your organization. The queries created in these widgets minimizes the need for creating custom queries.
When using a web browser that had been used to previously access Aria Operations for Logs, the browser may attempt to load a dashboard that was recently deleted. This can give the impression that there is an issue, as it appears to be in the process of loading a dashboard. This can be easily corrected by removing the portion of the URL address that refers to the old dashboard. Once this is done, all subsequent logins to VMware Aria Operations for Logs should work without issue.
RECOMMENDATION: Bring multiple widgets from various dashboards into a custom dashboard. This can be an easy way to create correlations between elements of an infrastructure. For instance, vSphere network events from the vSphere content back can be combined with various vSAN object state changes, so that we can determine if network connectivity issues impacted object state and resyncing in vSAN.
Customizing dashboards in VMware Aria Operations
VMware Aria Operations comes with extensive abilities to customize nearly every aspect of the data that it presents. A user can assemble this data in almost any way desired. Much like VMware Aria Operations for Logs, VMware Aria Operations uses the concepts of dashboards and widgets to assemble and render the data. As shown in Figure 8-1, it also uses the concept of "Interactions" to create real-time links between the rendered data.

Figure 8-1. Widgets, Views, and Interactions within a dashboard layout
Administrators have the ability to create and modify dashboards as necessary. Just as with VMware Aria Operations for Logs, VMware Aria Operations comes with a number of prebuilt dashboards for vSAN. The prebuilt dashboards for vSAN are good examples of what can be achieved with VMware Aria Operations. They can be used unmodified in production, or tailored to accommodate the needs of an environment best.
VMware Aria Operations pulls vSAN related health and performance metrics through special vSAN APIs. vSAN data is not limited to what is presented in the prebuilt dashboards. When customizing widgets in a dashboard, you can see a number of additional metrics exposed through the "vSAN Adapter Instance" as shown in Figure 8-2.

Figure 8-2. Accessing the vSAN Adapter instance
The "vSAN Adapter Instance" is the primary way that VMware Aria Operations can collect vSAN specific metrics, and will be used as the method of selecting what type of metrics should be rendered within a widget on a dashboard. The vSAN adapter instance will collect all vSAN related data. It is up to the user to determine if the data should be rendered, and how it should be displayed. This is one of the many reasons why VMware Aria Operations is so flexible.
If vSAN metrics are not showing correctly in a custom dashboard, make sure that data is showing up in other vSAN dashboards. If the prebuilt dashboards appear to indicate that it is not currently collecting vSAN metrics, ensure that the vSAN Adapter Instance shows that it is actively receiving data in the administration console, as shown in Figure 8-3. Administration console access can be gained by specifying the "/admin" page in the URL for your server

Figure 8-3. Using the administration console to verify the vSAN Adapter Instance is receiving data
If an adapter instance stops repeatedly, or fails to start, this may be a symptom of other issues with VMware Aria Operations. See the VMware Aria Operations Administration Guide for further details in determining the cause for adapter instances that are unable to maintain a running state.
Dashboard management in VMware Aria Operations
As shown in Figure 8-4, clicking on Dashboards > Actions > Manage Dashboards will be the location in which a user can create, delete, clone, and edit dashboards. Even though some of these functions can be performed elsewhere, this area provides a consistent location to perform all dashboard customization and management.

Figure 8-4. Accessing the "Manage Dashboards" view
The "Manage Dashboards" view, as shown in Figure 8-5, will list all available dashboards available for further actions. Typing in "vSAN" in the "Quick Filter" will quickly isolate the list of dashboards that have the word "vSAN" included in the name.

Figure 8-5. The "Manage Dashboards" view, with a "quick filter" of "vSAN" applied
RECOMMENDATION: When cloning existing dashboards, or creating new custom dashboards, it might be helpful to append a special name that is consistent across all custom dashboards. This will make the custom dashboards extremely easy to find when clicking on Dashboards > Actions > Manage Dashboards. This consistent name can be entered into the "Quick Filter" to isolate just the custom dashboards desired, for easy selection and editing.
When editing a dashboard, a pop-up box will appear that is divided into two areas. As shown in Figure 8-6, the left-hand side of the pop-up box is where the dashboard tools allow the user to define the widgets to be added to the layout, as well as the widget interactions, and other navigation settings. The right-hand side of the screen represents the actual WYSIWYG layout of the dashboard. This is where individual widgets can be edited, and the layout of the respective widgets can be changed.

Figure 8-6. The "Edit Dashboard" pop-up box
RECOMMENDATION: Keep custom dashboards simple. Overly complex dashboards with a large collection of metrics are often very difficult to discern by anyone other than the creator of the dashboard. Even if it is a collection of metrics in a single widget, this often can be the clearest way to convey the information. Simple dashboards also allow for more screen real-estate to be used, which can be easier for the reader to digest.
As shown in Figure 8-7, VMware Aria Operations allows for easy cloning of existing dashboards for further modification and adjustment. Cloned dashboards can be modified as desired.

Figure 8-7. Cloning a dashboard
Modifying dashboards that are a clone of an existing prebuilt dashboard is highly recommended. Working with cloned copies of the prebuilt dashboards are an easy way to experiment and learn customization techniques without fear of harming the original dashboard for future use or reference. Working with cloned copies also allows an administrator to safely update the prebuilt dashboards during the product upgrade process without harming any customizations.
Resource capacity usage for VMware Aria Operations and Aria Operations for Logs
Infrastructure analytics solutions can offer tremendous insight into an environment that would otherwise go unnoticed. As environments grow, and the solutions are more heavily relied upon, the resource usage of these solutions can grow as well. Infrastructure analytics solutions tend to use a significant amount of CPU, memory, and storage I/O to aggregate log data, and apply their respective analytics to render the results. While VMware Aria Operations and VMware Aria Operations for Logs have the ability to scale out by using additional VMs, the aggregate resource usage increases as well.
Due to the increased demands on an environment, it is not uncommon for these types of applications to eventually be moved to a dedicated vSphere cluster, or perhaps sharing the resources in a dedicated management cluster. With a three-tier architecture, isolation into a separate cluster only solves part of the problem, as storage I/O would still contend with hosts in other clusters for the same storage resources.
A vSAN powered cluster dedicated for a farm of log aggregation and infrastructure analytics is an ideal solution for managing the demands of these types of solutions. In addition to isolating compute resources that are independent from other resources in the data center, a vSAN powered cluster will isolate all storage resources to just the hosts in that cluster, minimizing impacts of noisy neighbor scenarios and ensuring more predictable levels of service. Figure 9-1 represents this isolation of compute and storage resources.

Figure 9-1. A fully isolated management cluster powered by vSAN
RECOMMENDATION: Understand the impact of sampling intervals. VMware Aria Operations collects and renders data in 5-minute intervals. This in part is due to the significant amount of data points it collects. This longer sampling interval is more fitting for broad overview and long-term analysis needs, as it is unable to adequately show spikes of resources that last for a shorter period of time. For more granular analysis, use vCenter based metrics (in particular, guest VM metrics). vCenter uses a 20 second sampling rate and retains this sampling rate for 1 hour. The IOInsight fling is also extremely helpful in observing I/O activity at a very granular level.
VMware Aria Operations and VMware Aria Operations for Logs have their own specific sizing recommendations.
Conclusion
Infrastructure analytics helps solve problems faster, and aids in making better design and operational decisions. Data collected in an environment often can offer a unique glimpse into the special demands of an environment, but often goes underutilized. Log and event data, performance metrics, and alarms can be collected and analyzed by purpose built solutions to identify trends and insight that would otherwise go unnoticed.
VMware Aria Operations and VMware Aria Operations for Logs are two extremely powerful infrastructure analytics tools in the VMware Aria Suite of solutions. Since they offer unique insight at the primary management and control plane of the data center (the hypervisor), they are a great fit for any infrastructure. Thanks to recent integration efforts with VMware vSAN, data center administrators can now see an all new level of infrastructure analytics for their vSAN environments.
The examples provided in this document are simple workflows and scenarios get a vSAN administrator started with both products. Look for additional scenarios and workflows to be added to document in the future. For suggestions on additional workflows you wish to see, contact the author of this document.