
Understanding Performance Bottlenecks

What is a bottleneck, and how does it impact what we see when troubleshooting the performance of systems in the data center? This term may be self-evident to some, but how it relates to system performance is not so obvious. Diagnosing performance issues without understanding the effects of bottlenecks through a system can lead to misdiagnosis: A potentially costly endeavor that involves fixing something that wasn't the actual problem. Let us explore the term, and how it applies to troubleshooting performance across any type of architecture.
The Bottleneck Analogy
The term "bottleneck" refers to the neck, or mouth of a bottle in relation to the rest of the bottle. The constricting neck represents a boundary of capability for the item when something flows through it, relative to the size of the bottle. The limit of a bottle (sometimes illustrated as a funnel) would be the rate of flow exiting the bottle from the neck of the bottle, versus the flow if the neck were not there.

Figure 1. The funnel effect of a classic bottleneck.
It is a fitting term for many different situations. Common examples may include an 8-lane freeway narrowing down to 4 lanes, or a manufacturing plant where overcrowding of parts occurs at one point in an assembly line. As it relates to hardware components, software, or a collection of such components working in unison, the analogy can help illustrate a point where an activity or process is slower than everything else that depends on it. For example, Figure 2 shows a simple bottleneck or chokepoint of I/O sent from an application to a disk.
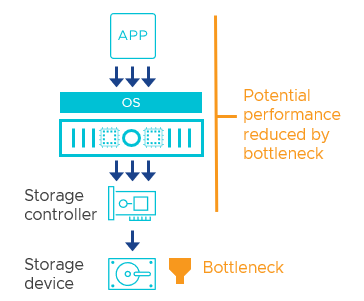
Figure 2. An example of a bottleneck occurring when an application writes data to a slow storage device.
Bottlenecks in a Data center
Bottlenecks can occur almost anywhere in the stack that comprises the data center. Each discrete physical or logical component carries a theoretical limit that may be different than other components. The list of potential bottlenecks is almost endless, but for data centers, the most common bottlenecks may include one or more of the following:
- Storage devices
- Storage controllers processing I/O
- I/O caching layers
- Application threading/parallelism
- Application architecture complexity
- Dependent co-mingling applications
- Application processes and workflows
- Guest Operating System (OS) limitations
- Guest OS virtual hardware resource assignments
- Network/storage (switch or adapter) bandwidth
- Network/storage switch processing power
- Network/storage switch port buffering
- Network/storage switch backplane
- Protocol stack(s)
- CPU cores
- CPU clock speed
- CPU caching
- Memory capacity
Some items such as queues and buffers sit at the top of the “funnel” of a device or part of an application, where it can absorb small bursts at a higher rate than what can be passed onto the next component, but were designed to provide benefits for a brief amount of time.
While the items listed here are discrete factors, the sometimes-hierarchical relationship to one another can make simple diagnostics challenging.
Relationship of Factors in the Data center
Understanding bottlenecks in the data center requires a level of comprehension about the relationship of components of a system. These components are comprised of both hardware and software.
Imagine a series of components (logical and physical) as a process occurs. Each component is needed in some way, creating a relationship chain. Each component has a theoretical or potential limit of capabilities defined by the discrete hardware and software. Due to the relationship chain, the potential capability of the system is limited by the component with the least capability, or most significant constraint. As an example, in Figure 3, the bottleneck would be the storage fabric.
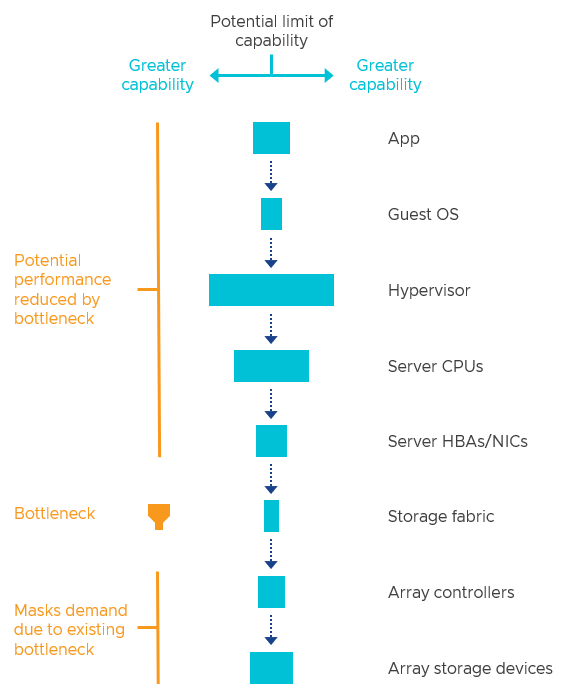
Figure 3. A simplified dependency chain of components in a three-tier architecture.
In this example, alleviating that bottleneck by upgrading to a faster storage fabric would improve performance but shift the bottleneck to the next most constraining component. Therefore, bottlenecks are not eliminated through improvements, but rather, shift to another point in the stack.
If the narrowest constraint occurs higher in the relationship chain, it can influence how the problem is interpreted when attempting to diagnose. Bottlenecks in the stack can mask the effective limits of the components below it. This is one of the most common reasons for the misdiagnosis of performance issues, and improperly sizing new architectures.
A distributed storage system like vSAN can complicate the identification of storage bottlenecks because the subordinate components are different than with a three-tier architecture. In simple terms, three-tier architectures generally use a single source and path to provide storage resources, while data in distributed architecture places data across nodes, where the pathway used for access may not always be the same.

Figure 4. Distributed storage through vSAN introduces different factors to consider when determining a bottleneck
vSAN deals with the effects of bottlenecks through “congestions.” While it does not eliminate bottlenecks, it can help manage the impact of them.
Why do bottlenecks change?
Bottlenecks can change or shift to another discrete element of the stack for several reasons.
- Workload characteristics. The demands of the workload and the OS it lives in can influence where a bottleneck occurs. The frequency of the activity and the magnitude of the activity burden different aspects of the story stack. Just as larger vehicles can congest a freeway more than smaller vehicles, large I/O sizes can do the same to any part of the compute, network, or storage stack. Application activity, including I/O sizes, can change dramatically by the second.
- Improved hardware. Faster hardware can relieve the likelihood that a given component will be a bottleneck, thus shifting it to another location: Hardware or software. For example, replacing value-based SATA flash storage devices with storage devices using 3D XPoint is such a substantial improvement that any potential bottlenecks will likely occur somewhere else in the stack.
- Improved software. The introduction of faster hardware can sometimes shift the bottleneck back to the application, OS, or hypervisor. Software is designed and coded with certain assumptions regarding the capabilities of the hardware. As hardware improves, these limits in the software will begin to show up. Software manufacturers recognize this and will often look to see how the software can be optimized for new, faster hardware.
The last reason is where VMware applies continual improvement to the core hypervisor, and vSAN. Examples of these optimizations resulted in Performance Improvements in vSAN 7 U1 and RAID-5/6 Erasure Coding Enhancements in vSAN 7 U2. Our engineering team is constantly evaluating specific areas in the software stack that can help shift the bottleneck elsewhere (ideally onto hardware) and deliver new levels of performance simply through an upgrade.
Bottlenecks may always exist in theory but will most often be realized when there is contention. For example, a VM demanding very few resources may not stress any area of the stack enough to hit a constraint by a bottleneck. The number of VMs or workloads and the magnitude of their activity will impact when and where the bottleneck may surface. An exception to this would be device latency that is poor under all circumstances.
How can a bottleneck be properly identified and quantified?
Troubleshooting performance issues is most often an exercise in properly identifying bottlenecks. But system performance is multifactorial: Meaning that identifying the primary contributor does not indicate the identification of the only contributor. Fixing the primary contributor to performance limitations will improve the performance while shifting the bottleneck to the next most significant contributor of performance limitations.
Identifying a bottleneck can also be subject to the level of resolution in which entities are defined. For example, a server may be a bottleneck to a process, but perhaps it is a sub-component within that server that is the actual bottleneck. These two statements can be true at the same time.
The amount a correctly identified bottleneck imparts will vary for the same reason that constricting an 8-lane freeway to 2 lanes will create a more significant bottleneck than constricting an 8-lane freeway to 4 lanes. The severity of the bottleneck can impact how much of an improvement one may see if that bottleneck were removed. For example. Assuming a given cluster's identified bottleneck was the 10Gb networking in use, the degree of benefit seen by moving to 25/100Gb would depend on the capabilities of the storage devices used. The upgraded network may immediately shift the bottleneck to the slower performing value-based flash device with limited levels of improvement, whereas the same cluster using higher-performing storage devices may see much more significant levels of improvement.

Figure 5. How subordinate components will impact the degree of change when addressing a bottleneck.
This is the reason why you may see qualified statements such as "moving from SATA flash devices to NVMe will improve the performance of vSAN IF the storage devices are the primary point of contention."
Recommendation. Aim to improve the most significant bottleneck. This will yield the most improvement in your data center. The most common bottlenecks we see in vSAN environments are with insufficiently sized networking and storage devices. For more information, see the post: vSAN Design Considerations - Fast Storage Devices Versus Fast Networking and vSAN Design Considerations – Using Large Capacity Storage Devices.
The best method of identifying a bottleneck is through sensory cues. For a data center, this means using metrics. Viewing the right metrics at the correct location is key to making an accurate determination of the bottleneck. Viewing too far below or above the bottleneck simply will not provide enough information. See Troubleshooting vSAN Performance for more information. Quantifying the impact of a bottleneck on metrics alone can be difficult. For example, storage devices may have a consistent level of latency under a certain I/O pattern, but a much higher, non-deterministic latency under another I/O pattern. Contention-based metrics such as network dropped packets, or CPU Ready values tend to have an exponential impact as the metric increases. Therefore, measuring the impact of a bottleneck can only be reliably performed after a discrete bottleneck is alleviated.
What is the best bottleneck to have?
Some bottlenecks are better than others. Given all possible choices, a CPU bottleneck because of full utilization through guest VM workloads is the most ideal bottleneck to have. Full CPU utilization at the guest (when something is being asked of it) is a good sign: An indicator that it is not waiting unnecessarily for any other part of the stack. Applications that are good at multithreading showcase this perfectly. Since CPU resources are efficiently time-sliced through a hypervisor scheduler, the virtual CPU resources can be scaled up or down easily. CPU resources can also be added easily through scaling out a cluster or scaling up the power of the CPUs. vCenter also provides good visibility to this. The type of CPU bottleneck that is not good is those that come from the underlying hypervisor. This is one of the significant strengths behind vSphere and vSAN: Efficient use of resources.
Other bottlenecks are more challenging to predict and manage. Storage-related bottlenecks are unpredictable in their level of impact due to the sharing of resources and the varying characteristics of I/O. Network-related bottlenecks also share a level of unpredictability, with a minimal level of visibility because the switchgear is outside the domain of management by the hypervisor. Memory is never really a bottleneck, although a shortage of memory can impact CPU utilization, and generate unnecessary use of storage through paging.
Summary
Every component that makes up a system has an inherent, theoretical limit. The discrete components - in hardware and software - that comprise the systems that power a data center depends on each other. It is this relationship that introduces the notion of bottlenecks. A balanced design ensures that no discrete component has an overwhelmingly negative impact on the system, and when the bottleneck is correctly identified, it can be addressed in a cost-effective way. For more information on how to troubleshoot performance bottlenecks in vSAN, see Troubleshooting vSAN Performance on core.vmware.com.