February 26, 2024

vSAN performance questions - How do I identify if I have bad performance?

This question came in this morning.ย 

๐˜”๐˜บ ๐˜•๐˜๐˜”๐˜ฆ ๐˜ค๐˜ญ๐˜ถ๐˜ด๐˜ต๐˜ฆ๐˜ณ ๐˜ช๐˜ด ๐˜ด๐˜ญ๐˜ฐ๐˜ธ, ๐˜ข๐˜ฏ๐˜ฅ ๐˜ ๐˜ต๐˜ฉ๐˜ช๐˜ฏ๐˜ฌ ๐˜ช๐˜ต'๐˜ด ๐˜ฃ๐˜ฆ๐˜ค๐˜ข๐˜ถ๐˜ด๐˜ฆ ๐˜ ๐˜ฏ๐˜ฆ๐˜ฆ๐˜ฅ ๐˜ต๐˜ฐ "๐˜ฐ๐˜ฑ๐˜ต๐˜ช๐˜ฎ๐˜ช๐˜ป๐˜ฆ ๐˜ต๐˜ฉ๐˜ฆ ๐˜ฅ๐˜ณ๐˜ช๐˜ท๐˜ฆ๐˜ด, ๐˜ฅ๐˜ฐ ๐˜บ๐˜ฐ๐˜ถ ๐˜ฉ๐˜ข๐˜ท๐˜ฆ ๐˜ข ๐˜จ๐˜ถ๐˜ช๐˜ฅ๐˜ฆ ๐˜ง๐˜ฐ๐˜ณ ๐˜ต๐˜ฉ๐˜ช๐˜ด?ย 

From time to time I see various performance related questions and they often start with some common issues:

1. They fail to identify WHY they think there is a problem with the back end.ย 

2. They fail to demonstrate understanding of what a performance problem looks like.ย 

So rather than directly respond to this question, we will look at how to identify if a performance problem is not actually present (or not at the storage layer).ย 
ย 

ย 

Image

ย 
ย 
IOPS is not A unit of good or bad performance. It's a measure of use of a system (Specifically the number of operations per second). In a vacuum seeing this number low doesn't actually tell us anything for how good transactional application performance. Now anecdotally I can tell you seeing sub 50 IOPS there is not a large amount of workload being generated. Specifically at this low of a level I would call this "background noise". Though to fully qualify if the system is being stressed (or frankly used at all) and this number is a bottleneck we would want to look at corresponding latency at this layer. In this situation the cluster is demonstrating incredibly low latency (below 1ms).ย 
HIt would appear the reason IOPS are low is simply because nothing is really trying to use the system. Now there could VERY much be a real application/end user problem, and even could be one manifested as latency at the virtual machine layer cause dby something above the disk layer.ย 

Image

ย 
What one can identify at this point is that the problem is not being caused by the back end disks being overtaxed, as if that was the case we would see back pressure/latency from them struggling to keep up.
Also of note, if the back end disk latency was high, and usage was low it could signal a problem at a lower level (Say firmware or even thermal throttling issue).ย 

Next up we might ask the person who asked us this?ย 

So why do you think it's slow?
Part of troubleshooting performance isn't just assuming it's the layer below you and blindly inventing a theory of why it's at fault. Thankfully we have some tooling to get better visibility to WHERE in the I/O path the latency is coming from. vSAN offer a free tool to map out all of the paths in the I/O for a VMDK and show which pieces are contributing to latency. In the below example latency is coming from the networking stack. In this example you may wish to make sure links are sized correctly, there are no errors caused by cable issues etc.

docs.vmware.com/en/VMware-vSphโ€ฆ
ย 

Image

The key issue at hand in reviewing this cluster is understanding that that Latency not IOPS or throughput is how we qualify that a layer is being stressed or having an issue.

ย 

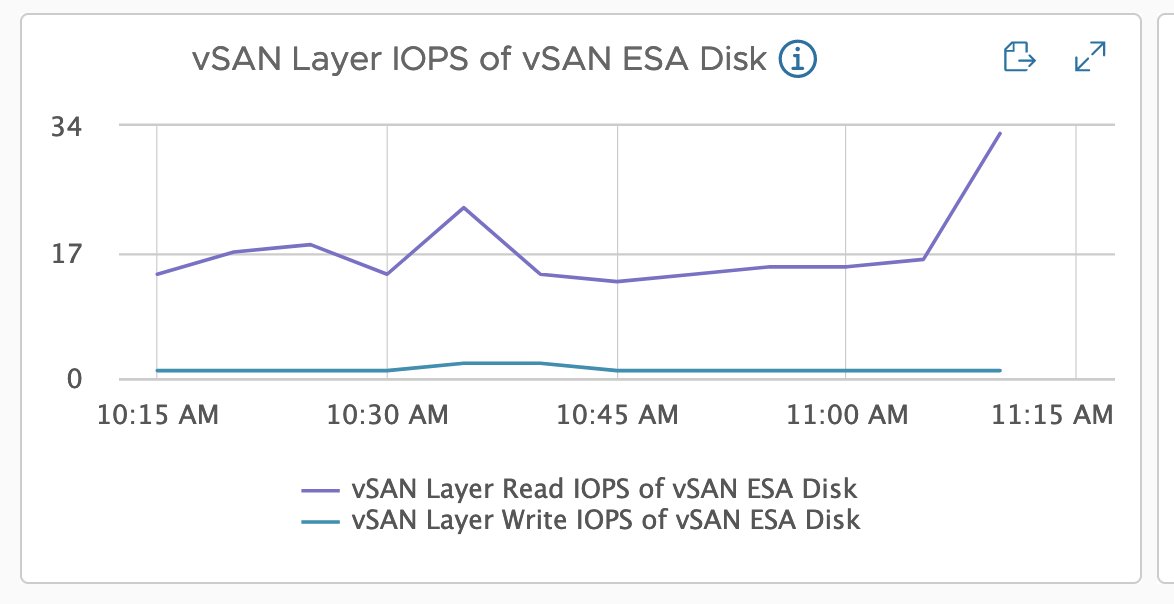
Should I measure performance usage in throughput or IOPS?

ย 
ย Higher throughput and lower IOPS (or the inverse) isn't bad. It just means generally a function of the block sized used. Remember: IOPS * Block Size = Throughput!
ย 
At first glance you may think the test of the left "slower" for pushing less than half the IOPS of the cluster on the right. A closer inspection reviews though the cluster on the right is pushing 7x the amount of data from disk beacuse it is using a larger block size.ย 

Image

Which test should I use for testing my cluster?ย 

ย 
It is benefitial to run both benchmarks, and understand that throughput tends to tax some components more (Networking layers), while small block IOPS focused benchmarks tend to tax other layers (CPU). Different applications and uses of those applications may stress throughput or small block IOPS more.ย 
ย 

How do I know what my apps/users are using?ย 

While some application vendors offer general guidance on their block size usage, they may not truely reflect all uses of the application or how the data is coalcesed and sent to disk by the operating system and in guest file system. VMware vSAN I/O Insight will actually let you capture this (and a ton of other stuff).ย Here is a short demo video duncan shows that includes graphs for block size as well as read/write mix. Remember writes are commonly more difficult to process than reads by storage systems.ย 

You can schedule vSAN I/O Insight to run at different times, as you might have completely different patterns when overnight reporting runs, or backups run, or DB maintenance is performed.
ย 
This has been your #VMwareMailbag thread of the week.
ย 

Filter Tags

Storage vSAN vSAN 8 Blog Performance Intermediate Advanced Optimize