
Splunk on VMware vSAN
Executive Summary
This section covers the business case, solution overview, key results, audience, and terminology.
Business Case
The traditional approach of using physical servers for server deployment may be an option but not smart enough considering the benefits of virtualization.
Splunk software helps to create hidden value from ever growing Machine Data. These workloads need massive storage capacity; the infrastructure needs to be flexible, scalable, and provides linear performance increase with scaling.
Hyperconverged infrastructure (HCI) makes it easier to plan these big data workloads. It helps combine hardware silos, reduce deployment complexity and management difficulty, and save capital and operational expenditures. VMware vSAN™ is VMware’s premier storage solution for HCI, which provides the broadest set of HCI deployment choices for enterprise Splunk workload deployment and provisioning. VMware vSAN address the requirements for running these big data workloads on top of cost-effective x86 hardware and software.
In this solution, we provide how VMware IT deploy it and successfully run Splunk on VMware vSAN platform. We explore the scale of the deployment, infrastructure resiliency and how it benefits in daily process.
Solution Overview
This case study is a showcase of using VMware vSAN all-flash as HCI for deploying Splunk workload in a VMware vSphere® environment:
- We provide Splunk deployment architecture on vSAN.
- How vSAN provides linear performance and scalability (1.7 Petabyte raw vSAN Storage) for ever growing Splunk data.
- Demonstrate how vSAN HCI provides resiliency and maintains business continuity for the Splunk environment.
- Recommendations for deploying Splunk on vSAN.
Key End Users of this Solution
Security Operation Center (SOC) that uses Splunk:
- to correlate security events from different log sources, which provides more effective security compliance.
- as a platform for security operations to run large data analytics for real-time forensics and investigations.
Key Results
This reference architecture in this paper:
- Showcase how VMware IT successfully runs their critical Splunk workload on VMware vSAN.
- Provide details on how vSAN is flexible in providing scalability along with linear performance increase.
- Demonstrate how high availability features of vSAN and Splunk are used to provide resilient solution.
Audience
This solution is intended for IT administrators, Splunk architects, virtualization and storage architects involved in planning, architecting and administering a virtualized Splunk workload on VMware vSAN.
Terminology
This paper includes the following terminologies.
Table 1. Terminology
|
Term |
Definition |
|
Forwarder |
A Splunk Enterprise instance that forwards data to another Splunk Enterprise instance, such as an indexer or another forwarder, or to a third-party system |
|
Indexer |
A Splunk Enterprise instance that indexes data, transforming raw data into events and placing the results into an index. It also searches the indexed data in response to search requests. |
|
Receiver |
The receiver is either a Splunk indexer or another forwarder (referred to as an "intermediate forwarder") that you configure to receive data from other forwarders. The receiver can also be multiple indexers at one time. |
|
Distributed Search |
A deployment topology that portions search management and search fulfillment/indexing activities across multiple Splunk Enterprise instances. |
|
Search Head |
In a distributed search environment, a Splunk Enterprise instance that handles search management functions, directing search requests to a set of search peers and then merging the results back to the user. |
|
Search Head Clustering |
Splunk Enterprise search heads that serve as a central resource for searching. The search heads in a cluster are interchangeable. You can run or access the same searches, dashboards, knowledge objects, and so on, from any member of the cluster. To achieve this interchangeability, the search heads in the cluster share configurations, apps, search artifacts, and job loads. |
|
Splunk Search factor |
The search factor determines the number of searchable copies of data the indexer cluster maintains. In other words, the search factor determines the number of searchable copies of each bucket. The default value for the search factor is 2, meaning that the cluster maintains two searchable copies of all data. |
|
Replication Factor |
In the case of an indexer cluster, the number of copies of data that the cluster maintains. A cluster can tolerate a failure of (replication factor -1) peer nodes. |
|
Peer Node |
The indexer cluster node that indexes external data. A peer node also replicates data from other peer nodes. |
|
Deployment server
|
A Splunk Enterprise instance that acts as a centralized configuration manager, grouping together and collectively managing any number of Splunk Enterprise instances. |
|
Master node |
The indexer cluster node that regulates the functioning of an indexer cluster. |
|
License master
|
It defines stacks, pools, add licensing capacity to Splunk environment. |
|
Bucket |
A file system directory containing a portion of a Splunk Enterprise index.
|
|
Saved search |
A search that a user makes available for later user. There are many types of saved searches, including reports, alert, scheduled searches, swimlane searches and KPIs. |
|
outputs.conf File |
This file defines how forwarders send data to receivers. |
|
indexes.conf File |
The file is used to configure Splunk’s indexes and their properties. |
|
Data pipeline |
The route that data takes through Splunk Enterprise, from its origin in sources such as log files and network feeds, to its transformation into searchable events that encapsulate valuable knowledge. |
|
Monitoring Console |
The monitoring console is a set of dashboards, platform alerts, and health checks included in Splunk Enterprise. |
Technology Overview
This chapter introduces the following technology components :
- VMware vSphere 6.7 U1
- VMware vSAN 6.7 U1
- VMware vSphere Replication™
- VMware Site Recovery Manager™
- Splunk Enterprise
- Splunk Enterprise Security (ES)
VMware vSphere 6.7 U1
VMware vSphere 6.7 is the next-generation infrastructure for next-generation applications. It provides a powerful, flexible and secure foundation for business agility that accelerates the digital transformation to cloud computing and promotes success in the digital economy. vSphere 6.7 supports both existing and next-generation applications through its:
- Simplified customer experience for automation and management at scale
- Comprehensive built-in security for protecting data, infrastructure and access
- Universal application platform for running any application anywhere
With vSphere 6.7, customers can run, manage, connect, and secure their applications in a common operating environment, across clouds and devices.
VMware vSAN 6.7 U1
VMware vSAN is the industry-leading software powering VMware’s software defined storage and HCI solution. vSAN helps customers evolve their data center without risk, control IT costs and scale to tomorrow’s business needs. vSAN, native to the market-leading hypervisor, delivers flash-optimized, secure storage for all of your critical vSphere workloads. vSAN is built on industry-standard x86 servers and components that help lower TCO in comparison to traditional storage. It delivers the agility to easily scale IT and offers the industry’s first native HCI encryption.
vSAN 6.7 U1 simplifies day-1 and day-2 operations, and customers can quickly deploy and extend cloud infrastructure and minimize maintenance disruptions.
Secondly, vSAN 6.7 U1 lowers the total cost of ownership with more efficient infrastructure. vSAN 6.7 U1 automatically reclaims capacity, using less storage at the capacity tier for popular workloads.
In addition, vSAN ReadyCare rapidly resolves support requests. vSAN ReadyCare is a marketing name introduced to capture the significant investments VMware has made to support vSAN customers. VMware continues to invest in ReadyCare support, and new ReadyCare simplifies support request resolution and expedites diagnosis of issues.
VMware vSphere Replication
VMware vSphere Replication is a hypervisor-based, asynchronous replication solution for vSphere virtual machines. It is fully integrated with VMware vCenter Server and the vSphere Web Client. vSphere Replication delivers flexible, reliable and cost-efficient replication to enable data protection and disaster recovery for all virtual machines in your environment.
VMware Site Recovery Manager
VMware Site Recovery Manager™ is an extension to VMware vCenter that provides disaster recovery, site migration and non-disruptive testing capabilities to VMware customers. It is fully integrated with VMware vCenter Server. Site Recovery Manager works in conjunction with various replication solutions including VMware vSphere Replication to automate the process of migrating, recovering, testing, re-protecting, and failing-back virtual machine workloads.
Splunk Enterprise
The Splunk platform uses machine data—the digital exhaust created by the systems, technologies and infrastructure powering modern businesses—to address big data, IT operations, security and analytics use cases. The insights gained from machine data can support any number of use cases across an organization and can also be enriched with data from other sources.
Splunk Enterprise Security (ES)
Splunk Enterprise Security uses the Splunk platform's searching and reporting capabilities to provide the security practitioner with an overall view of their organization's security posture. Enterprise Security uses correlation searches to provide visibility into security-relevant threats and generate notable events for tracking identified threats. It can help to capture, monitor, and report on data from devices, systems, and applications across your environment.
See Splunk ES features for more details.
Solution Configuration
This section introduces the resources and configurations:
- Architecture and instances
- Hardware resources
- Software resources
- Network configuration
- Splunk virtual machine configuration
Architecture and instances
In this solution, we have four vSAN clusters. Two vSAN clusters in the primary site and two in the secondary site, which is an active-active configuration since both sites actively contribute to Splunk machine data ingestion and end user searches. The sites are separated by more than 800 miles. See Figure 1 for detail architecture.
The primary and secondary vSAN clusters are configured using same hardware configuration and software version.
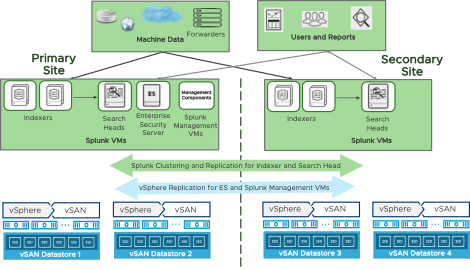
Figure 1. VMware IT - Splunk on vSAN Architecture
For departmental sized environments, single-instance Splunk deployments might be suitable where one instance of Splunk Enterprise handles all aspects of processing data, from input through indexing to search.
To support larger environments like VMware IT, where data originates on many machines and where many users need to search the data, Splunk provides options of distributing Splunk Enterprise instances across multiple machines, which helps to scale the deployment. In this model, each Splunk instance performs a specialized task. For example, one or more instances might index the data, while another instance manages searches across the data.
Table 1 shows the Splunk instances in this solution, each instance is a virtual machine (VM).
Table 1. Virtual Machines and Resource Allocation—Primary Site
|
Splunk VMs |
Number of VMs |
vCPU per VM |
Memory (GB) per VM |
Total Storage per VM |
|
Indexer |
37 |
30 |
192 |
10 TB |
|
Search Head |
2 |
32 |
64 |
500 GB |
|
License Master |
1 |
2 |
12 |
200 GB |
|
Deployment Server |
1 |
4 |
12 |
200 GB |
|
Search Head Deployer |
1 |
2 |
8 |
200 GB |
|
Monitoring Console |
1 |
8 |
32 |
200 GB |
|
Cluster Master |
1 |
8 |
32 |
200 GB |
|
Enterprise Security Search Head |
1 |
68 |
128 |
1 TB |
Table 2. Virtual Machine and Resource Allocation—Secondary Site
|
Splunk VMs |
Number of VMs |
vCPU per VM |
Memory (GB) per VM |
Total Storage per VM |
|
Indexer |
37 |
30 |
192 |
10 TB |
|
Search Head |
2 |
32 |
64 |
500 GB |
|
License Server |
vSphere Replication replicates these VMs from Primary Site.
|
|||
|
Deployment Server |
||||
|
Search Head Deployer |
||||
|
Monitoring Console |
||||
|
Cluster Master |
||||
|
Enterprise Security Search Head |
||||
Splunk Multi Site Indexer Configuration
In this implementation, Splunk is configured across two sites for disaster recovery and active-active configuration so resources are efficiently utilized on both sites.
As shown in Figure 2, each site has its own set of peer nodes (37 Indexer) and search heads (2). Hence this implementation is called a multi-site indexer configuration.
Splunk Search Head Clustering
A search head clustering solution is used for horizontal scaling and high availability. There are four Splunk enterprise search heads in this deployment with two in each site. These search head members are integrated into multisite indexer clusters.
As shown in Figure 2, a load balancer is placed in each site between the users and the search head to balance incoming search session and the topology is transparent to users. Ad hoc searches are performed on the primary site search heads all and saved searches are performed on secondary site search heads.
See about search head clustering for more details on search head configuration options.
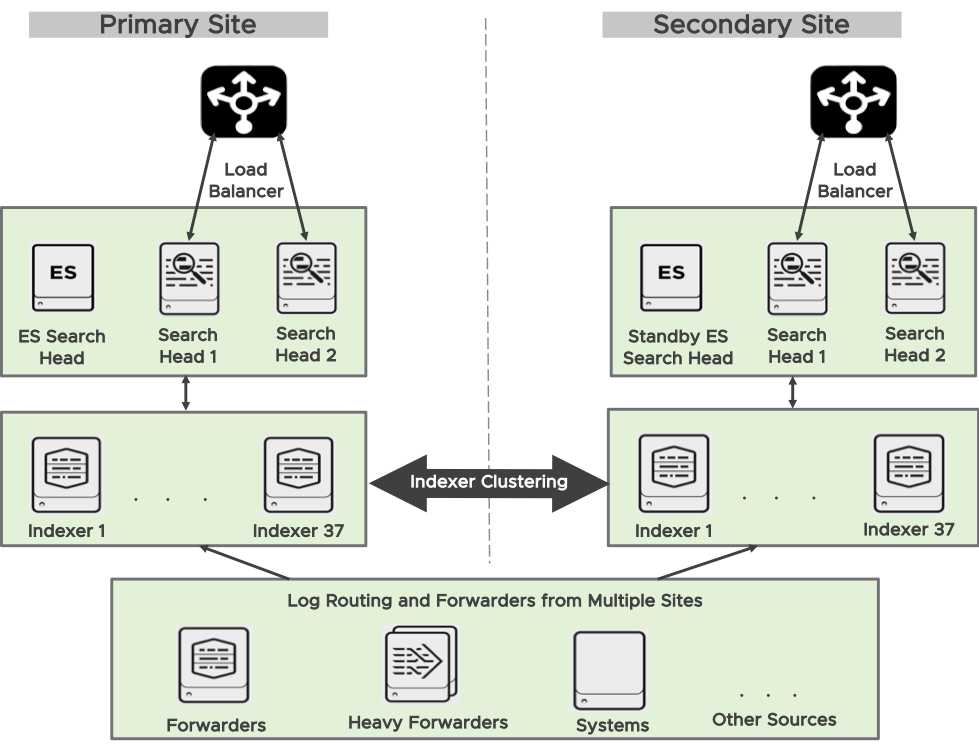
Figure 2. Splunk Clustering and Replication Architecture
Splunk ES Search Head
Splunk instance for ES search head, is currently growing vertically in terms of CPU resource hence this VM requires large number of vCPU. Considering the high CPU requirement this VM is placed on a 4 socket Dell server with 18 cores per socket and 64vCPU are allocated to this VM. See Table 3 in Hardware Resources, there are 2 Servers with 4 sockets used for ES server including a failover host. The rest of the ESXi host in the vSphere cluster are 2 Socket servers. ES server is only active in primary site and it is replicated to DR site through vSphere replication. Splunk provides a horizontal scaling option as well and we may evaluate this in future as it gets mature.
Splunk Site Replication Factor
The site replication factor provides site-level control over the location of splunk bucket copies, in addition to providing control over the total number of copies across the entire cluster. This two-site cluster maintain a total of two copies of all buckets, with each site maintaining one copies each. See configure the site replication factor for configuration procedure.
Splunk Forwarders
Splunk Forwarders forward data from one Splunk enterprise instance to another enterprise instance. Two types of Splunk forwarders are used in this solution they are universal and heavy forwarders. Universal forwarder contains only the components that are necessary to forward data you cannot use the universal forwarder to index or search data. Unlike Universal forwarder, heavy forwarder is full Splunk enterprise instance used if you need to analyze or make changes to the data before you forward, or you need to control where the data goes based on its contents. In this implementation these forwarders are used to ingest data from multiple sites as shows in Figure 2.The hypervisor hosting these forwarders are on separate vSphere clusters and is out of scope in this document.
Multiple forwarders send data to indexers which is the receiver. Forwarders perform automatic load balancing. The forwarder routes data to different indexers on a specified time or volume interval that is specified in the configuration. This configuration also helps to forward data to alternate indexer’s if one of the indexers is down. See Figure 3 which shows a typical load-balancing scenario, in which three forwarders are sending load-balanced data across a set of two receiving indexers.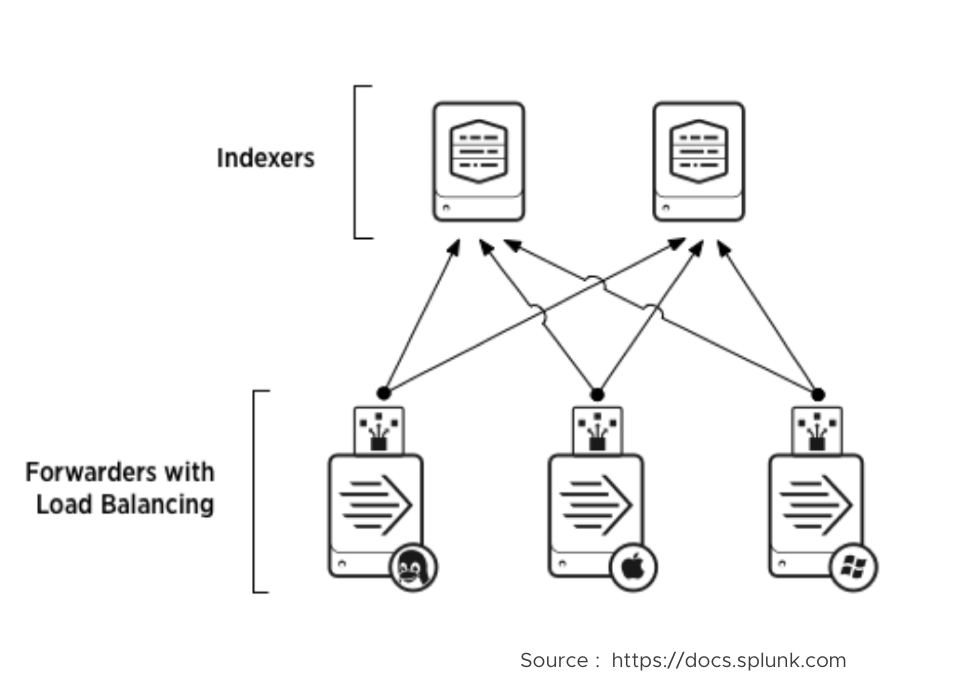
Figure 3. Typical Forwarders with Load-balancing Scenario
Splunk provides options for configuring receiving targets for load balancing. To configure a set of target receivers for load balancing it allows to choose either DNS or static lists. DNS list provide greater flexibility and allow for simplified scaling, particularly for large deployments. Through DNS, you can change the set of receivers without needing to re-edit each forwarder outputs.conf file.
Static lists allow to specify a different port for each receiver. This is useful if load balancing needs to perform across multiple receivers that run on single Virtual machine, however in our solution this does not apply.
Further there are options to choose a load balance method on how the forwarders load balance between the indexers in a load balancing list.
By Time: The default method for load balancing on how frequently the forwarders change indexers in the load balanced list. The autoLBFrequency setting in outputs.conf controls how often forwarders switch between indexers. The default frequency is every 30 seconds, but it can set higher or lower depending on the Splunk environment.
By Volume: Set how much data a forwarder sends to an indexer before it switches between indexers in a load-balanced list. The autoLBVolume setting in outputs.conf controls the amount of data that a forwarder sends to a receiving indexer before it changes to another one. By default, this setting is not active (0 bytes).
In this solution there are multiple indexers (74) and load balancing method is set “By time” and the “autoLBfrequency” is set to 5 seconds which is lower than the default value. For this environment this helps to balance the data pipeline among multiple indexers and avoid data ingestion bottleneck.
See about forwarding and receiving for other configuration options and procedure.
Other Splunk VMs
The solution uses distributed Splunk deployment, in addition to the data processing Splunk components such as the Indexer and Search Head, the following management components installed on VM support the activities of the processing components:
- Deployment Server
- Search Head Deployer
- Monitoring Console
- License Server
- Cluster Master
See the Terminology section and Scale your deployment with Splunk Enterprise components for more details on individual components.
High Availability and Disaster Recovery
VMware vSphere provides features such as VMware vSphere vMotion®, VMware vSphere High Availability which helps in failover during hardware failures and for ease of maintenance activities like upgrades. Some of the Splunk instances like Indexer VM and Search Head are CPU/memory intensive. To guarantee resource for these VMs during maintenance and upgrades, VMware DRS VM and Host affinity groups are used to control the placement of Splunk Virtual machines on specific hosts within the vSphere cluster.
Since vSAN is embedded in vSphere, vSAN is fully compatible with the above vSphere features and provides storage level availability with the cluster. vSAN Erasure Coding (RAID 6) used in this solution can tolerate double failure of disk or host failures.
Disaster recovery of Splunk solution is provided by combination of vSphere Replication and VMware SRM and Splunk level replication.
Splunk provides indexer data replication between sites based on the replication factor configuration. This helps in disaster recovery of the Splunk indexer and search head while providing active-active workload across sites.
vSphere Replication and SRM: Splunk Management VMs like the License Server, Deployment Server, Monitoring Console and ES Server search head is active only on one site, during normal scenario this will be Primary Site. For disaster recovery these VM are replicated using vSphere replication and orchestrated for failover and failback using VMware SRM. The RPO for these VMs is set to 5 minutes.
Storage Tiering
Hot and warm volume stores the recent ingested data and are frequently searched. Historical data is rolled over from warm to cold buckets, rolling from one tier to another is governed by the splunk configuration file indexes.conf. Hot and warm data buckets of the Splunk enterprise are stored on high-performance All Flash VMware vSAN storage while cold and frozen data buckets on are capacity intensive DELL EMC Isilon as shown in Figure 4. In this environment based on the ingestion rate and capacity allocated to indexers the data lives in warm bucket for about 6 months and eventually migrated cold buckets and then to frozen which is retained for up to 5 years. Majority of the searches in this Splunk deployment are within the last 30 days which will be delivered from VMware vSAN storage While the movement from Warm to Cold is configured using the indexes.conf as per this documentation the movement to frozen will need user intervention and it can be custom script.
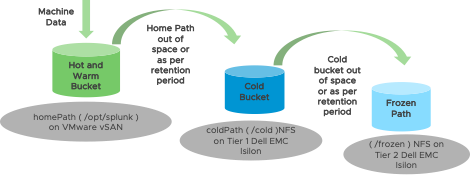
Figure 4. Splunk Buckets Tiering
Hardware Resources
Splunk uses two vSAN clusters each in the primary and secondary sites. The hardware and software configuration are same across both sites.
DELL PowerEdge servers are used here. Each VMware ESXi™ host contains two disk groups, and each disk group consists of one cache-tier SAS SSD and three capacity-tier SAS SSDs. Pass-through mode for the capacity-tier storage controller is configured, which is a preferred mode for vSAN with complete control of the local SSDs attached to the storage controller. Two 4 socket ESXi host in Cluster 1 which hosts Splunk ES VMs does not contribute to vSAN storage.
Table 3. Hardware Configuration for vSAN Cluster—Primary Site
|
PROPERTY |
Cluster1 |
Cluster 2 |
|
Number of ESXi host |
22 |
23 |
|
Server model and CPU name |
20 x DELL PowerEdge FC430
2 x DELL PowerEdge R830
|
23 x Dell PowerEdge R640
|
|
RAM per host |
256 GB |
256 GB |
|
Network adapter per host |
4 x 10GBps NIC |
4 x 10GBps NIC |
|
Storage adapter per host |
1 x Avago (LSI) FS33-PERC (DUAL ROC) |
1 x Avago (LSI Logic) Dell HBA330 Mini
|
|
Disks per Host |
Cache—2 x 800 GB (SAS SSD Write Intensive, Performance Class E, Endurance Class D >=7300 TBW)
Capacity—6 x 3.8TB (SAS SSD, Performance Class D, Endurance Class C >=3650 TBW) |
Cache—2 x 800 GB (SAS SSD Write Intensive, Performance Class E, Endurance Class D >=7300 TBW)
Capacity—6 x 3.8TB (SAS SSD, Performance Class E, Endurance Class C >=3650 TBW) |
Does not contribute storage capacity to vSAN
Software Resources
Table 4 shows the software resources used in this solution.
Table 4. Software Resources
|
Software |
Version |
Purpose |
|
VMware vCenter Server and ESXi |
6.7 U1
|
vSphere Cluster to host virtual machines and provide vSAN Cluster. VMware vCenter Server provides a centralized platform for managing VMware vSphere environments. |
|
VMware vSAN |
6.7 U1 |
Software-defined storage solution for hyperconverged infrastructure. |
|
vSphere Replication |
8.1 |
VMware vSphere Replication is an extension to VMware vCenter Server that provides hypervisor-based virtual machine replication and recovery. |
|
VMware Site Recovery Manager (SRM) |
8.1 |
VMware SRM is a business continuity and disaster recovery solution that helps you to plan, test, and run the recovery of virtual machines between a protected vCenter Server site and a recovery vCenter Server site. |
|
Splunk Enterprise Platform |
6.6.11 |
Splunk enterprise software provides way to aggregate, analyze and get answers from your machine data. |
|
Splunk Enterprise Security |
5.0.0 |
Splunk Enterprise Security (ES) enables security teams to use all data to gain organization-wide visibility and security intelligence. |
|
Cent OS |
7.3 |
Operating system for Splunk instances. |
Network Configuration
We created a VMware vSphere Distributed Switch™ to act as a single virtual switch across all associated hosts in the data cluster.
The vSphere Distributed Switch uses four 10GbE network ports for the teaming and failover each port is an uplink management. To isolate vSAN, virtual machine, management and VMware vSphere vMotion traffic, we used dedicated port groups for each item. Port group defines properties regarding security, traffic shaping, and NIC teaming. See Table 5 for details about the port group settings, uplink 1 and 3 were shared between application VM and management while uplink 2 and 4 were shared between VMware vSAN and vMotion. The VMkernel used for vSAN and vMotion uses maximum transmission unit (MTU) of 9000 (Jumbo frames) while the management VMkernel and Splunk VM workload uses the default MTU (1500). This configuration also supports network availability in case one of the ports failed.
Table 5. Network Configuration
|
DISTRIBUTED PORT GROUP |
Active Uplinks |
Standby Uplinks |
Load Balancing |
|
Management Workload |
Uplink 1, Uplink 3 |
None |
Route based on originating virtual port |
|
Splunk VM Workload |
Uplink 1, Uplink 3 |
None |
Route based on physical NIC load |
|
VMware vSAN |
Uplink 4 |
Uplink 2 |
Route based on originating virtual port |
|
vSphere vMotion |
Uplink 2 |
Uplink 4 |
Route based on originating virtual port |
vSAN Storage Policy Configuration
vSAN uses SPBM to provide required availability and resiliency for virtual machines. RAID 6 (Erasure Coding) that provides high availability is used. Since Splunk provides native compression, vSAN deduplication and compression might not provide significant benefits and hence is not enabled. The detailed configuration is defined in Table 6.
Table 6. vSAN Storage Policy Configuration
|
Settings |
Value |
Description |
|
PFTT |
2 |
Defines the number of disk, host, or fault domain failures a storage object can tolerate. |
|
Failure Tolerance Method |
RAID 6 (Erasure Coding) |
Defines the method used to tolerate failures in vSAN. |
|
Number of disk stripes per object |
1 |
The number of capacity disks across which each replica of a storage object is striped. |
|
Checksum |
Enabled |
Checksum is calculated by default to prevent data corruption. |
Splunk Virtual Machine Configuration
Splunk has provided recommendations for virtualization in Deploying Splunk Enterprise Inside Virtual Environments. All these recommendations along with performance best practices guide for vSphere 6.7 were followed while provisioning VM and allocating storage.
Splunk VM uses Cent OS.
Some of the key recommendations followed are provided below:
CPU and Memory configuration: When a virtual machine is sized larger than a single physical NUMA node, a vNUMA topology is created and presented to the guest operating system. In this deployment, the indexer and search head VM fall under this category so vNUMA topology is used, hence configure vCPU as “x cores per socket” as shown in Figure 5. This approach helps in reducing expensive remote memory access since a virtual machine will be contained within the fewest number of physical NUMA nodes.
For more information about vCPU and vNUMA sizing, see https://blogs.vmware.com/performance/2017/03/virtual-machine-vcpu-and-vnuma rightsizing-rules-of-thumb.html.

Figure 5. Virtual Machine Cores per Socket Configuration

Figure 6. Virtual Machine Memory Reservation Configuration
Storage: Paravirtual virtual SCSI (PVSCSI), was used, it provides good performance and is more efficient in the number of host compute cycles that are required to process the same number of IOPS compared to LSI. Splunk is IO intensive hence PVSCSI adapter is recommended for these VMs.
Splunk Indexer VM is the bulk consumer of storage in any Splunk deployment. In this environment apart from the Operating System disks each Indexer VM is provisioned with 4 virtual disks of 2.5 TB allocated through different PVSCSI controllers.
Linux native Volume Manager is used to create a volume group from these four disks. XFS file system is used as it provides good performance especially for handling large files and also provides highly efficient allocation of free extents for file system operations. Considering the large filesystem requirements XFS is as per this Red Hat solution used.
Below is example of how the four disks are allocated to volume group and filesystem is created and mounted.
- Create Physical Volume pvcreate /dev/sdb1 /dev/sdc1 /dev/sdd1 /dev/sde1
- Create Volume Group vgcreate vgsplunk /dev/sdb1 /dev/sdc1 /dev/sdd1 /dev/sde1
- Create Logical Volume lvcreate -l +100%free -n lvsplunk vgsplunk
- Format volume with XFS format mkfs.xfs /dev/vgsplunk/lvsplunk
- Create entry in /etc/fstab echo "/dev/vgsplunk/lvsplunk /opt/splunk xfs defaults 0 0" >> /etc/fstab
- Mount File system mount -a
Kernel Parameters:
vm.swapiness parameter: It helps kernel to decide on when to do swapping. Swappiness of virtual memory is set to “vm.swappiness=10”. By setting to 10, there will be no swapping until the RAM is utilized up to 90% avoiding aggressive swap out operations until there is enough free memory, this helps with Splunk performance.
IO Scheduler: ESXi uses an asynchronous intelligent I/O scheduler, and for this reason virtual guests should see improved performance by allowing ESX to handle I/O scheduling. As per VMware KB 2011861, NOOP or Deadline performs better for virtualized Linux guests, in this deployment deadline option is used.
System wide resource limits: Splunk Enterprise allocates system-wide resources like file descriptors and user processes on *nix systems for monitoring, forwarding, deploying, searching, and other things. The ulimit command controls access to these resources which must be set to acceptable levels for Splunk Enterprise to function properly on *nix systems. Below are the settings for core file size, max number of open file descriptors and max number of processes on the Splunk instances in this environment. For details on how to choose for specific environment, see Considerations regarding system-wide resource limits on *nix systems.
* soft nofile 65536
* hard nofile 131072
* soft core unlimited
* soft nproc 258048
* hard nproc 516096
THP (Transparent huge pages): It has been associated with degradation of Splunk Enterprise performance in some Linux kernel versions. For this reason, Splunk recommends that you deactivate THP in your Linux system configuration unless that system runs an application that requires THP. THP is deactivated in this deployment. For more details, see Transparent huge memory pages and Splunk performance.
Monitoring Tools
Various monitoring tools were used in this Splunk deployment:
vSAN Performance Service
vSAN Performance Service is used to monitor the performance of the vSAN environment, using the web client. The performance service collects and analyzes performance statistics and displays the data in a graphical format. You can use the performance charts to manage your workload and determine the root cause of problems.
vSAN Health Check
vSAN Health Check delivers a simplified troubleshooting and monitoring experience of all things related to vSAN. Through the web client, it offers multiple health checks specifically for vSAN including cluster, hardware compatibility, data, limits, physical disks.
VMware vRealize® Operations™
vSphere and vSAN 6.7 and later releases include vRealize Operations within vCenter. This new feature allows vSphere customers to see a subset of intelligence offered up by vRealize Operations through a single vCenter user interface. Light-weight purpose-built dashboards are included for both vSphere and vSAN. It is easy to deploy, provides multi-cluster visibility, and does not require any additional licensing.
Splunk Monitoring Console
The Monitoring Console is a search-based monitoring tool that lets you view detailed information about the topology and performance of your Splunk Enterprise deployment. The Monitoring Console provides pre-built dashboards that give you visibility into many areas of your deployment, including search and indexing performance, resource usage, license usage, and more. You can use the Monitoring console to track the status of all types of deployment topologies, from single-instance (standalone) deployments to complex multi-site indexer clusters.
For more information, see About the Monitoring Console.
Various monitoring tools were used in this Splunk deployment:
Splunk Scale of Deployment and Performance
The scale of this deployment can be understood from the workload and performance metrics. To have a complete understanding of the workload and performance it is not only important to see the metrics from IT infrastructure perspective but also from Splunk application. This section provides this data from both infrastructure and application perspective.
Splunk Metrics:
Splunk monitoring provides the below performance and resource usage data, which is very useful to not only understand the current usage but also to find any performance issues, growth in resource usage and accordingly plan for scalability and resource optimization.
Storage utilization and data retention: The dashboard Indexes and Volumes view in Figure 7 shows number of Indexer instances and shows how disk is being used to store the indexes. The average index size across all indexers was 16 TB, and the total index size across the deployment was 1,179TB. The index size included both hot/warm and cold buckets. It also showed the median data age of around 1 year and oldest was around 5.5 years. This view demonstrated how storage was utilized and could help to evaluate and revise the retention policy.
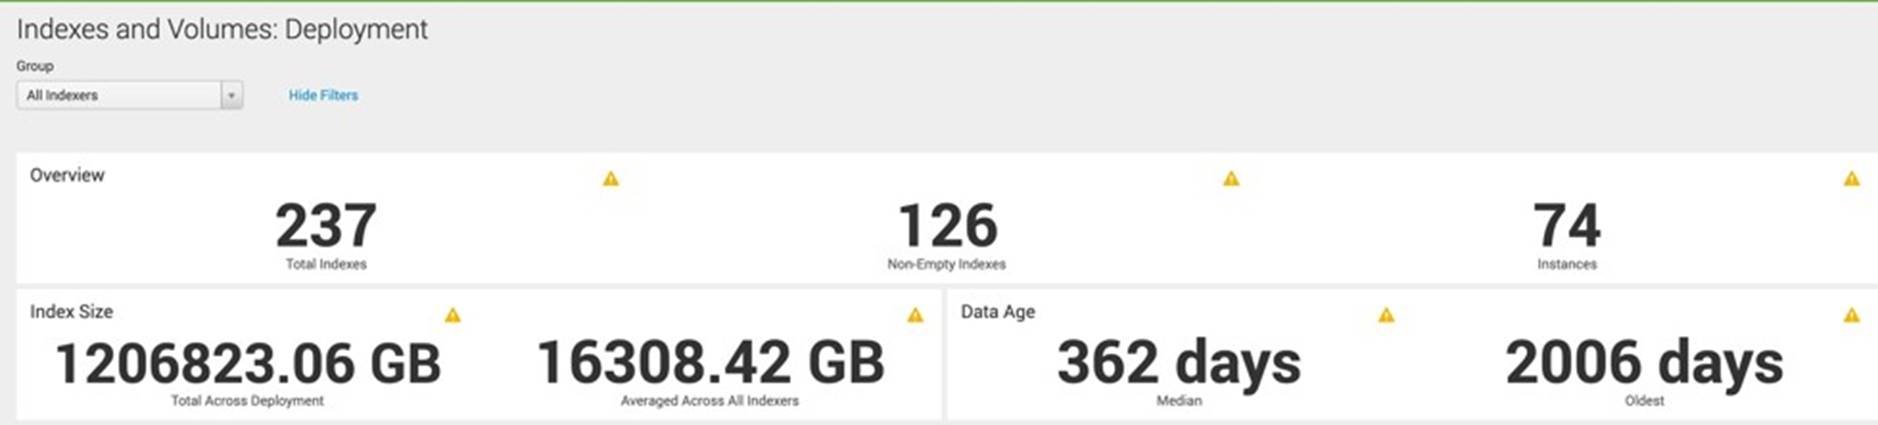
Figure 7. Splunk Indexes and Volume Dashboard
Daily Data Ingestion: Below screenshot in Figure 8 was from daily license usage page in deployment monitor. It showed the ingestion was up to 10TB per day for four weeks. Deployment wide ingestion rate for last few hours in a typical day is shown in Figure 9, the ingestion rate was constant around 160MB/s.
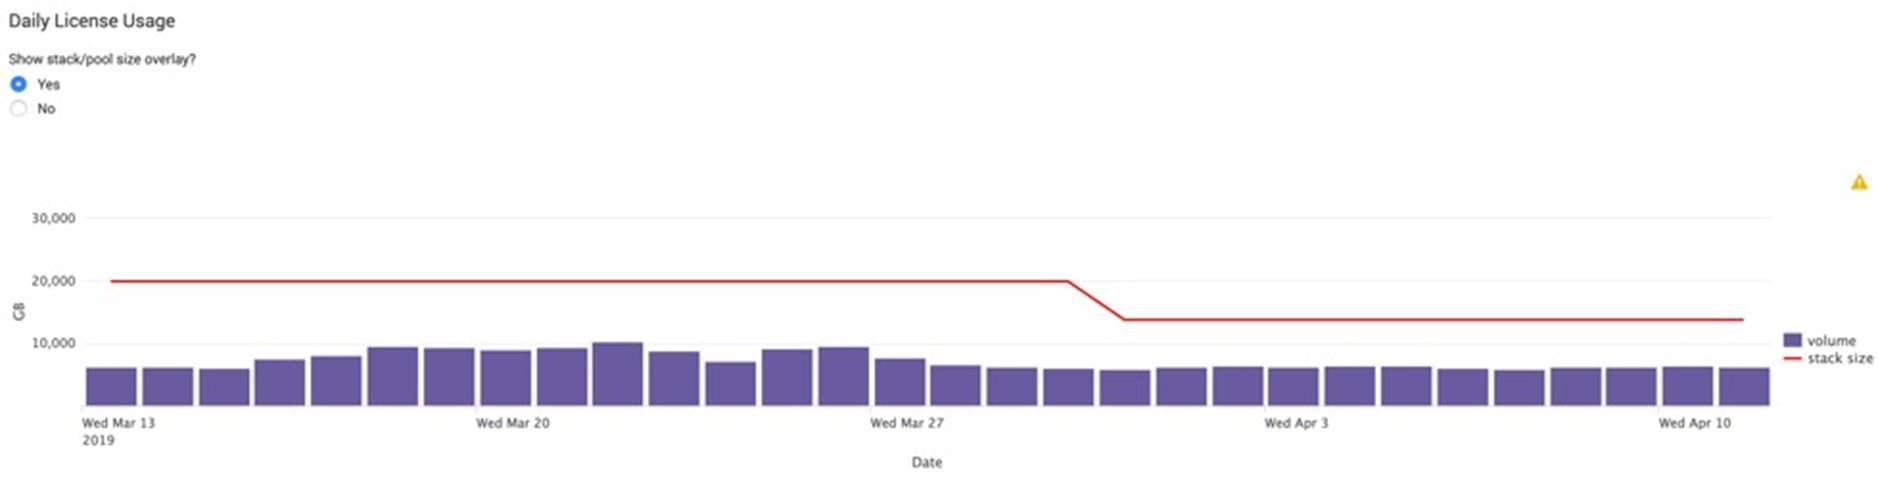
Figure 8. Splunk Daily Data Ingestion and License Usage
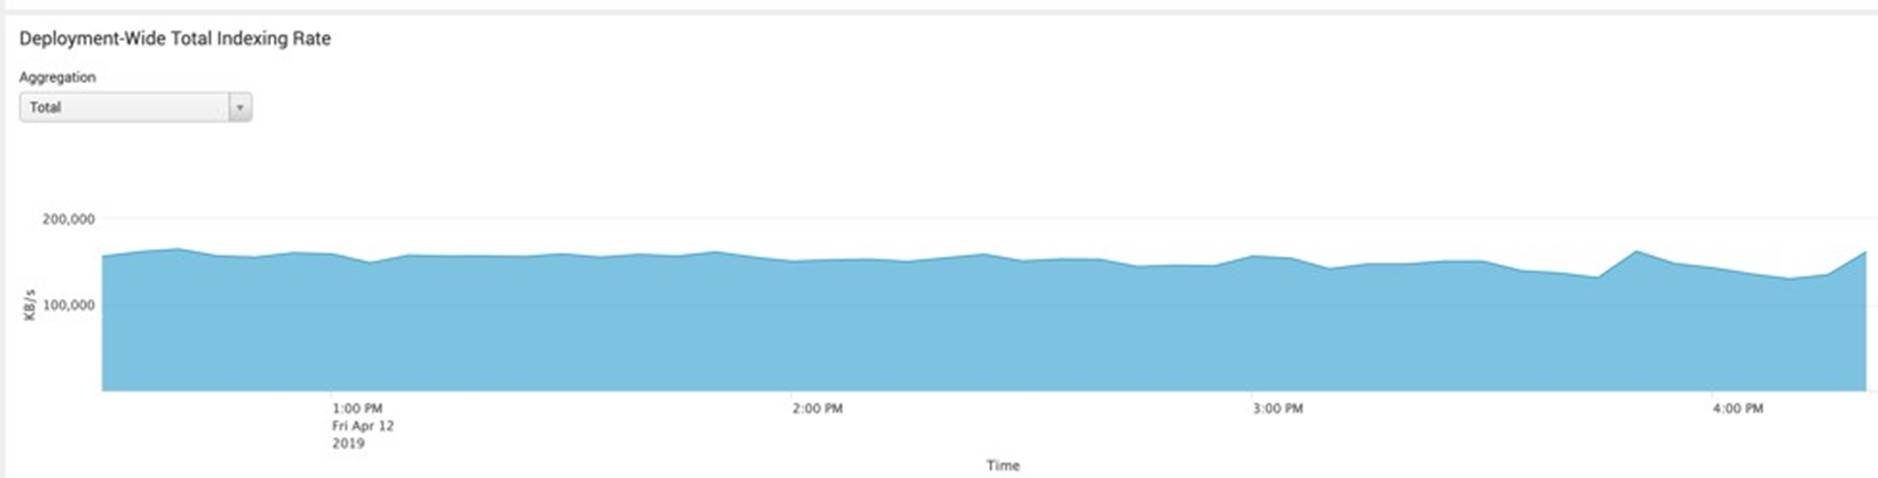
Figure 9. Splunk Deployment-wide Total Indexing Rate in Last 4 Hours
Scheduler Execution by Search Heads:
In this environment, the ad hoc searches were run from primary site search heads and the saved searches were configured to run from secondary site search heads. Figure 10 showed the count of scheduler executions by search heads. One of the search heads in secondary site showed high execution of count of over 4,500 consistently as all the saved searches were scheduled from this search head.
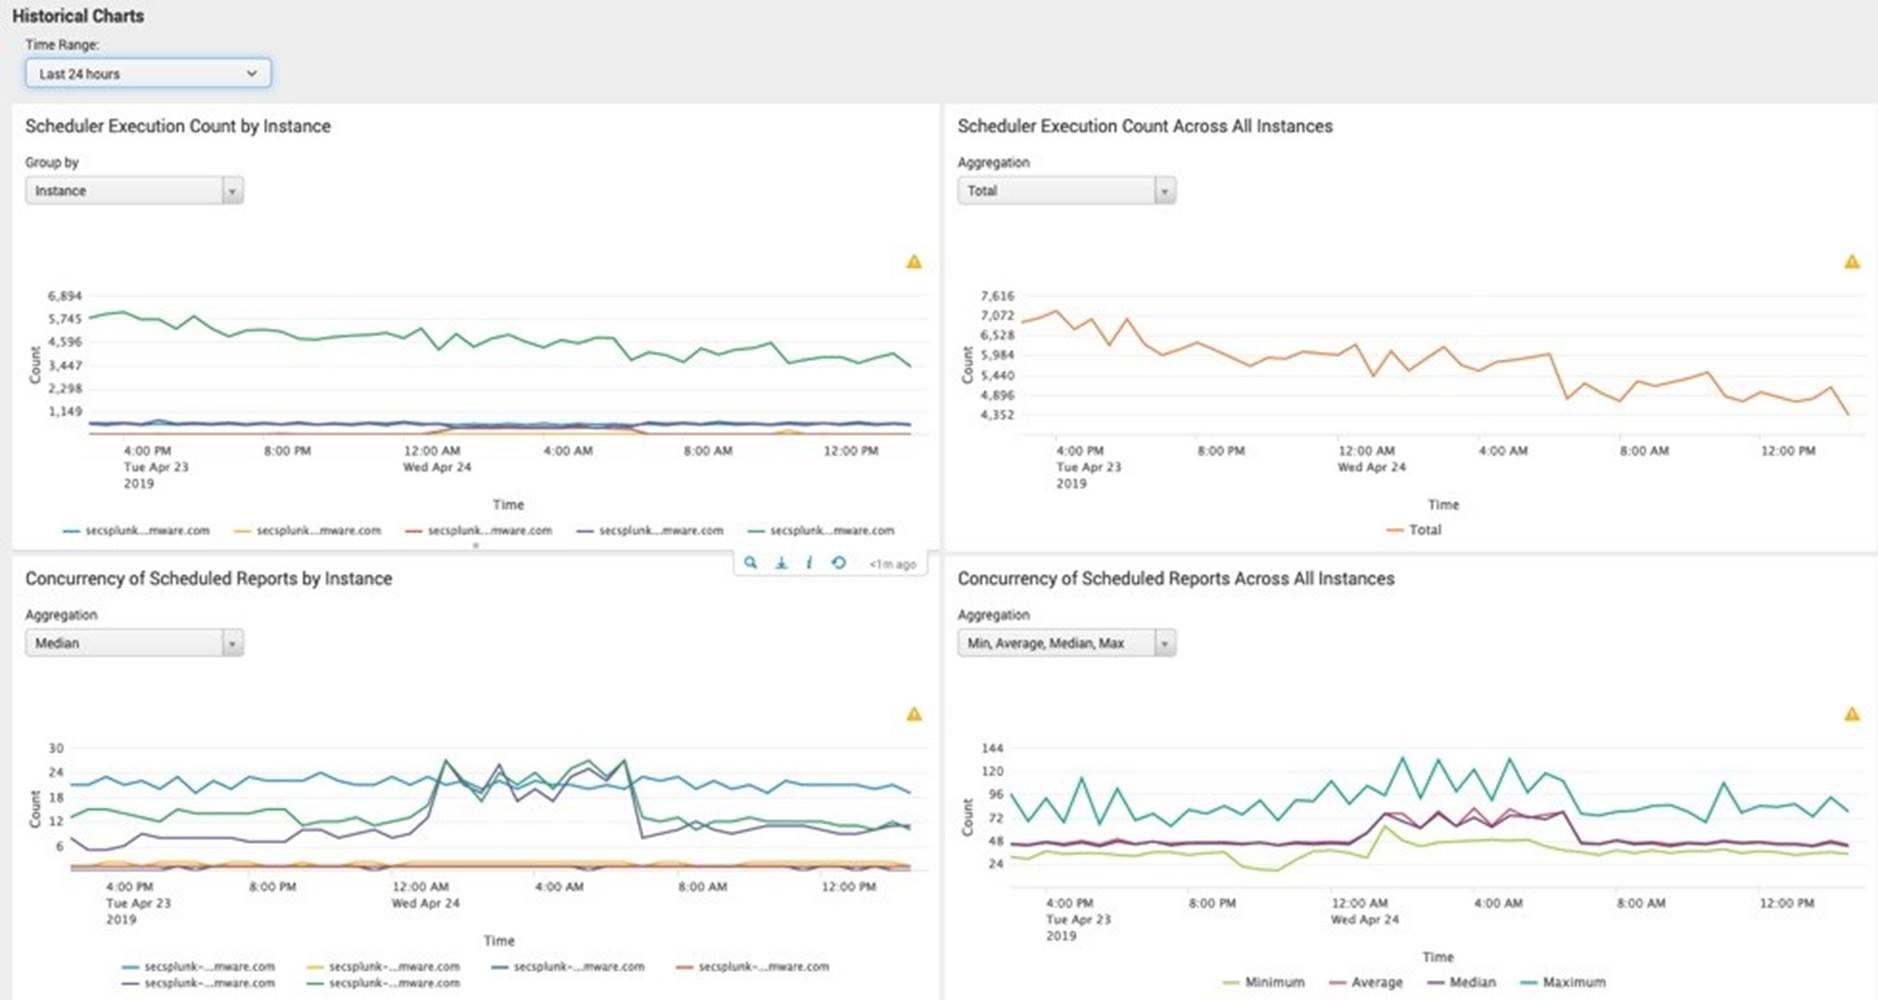
Figure 10. Splunk Scheduler Execution by Search Heads
vSAN and vSphere Performance Metrics:
VMware vRealize® Operations is used to collect the performance metrics from vSphere and vSAN. A 24-hour period utilization metrics was collected on a random day from vRealize Operations and presented below.
IO Size: IO Size is one of the key metrics to understand the storage workload from the application perspective. This can also help to size the vSAN cluster appropriately to deliver the required performance for application. The below Figure from vRealize Operations data shows write and read IO size from Primary vSAN cluster 1. The average write IO is 74KB and read IO size is 96KB. This data helps to understand that the IO size of this workload is quite different from traditional OLTP application IO sizes of 8KB. The IO size observed same across other vSAN clusters as well.
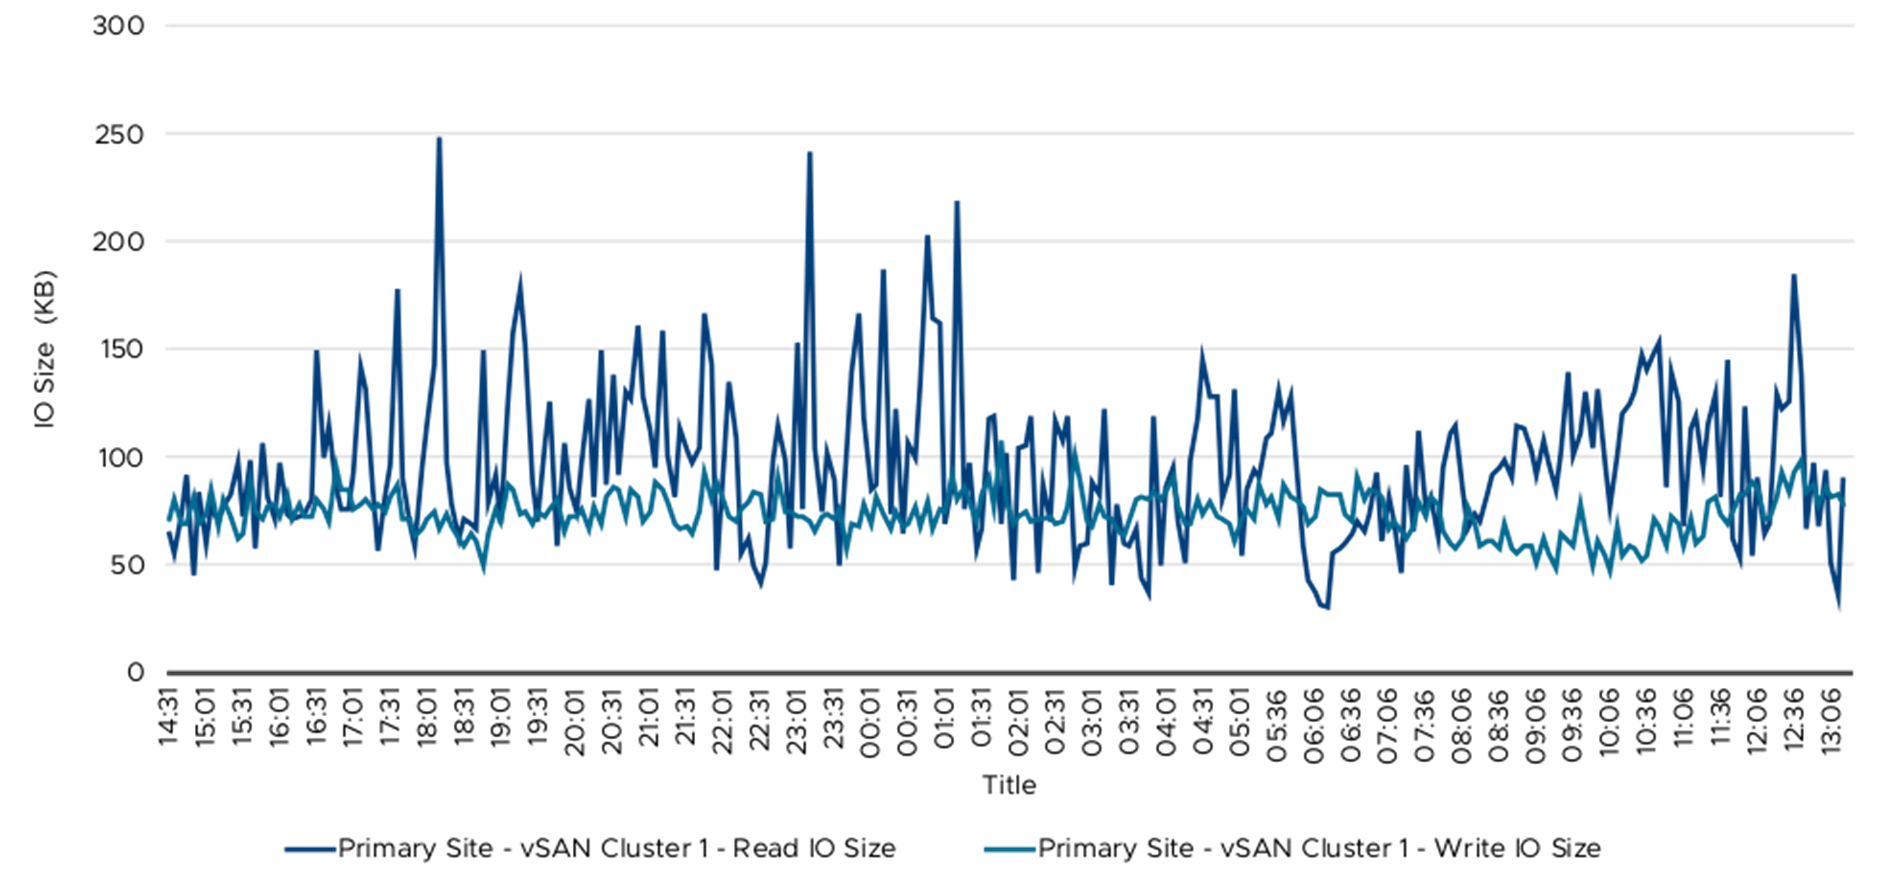
Figure 11. IO Size—Primary Site vSAN Cluster 1
IOPS and Throughput from vSAN Clusters
The following tables and graphs showed the read and write throughput and IOPS from the vSAN cluster. Table 8 summarized the vSAN throughout and IOPS data. The 76 Splunk Indexer VMs were spread across these four vSAN clusters and the IO workload was primarily from these Indexer VMs. The write IO was primarily due to data ingestion, which happened throughout the 24-hour period and the majority of peak read IO was during ad hoc and saved searches. The ad hoc and saved searches were primarily during the day time when the security analyst was monitoring and creating reports.
Table 7 and Table 8 summarized vSAN throughout and IOPS metrics. Figure 12 to Figure 19 demonstrated the detailed read and write data on primary and secondary sites.
Table 7. vSAN Clusters—IO Throughput
|
Cluster |
Average Write IO Throughput (MBps) |
Peak Write Throughput (MBps) |
Average Read IO Throughput (MBps) |
Peak Read Throughput (MBps) |
|
Primary Site – vSAN Cluster 1 |
300 |
380 |
50 |
4,000 |
|
Primary Site – vSAN Cluster 2 |
300 |
380 |
50 |
2,000 |
|
Secondary Site – vSAN Cluster 1 |
225 |
330 |
50 |
3,400 |
|
Secondary Site – vSAN Cluster 2 |
225 |
370 |
50 |
2,400 |
Table 8. vSAN Clusters—IOPS
|
Cluster |
Average Write IOPS |
Peak Write IOPS |
Average Read IOPS |
Peak Read IOPS |
|
Primary Site – vSAN Cluster 1 |
4,100 |
7,600 |
~500 |
45,000 |
|
Primary Site – vSAN Cluster 2 |
4,100 |
5,900 |
~500 |
32,000 |
|
Secondary Site – vSAN Cluster 1 |
3,700 |
5,100 |
~500 |
31,000 |
|
Secondary Site – vSAN Cluster 2 |
3,700 |
6,100 |
~500 |
22,500 |

Figure 12. Write Throughput—Primary Site vSAN Clusters

Figure 13. Write Throughput—Secondary Site vSAN Clusters
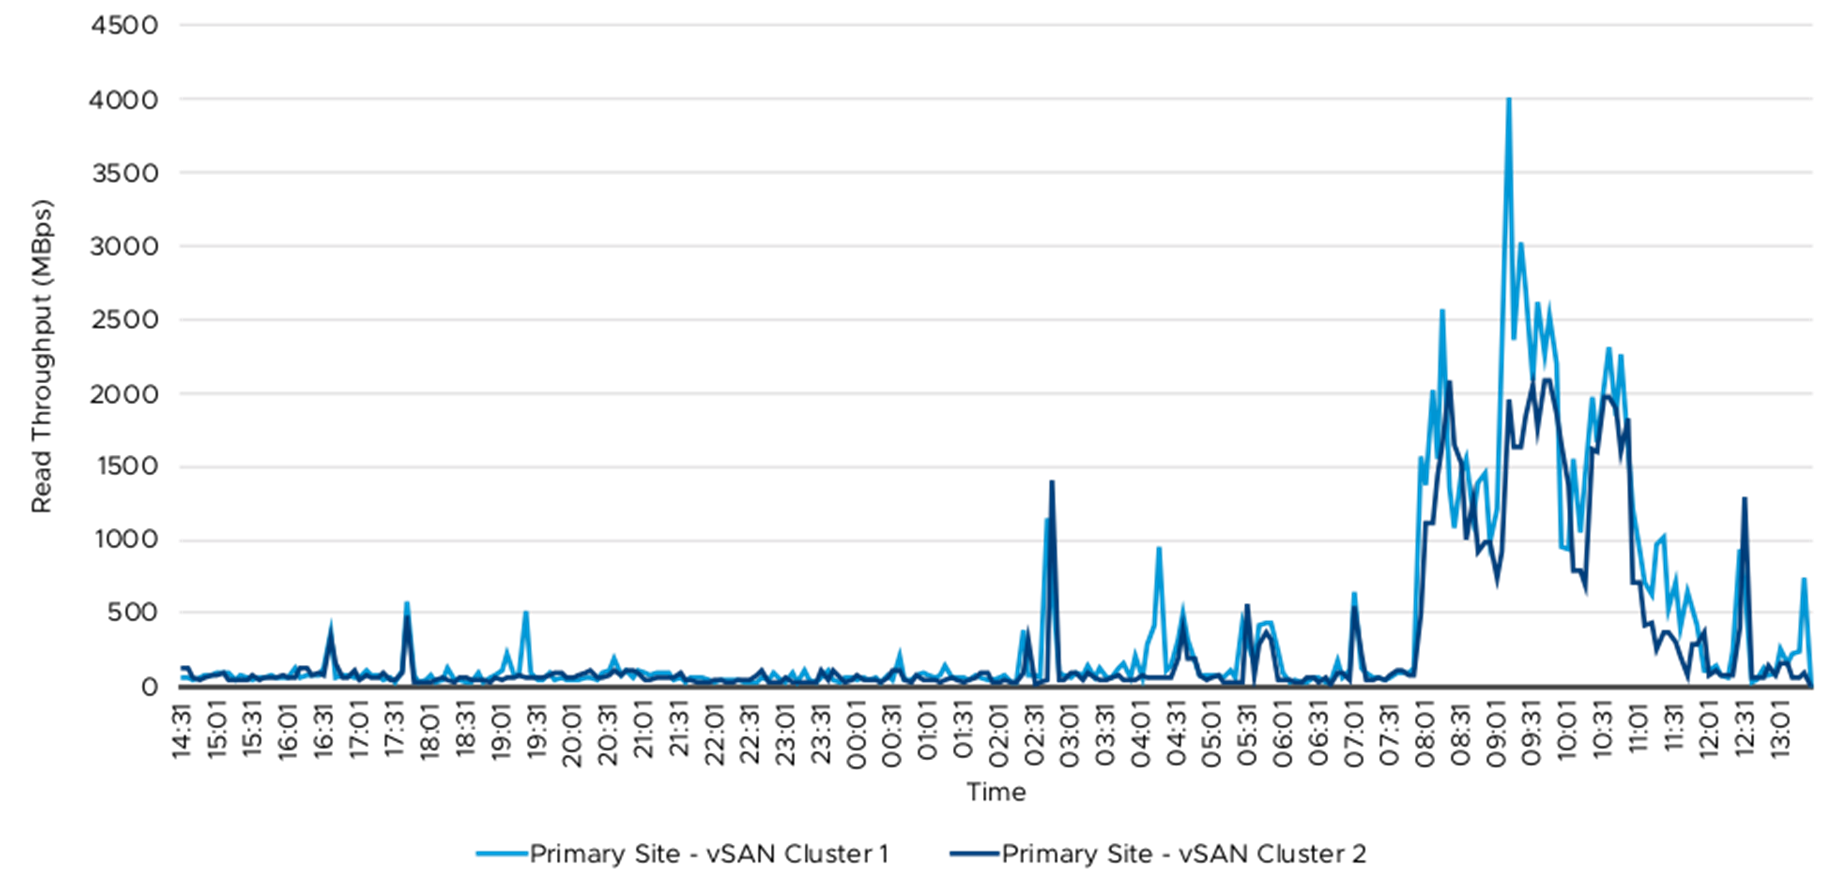
Figure 14. Read Throughput—Primary Site vSAN Clusters

Figure 15. Read Throughput—Secondary Site vSAN Clusters
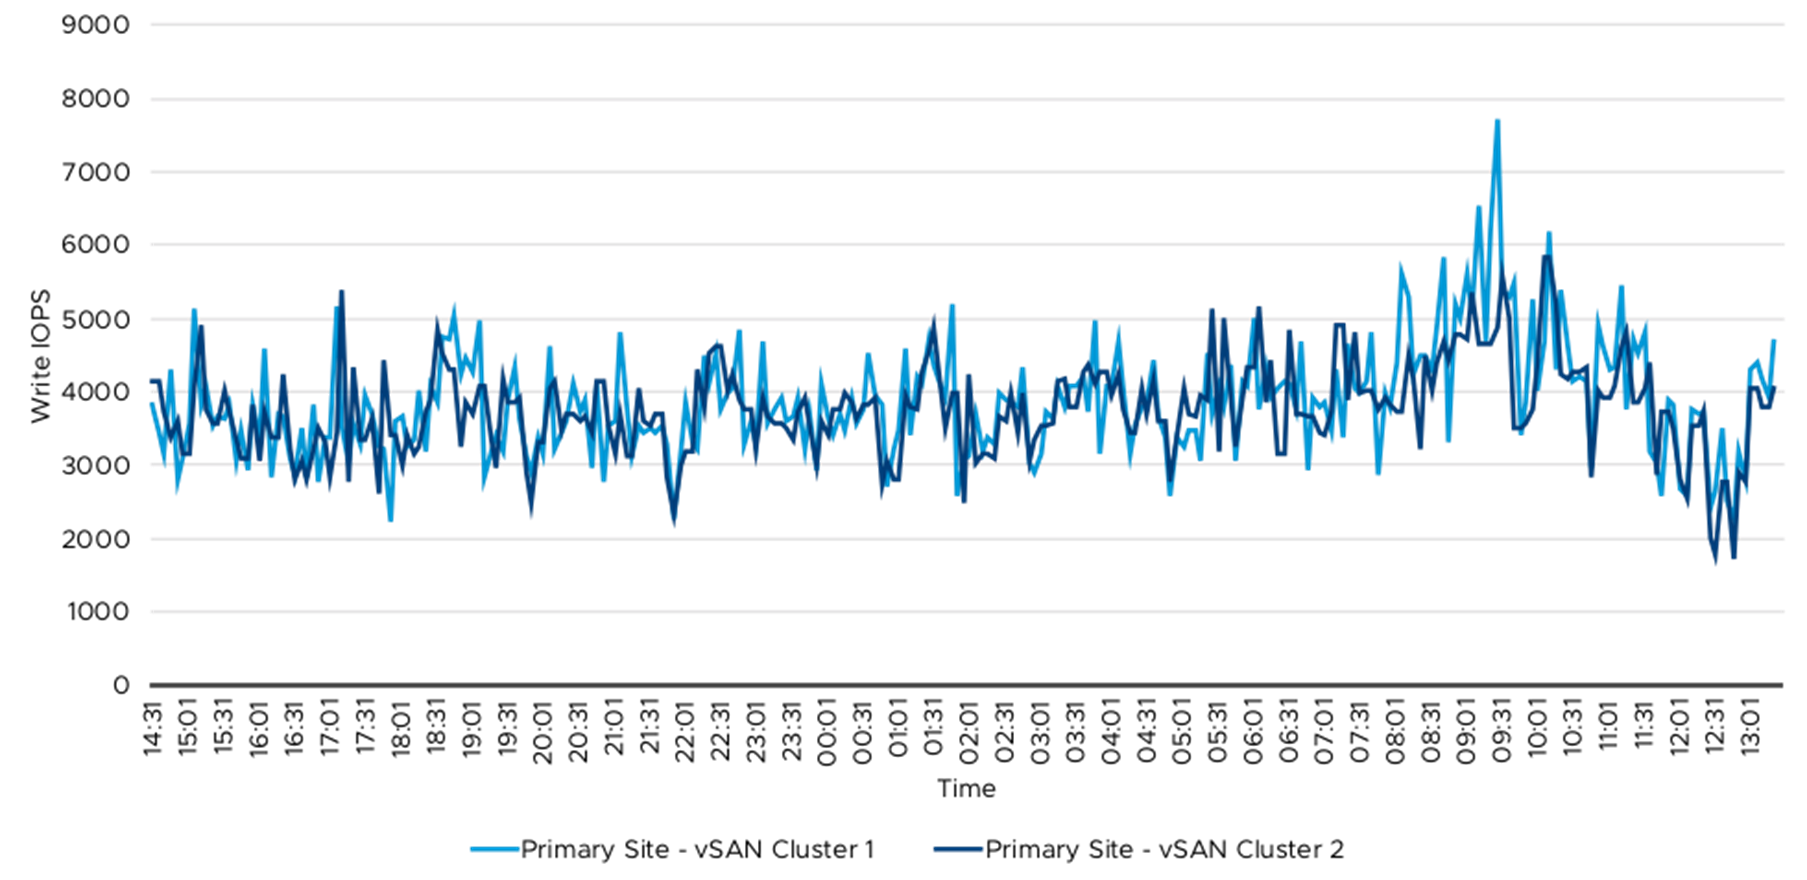
Figure 16. Write IOPS—Primary Site vSAN Clusters

Figure 17. Write IOPS—Secondary Site vSAN Clusters 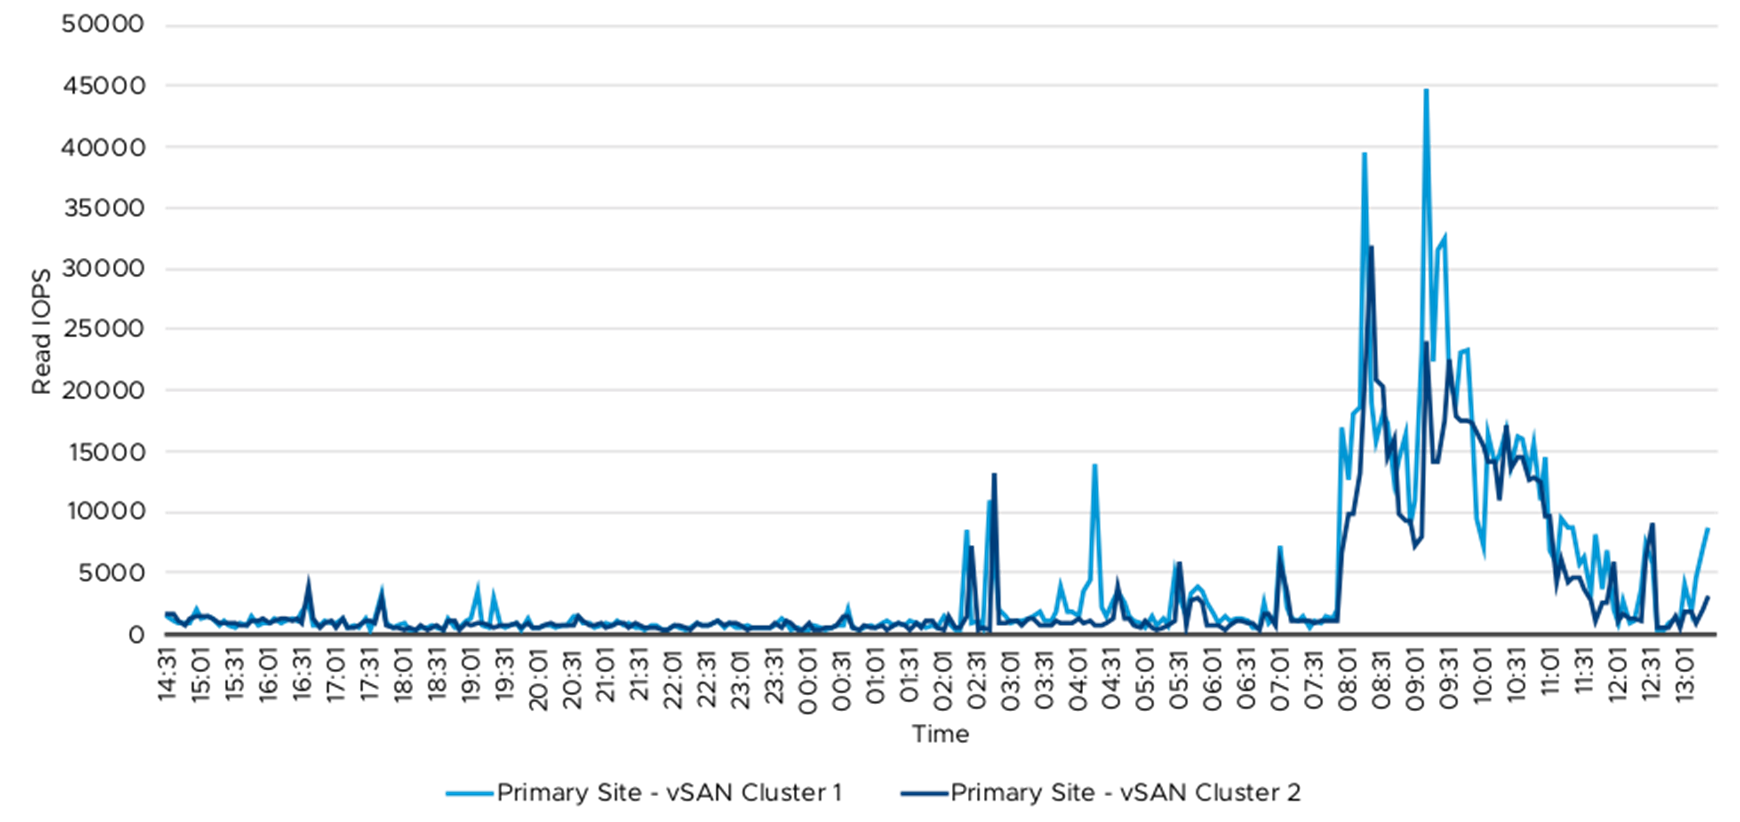
Figure 18. Read IOPS—Primary Site vSAN Clusters
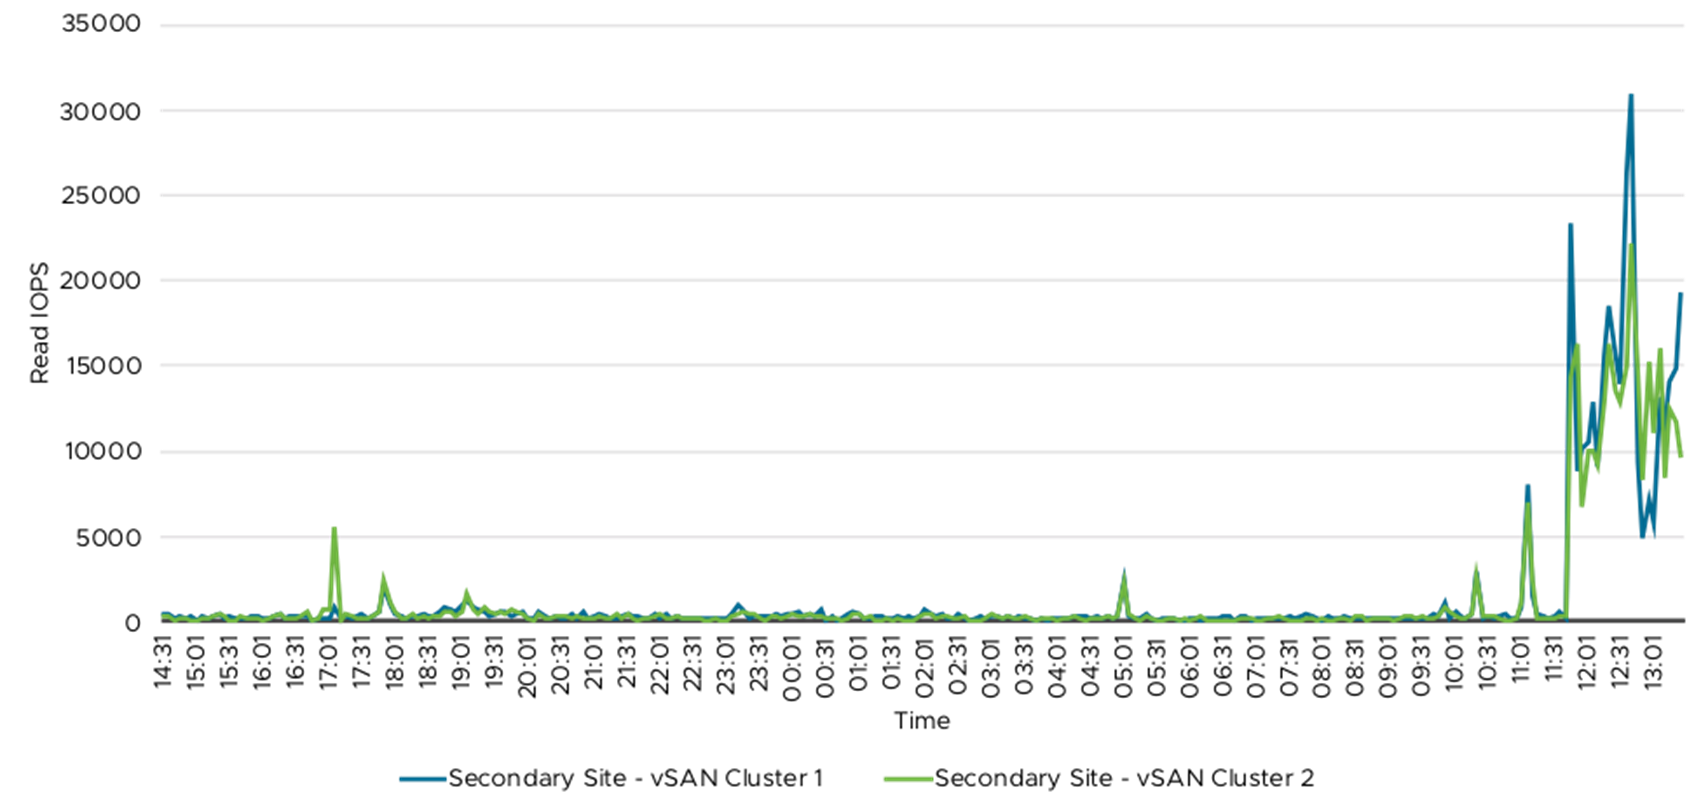
Figure 19. Read IOPS—Secondary Site vSAN Clusters
CPU and Memory Utilization of Key Splunk Instances
The following elements have significant impact on Splunk enterprise performance and resource usage.
![]() Amount of Incoming data: The more data you send to Splunk Enterprise, the more time it needs to process the data into events that you can search, report, and generate alerts on.
Amount of Incoming data: The more data you send to Splunk Enterprise, the more time it needs to process the data into events that you can search, report, and generate alerts on.
![]() Amount of Indexed data: As the amount of data stored in a Splunk Enterprise index increases, so does the I/O bandwidth needed to store data and provide results for searches.
Amount of Indexed data: As the amount of data stored in a Splunk Enterprise index increases, so does the I/O bandwidth needed to store data and provide results for searches.
![]() Number of concurrent users: If more than one person at a time uses an instance of Splunk Enterprise, that instance requires more resources for those users to perform searches and create reports and dashboards.
Number of concurrent users: If more than one person at a time uses an instance of Splunk Enterprise, that instance requires more resources for those users to perform searches and create reports and dashboards.
![]() Number of saved searches: If you plan to invoke a lot of saved searches, Splunk Enterprise needs capacity to perform those searches promptly and efficiently. A higher search count over a given period of time requires more resources.
Number of saved searches: If you plan to invoke a lot of saved searches, Splunk Enterprise needs capacity to perform those searches promptly and efficiently. A higher search count over a given period of time requires more resources.
![]() Types of searches used: Almost as important as the number of saved searches is the types of search that you run against a Splunk Enterprise instance. There are several types of search, each of which affects how the indexer responds to search requests.
Types of searches used: Almost as important as the number of saved searches is the types of search that you run against a Splunk Enterprise instance. There are several types of search, each of which affects how the indexer responds to search requests.
For more details, see different dimensions affecting Splunk performance and resource utilization.
For example, an indexer needs to dedicate one of its available CPU cores for every search that a user invokes for as long as the search is active. If multiple users are logged in and running searches, the number of available CPU cores can be exhausted quickly. Hence there should be CPU headroom available to accommodate peak user login and appropriately use setting in limits.conf to restrict the number of concurrent search each user can fire. See how concurrent users and searches impact performance documentation on examples on how to manages these searches effectively with available resources.
Table 9 shows the CPU and memory usage (%) for some of the key Splunk instances by type. In a Splunk environment various factors affect the utilization of the CPU and memory resources. The Splunk instances are currently sized for peak user login and searches and these data are taken on a typical day hence the resource usage may not be representative of peak user login and searches. Figure 20 to 24 provides the CPU and memory usage over 24 hour period. Depending on when the adhoc and saved searches are run observe the usage (%) variation. The data presented here is for one of the indexer and search head VM present in the environment, other VMs playing the same role has similar resource utilization.
Table 9. CPU and Memory Utilization for Key Splunk Instances
|
Virtual Machine |
Average CPU Usage (%) |
Peak CPU Usage (%) |
Average Memory Usage (%) |
Peak Memory Usage (%) |
|
Primary Site Indexer VM 1 |
55 |
73 |
25 |
48 |
|
Secondary Site Indexer VM 1 |
30 |
46 |
17 |
22 |
|
Primary Site Search head VM 1 |
5 |
28 |
5 |
7 |
|
Secondary Site Search Head VM 1 |
12 |
25 |
7 |
13 |
|
[1] ES Server VM |
15 |
20 |
35 |
45 |
At a given time, ES Server is running on one site only, vSphere Replication and SRM provides DR.
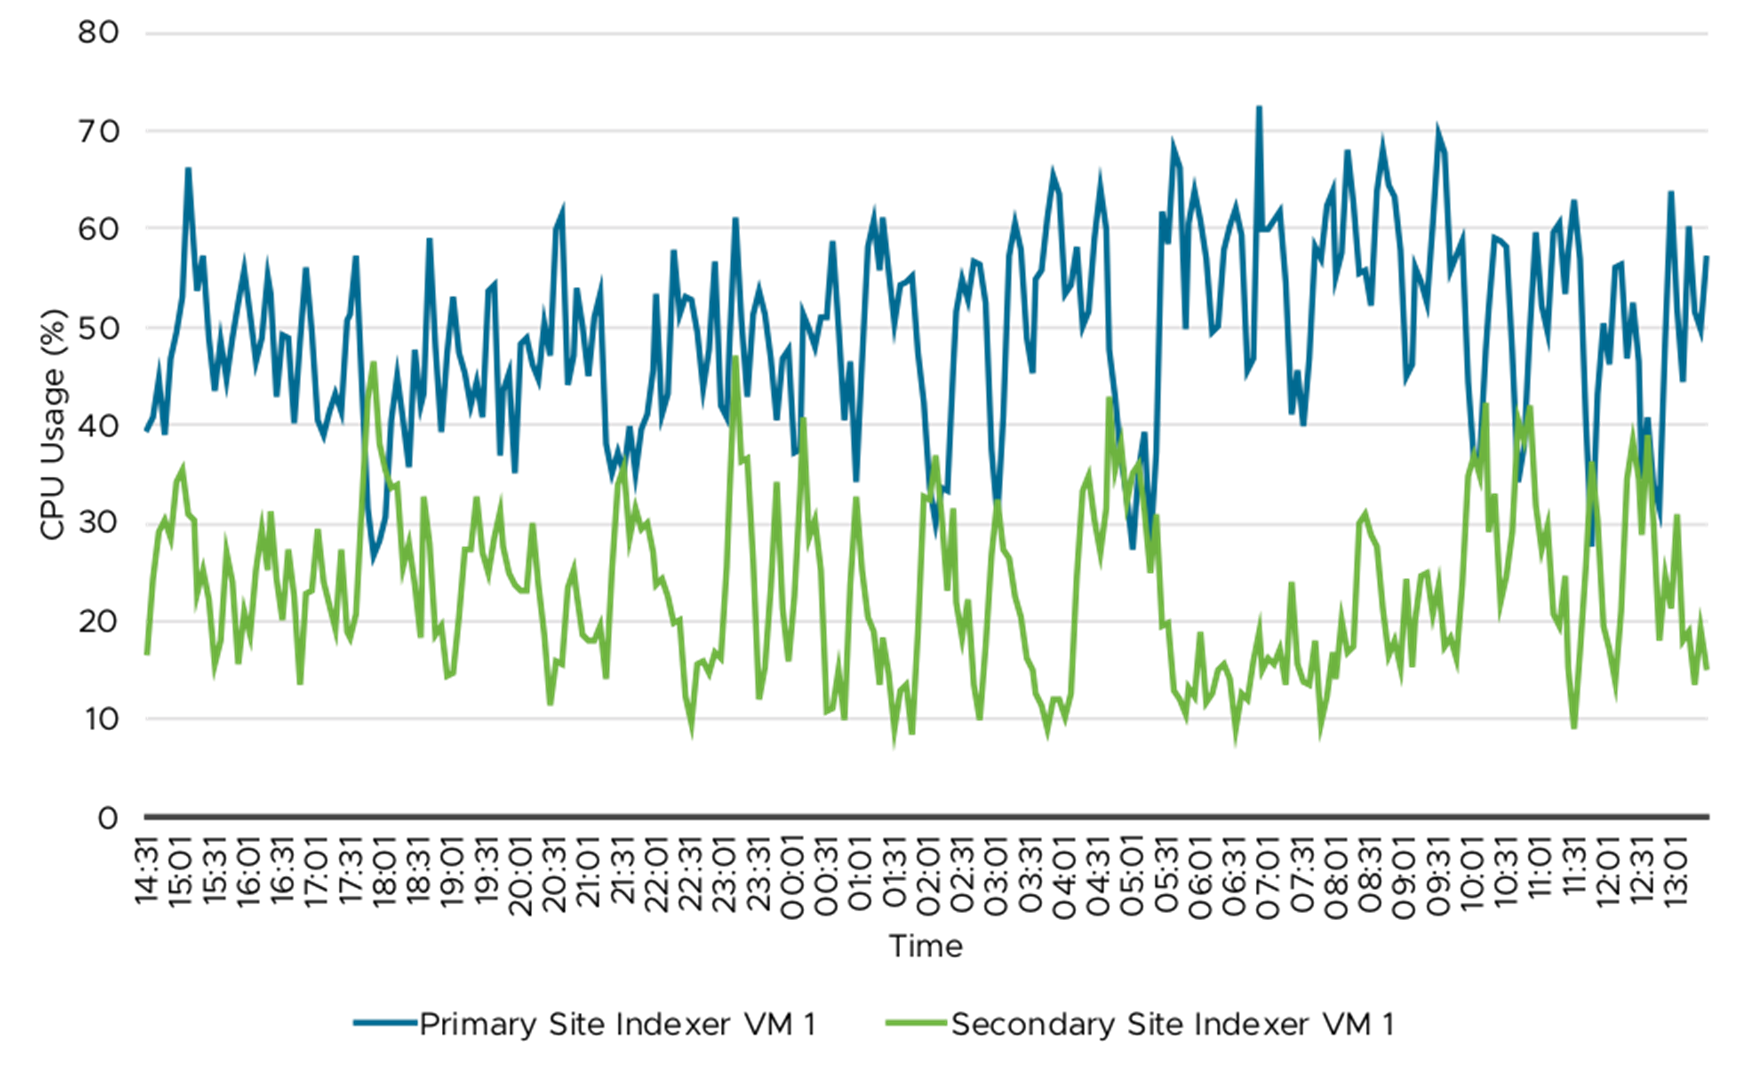
Figure 20. Indexer VM—CPU Usage (%)

Figure 21. Indexer VM—Memory Usage (%)
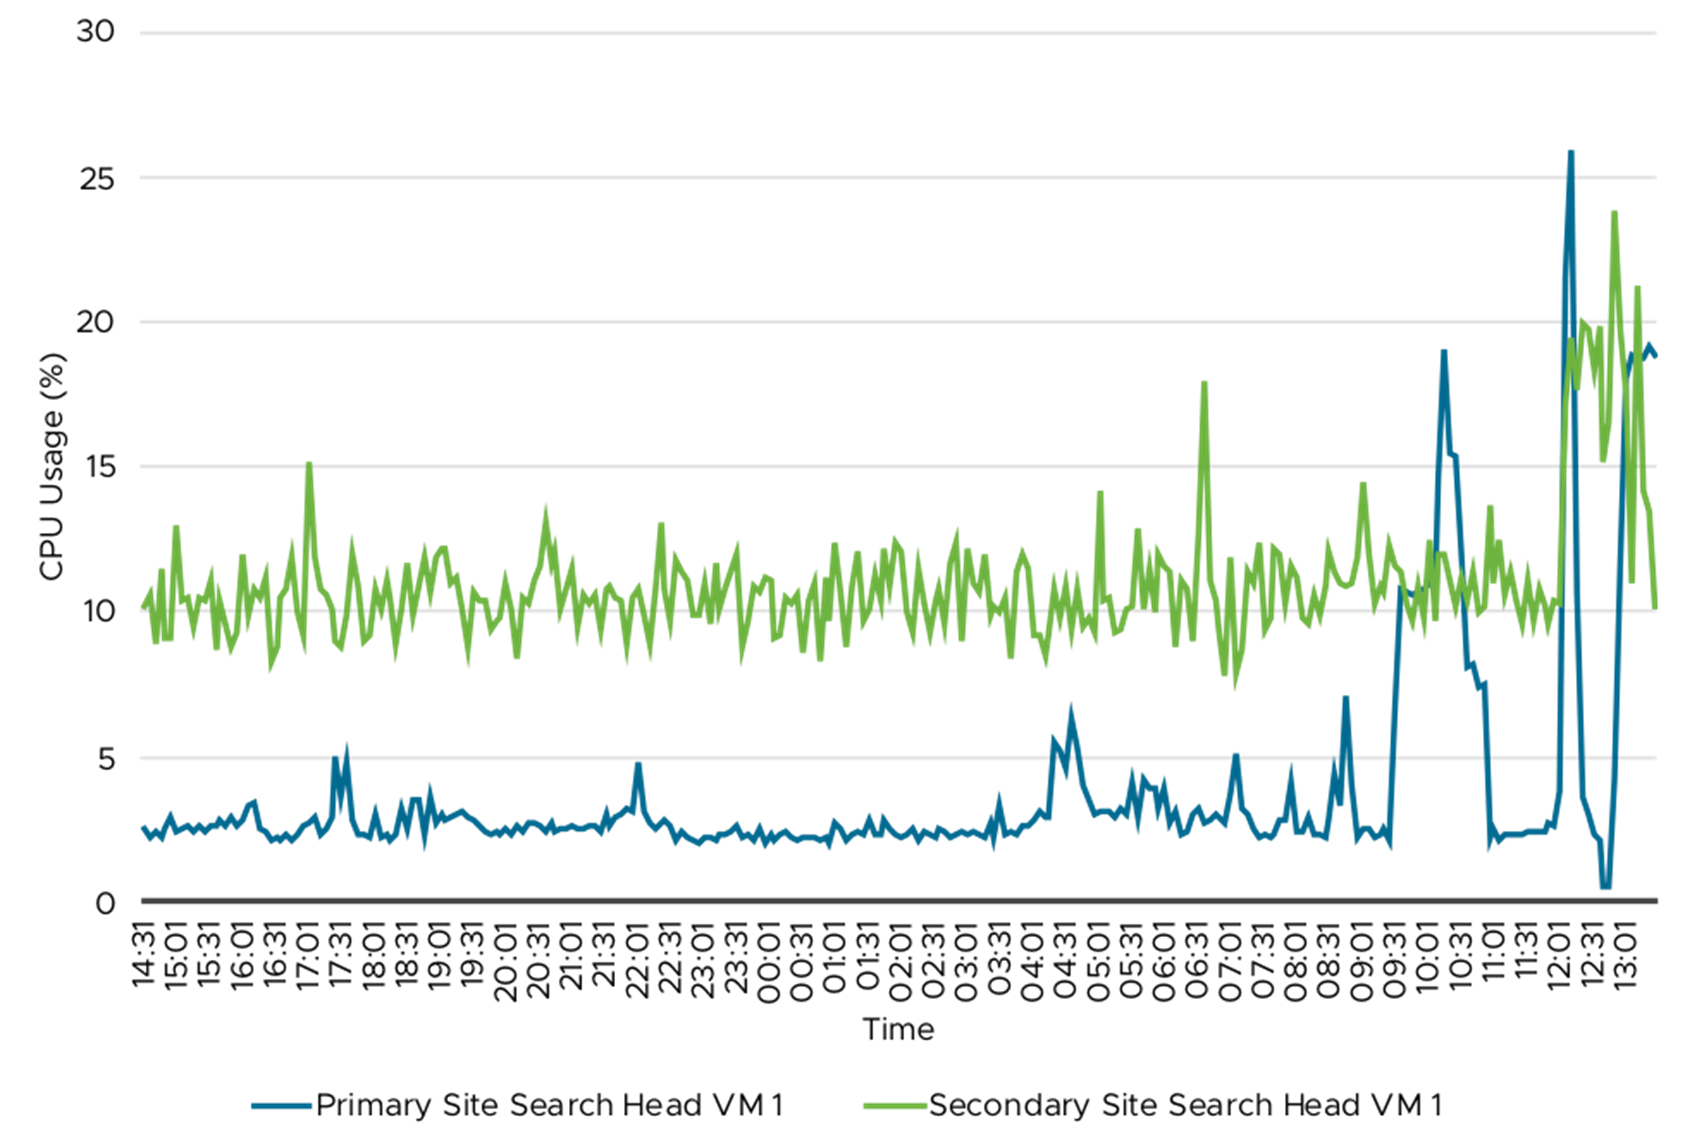 Figure 22.
Search Head VM—CPU Usage (%)
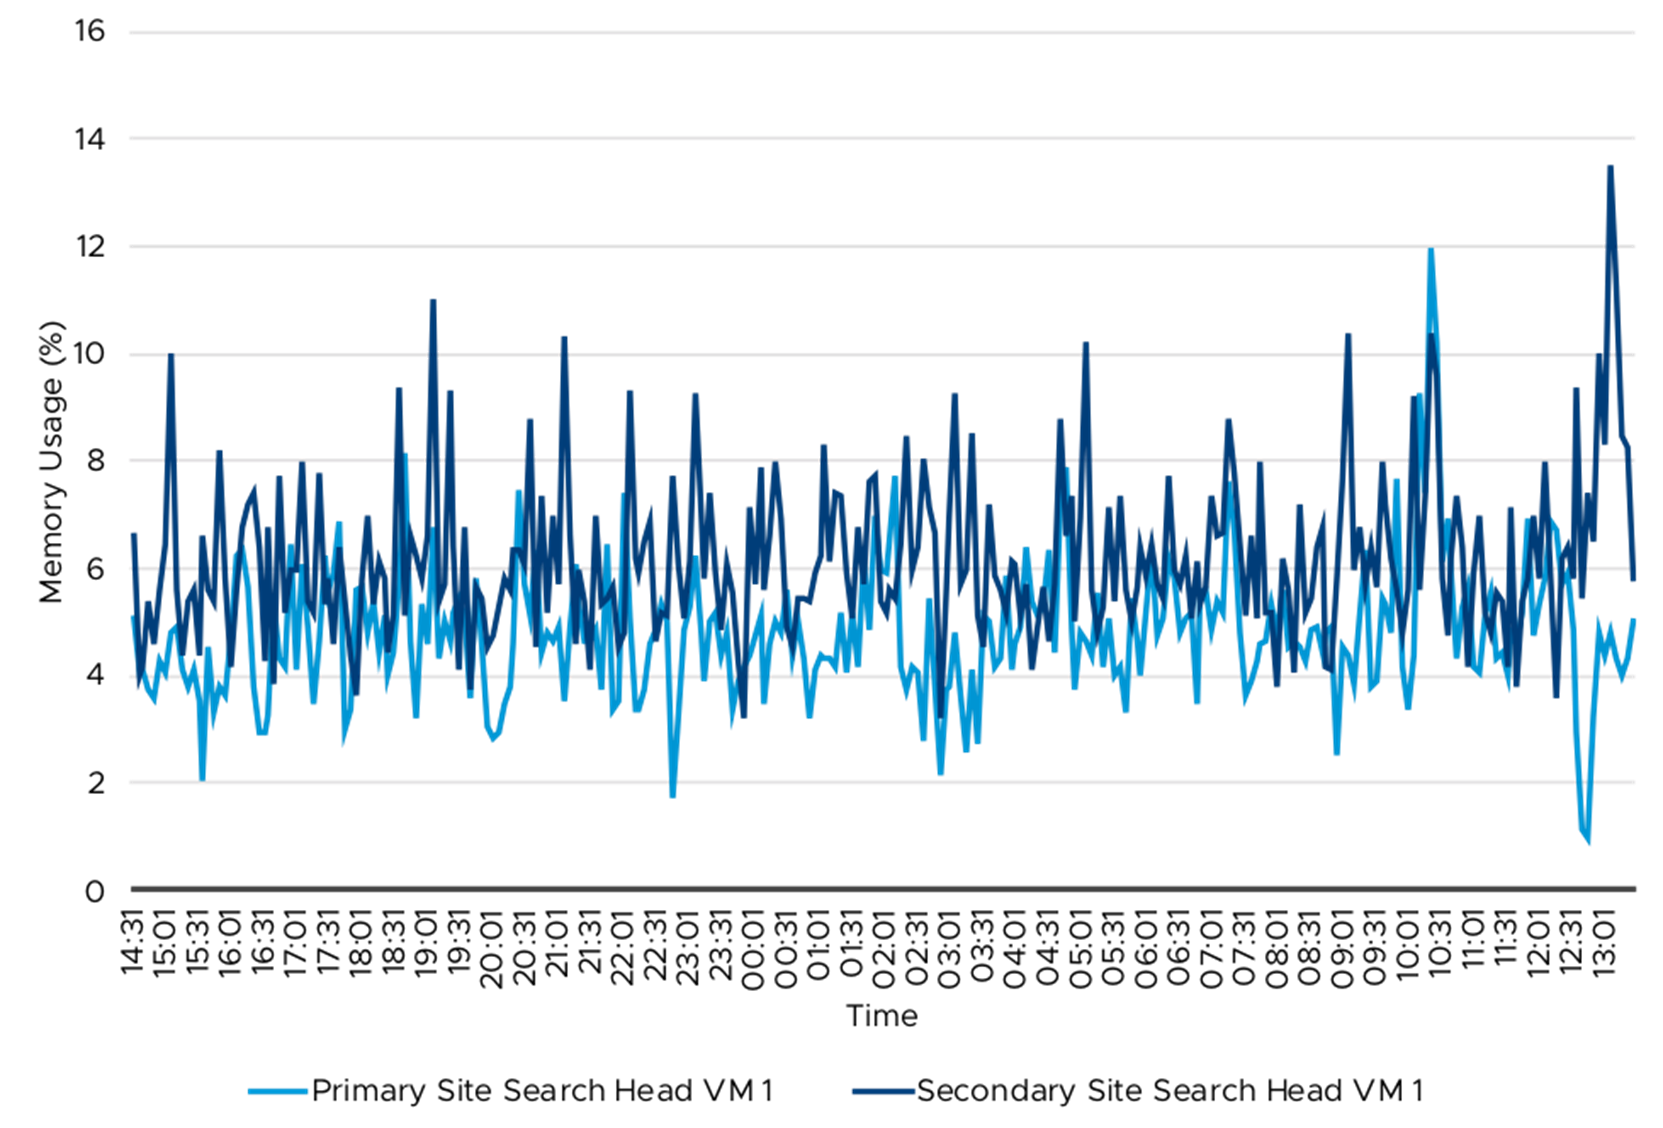
Figure 23. Search Head VM—Memory Usage (%)
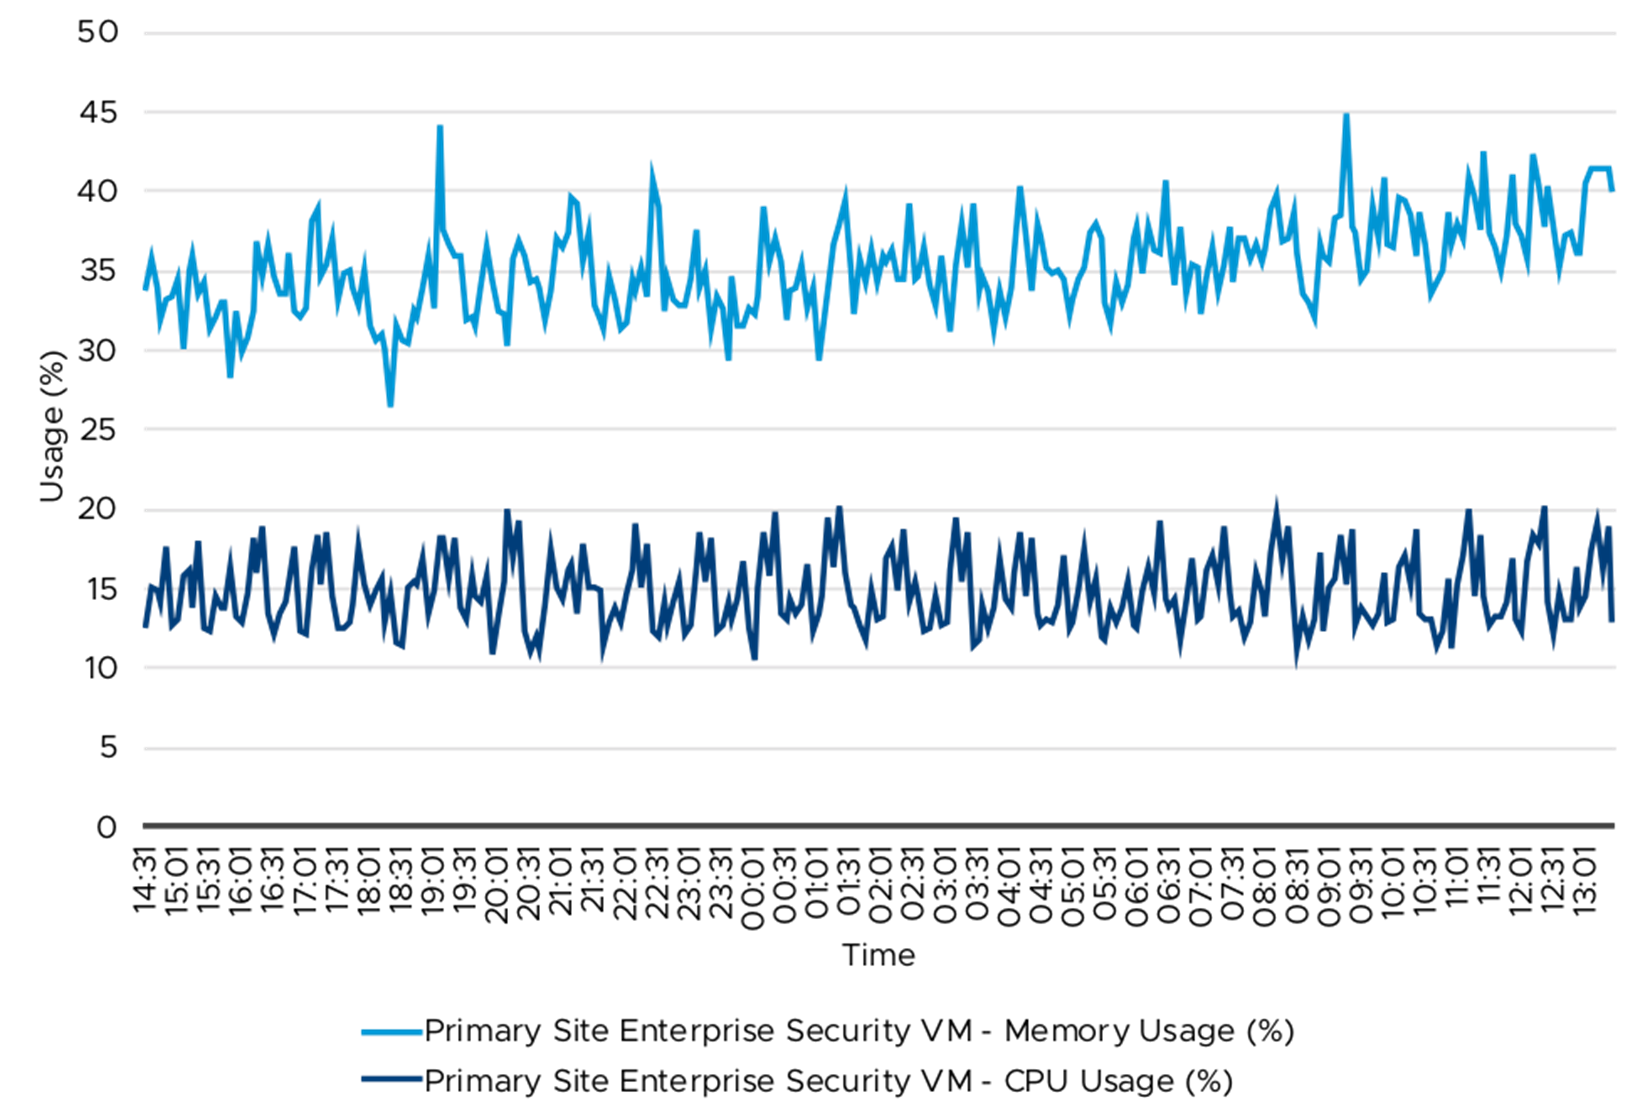 Figure
24. Enterprise Security VM—CPU and Memory Usage (%)
Recommendations for Deploying Splunk on vSAN
A well designed HCI cluster powered by vSAN is key to a successful implementation of Splunk. It is important to not only follow the best practices for vSAN but also best practices for vSphere and recommendation provided by Splunk for virtual environments.
Splunk deployment model differs based on the size of the deployment. Some of the common deployment models as per Splunk are:
- Departmental: A single instance that combines indexing and search management functions.
- Small enterprise: One search head with two or three indexers.
- Medium enterprise: A small search head cluster, with several indexers.
- Large enterprise: A large search head cluster, with large numbers of indexers.
Further, depending on the data ingestion rate, retention period the storage provisioned to the Splunk instance can be one of the following two models:
- vSAN storage
- vSAN storage (hot and warmpath, high performance) + NFS storage (coldpath, large capacity)
For departmental, small enterprise and some of the medium enterprise deployments use vSAN storage without additional NFS storage. This will provide good TCO and ease of management.
For large enterprise deployments and those require multiple years of day retention, use the second option of vSAN storage for hot and warm buckets and external NFS storage for cold buckets.
vSphere VM is flexible to consume vSAN storage and external NFS storage. This choice of options help to achieve a balance of TCO and ease of management.
Depending on the RPO and RTO requirements, choose if disaster recovery site is required. If RPO and RTO is not stringent, single site deployment can be considered. For VMware IT Splunk is business critical application; hence the secondary site is deployed along with vSphere Replication and VMware SRM.
Sizing for Each Role by Splunk:
Splunk virtual machine instances perform different roles. Table 10 lists some of the key roles and their VM resource requirements.
Table 10. Virtual Machine Resource Demand by Role
|
|
Standalone or Single instance |
Forwarder |
Indexing (+ search) |
Search heads |
|
CPU |
X |
* |
X |
X |
|
Memory |
X |
* |
X |
X |
|
Storage IO |
X |
* |
X |
X |
|
Networking |
X |
X |
X |
X |
* The above demand is a general comparison between the instance roles; however, there are exceptions. Like some forwarders used for Amazon Web services (AWS), add-on applications need considerable CPU, memory, and storage IO.
- Forwarder: Used to forward data to indexer and sized by GB/day, example size 250GB/day and would result in ~ 23+Mbit/s data ingestion. Mainly network bounded with low CPU and memory demand. Does not consume much storage except for small OS disk capacity. However, there are exceptions like some forwarders used for Amazon Web services (AWS), the add-on application needs considerable CPU, memory, and storage IO.
- Search heads: Executes searches against indexers and CPU bound to perform optimum against the indexer for the initiated search.
- Indexer: Database and Index requires most of the resources because processing the search head request and data ingestion and indexing. This is also storage capacity heavy and it executes high IO demand on the storage system.
Below is approximate method for sizing storage and checking its capability before deploying Splunk. It usually starts at 1,200 IOPS but the solution typically executes against the storage with very high outstanding I/O (OIO >200) per disk with usually a block size of ~64KB and results in 1,200 IOPS x 64KB /1024 = 75MB/s minimum transfer rate. Splunk considers IO profile with 50/50% read/writes, 1,200 IOPS minimum.
Splunk upscaling per data pipeline (Indexer)
Each data pipeline usually increases the IO demand by 300-400 IOPS (source: link)
Table 11. Splunk Upscaling per Data Pipeline
|
Data Pipelines |
Extra CPU |
Physical IOPS |
VM IOPS |
|
1 |
Default (12cores, 2+ GHz or better) |
800 |
1200 |
|
2 |
4-6 |
1,100-1,200 |
1,500-1,600 |
|
3 |
10-12 |
1,500-1,600 |
1,700-1,800 |
|
4 |
16-18* |
1,700-1,800 |
2,100- 2,200 |
*High performance setup requires up to 48 CPU (>2GHz). (link)
See Using Splunk enterprise with VxRail Appliances and Isilon for analysis of machine data for few common Splunk validated sizing configurations.
For the detailed Splunk Enterprise capacity planning, see Splunk Enterprise Capacity Planning Manual including how to scale your existing Splunk Enterprise deployment.
For Splunk Enterprise Security capacity planning, see Splunk Enterprise Security Installation and Upgrade Manual.
Splunk has provided recommendations for virtualization in Deploying Splunk Enterprise Inside Virtual Environments. All these recommendations along with performance best practices guide for appropriate vSphere version need to be followed while provisioning VM and allocating vSAN storage. See the vSphere best practices guide for vSphere 6.7 here.
Some of the key recommendation based on above documentation for Splunk VM are as follows:
- Do not oversubscribe hardware resources. Reserve all CPU and memory resources for key Splunk VMs; for example, Indexer, Search Head, and ES Search Head. Exception would be for Splunk management components like Deployment Server and License Server that are not resource intensive, oversubscription might be considered in that case.
- Splunk does not take advantage of hyperthreading; hence consider only the physical CPU cores for all sizing purpose.
- Usage of vNUMA, configure vCPU as “x cores per socket” as mentioned in the “Splunk Virtual Machine” section.
- Disable Transparent Huge pages, see Transparent huge memory pages and Splunk performance for details.
- Use high performance and efficient PVSCSI storage adapter.
- Provision multiple disks (at least 4) to Indexer VM with disk spread across the 4 PVSCSI adapters.
- Change IO scheduler to NOOP or deadline (>3.x kernels in Linux). See VMware KB 2011861 for details.
- Use Linux volume manager to create logical volume from multiple disks and use high performance and efficient xfs filesystem.
- Use vmxnet3 adapter usage in VM guest. The VMXNET 3 adapter is the next generation of a Paravirtualized NIC designed for performance. See VMware KB 1001805 for details.
Other vSAN Specific Recommendations:
vSAN Design and Sizing Guide provides a comprehensive set of guidelines for designing vSAN. A few key guidelines for this workload:
- vSAN is a distributed object-store datastore formed from locally attached devices from the ESXi host. It uses disk groups to pool together flash devices as single management constructs. Therefore, it is recommended to use similarly configured and sized ESXi hosts for vSAN Cluster to avoid imbalance. For future capacity addition, create disk groups with similar configuration and sizing. This ensures a balance of virtual machine storage components across the cluster of disks and hosts.
- Design for availability. Depending on the failure tolerance method and setting, design with additional host and capacity that enable the cluster to be automatically recovered in the event of a failure and to be able to maintain a desired level of performance.
- Network: vSAN requires a correctly configured network for virtual machine IO as well as communication between cluster nodes. With all-flash Cluster and more importantly with high-speed NVMe devices, network can become a bottleneck during throughput-intensive Splunk workload and during vSAN resynchronization. For network, intensive workloads take advantage of Link Aggregation (LACP) and use larger bandwidth ports like 25Gbps if required. Since Splunk workload is IO throughput intensive, configuring Jumbo Frames for vSAN network can reduce CPU utilization and improve throughput. See the VMware vSAN Network Design guide for details.
- Consider software (vSAN SPBM) and hardware design around the Splunk application IOPS and outstanding I/O:
- Choose Storage controllers that have high queue depth, which helps sustain high outstanding IO from application.
- Consider more uplinks to provide more network queues with common LACP setup.
- Consider vSAN Mirror (if no data ingestion or search issue, use vSAN Erasure coding RAID 5 or 6 for improved TCO).
- If hardware causing a bottleneck, certain aspects around lowering PVSCSI adapter queue depth could hard limit the outstanding I/O initiated by the VM.
- Horizontal scaling spreads across more application VMs with less vCPU to balance the workload.
- For remote replication to other sites, use Splunk level replication using Site Replication factor. This not only helps with disaster recovery but can also help to keep use the resources at DR site as used in VMware IT deployment.
- vSAN deduplication and compression can reduce raw storage capacity consumption and can be used when the application-level compression is not used. In this case, Splunk natively provides compression hence vSAN compression and deduplication may not provide significant savings. Therefore, it is recommended to deactivate deduplication and compression.
- vSAN SPBM provides storage policy management at virtual machine object level. Leverage it to turn on specific features like erasure coding and QoS for required objects.
- See Troubleshooting vSAN Performance as additional resources for performance optimization on vSAN.
Conclusion
Splunk software helps to create hidden value from ever growing machine data. These workloads need massive storage capacity and the infrastructure needs to be flexible, scalable, and provides linear performance increase with scaling. HCI powered by VMware vSAN provides the above requirements for running these big data workloads on top of cost-effective x86 hardware and software.
In addition, we showcase how resources in primary and secondary data centers are efficiently used while providing disaster recovery, using a combination of vSphere Replication and VMware SRM and Splunk level replication.
In conclusion, this case study validates the scalability of deploying Splunk on vSAN is scalable and provides deployment options and best practices.
Reference
For additional information, see the following documents:
- VMware vSAN Design and Sizing Guide
- VMware vSAN Network Design
- Performance Best Practices for VMware vSphere 6.7
- Troubleshooting vSAN Performance – Technical White Paper
- vSAN ReadyNode Sizer
- Using Splunk Enterprise with VxRail appliances and Isilon for analysis of machine data
- Splunk Enterprise Capacity Planning Manual
- Splunk Enterprise Security Deployment Planning
- Other Splunk Documentation
About the Author
Palanivenkatesan Murugan, Solutions Architect in the vSAN Product Enablement team wrote the original version of this case study with critical contributions from below members:
- Kartikay Dwivedi, Cloud Infrastructure Administrator VMware IT
- Jonathan Fu, Senior Information Security Engineer VMware IT
- Andreas Scherr, Senior Solution Architect, vSAN Product Enablement