
vSAN 70u3 Proof of Concept Guide
What’s New in 7.0U3 Proof-of-Concept Guide
vSAN 7.0U3 brings some exciting new changes! This guide includes information around new features such as vSAN over RDMA, vSAN File Services snapshot support, expansion of HCI Mesh, Native KMS for encryptions, Shared Witness and Witness vLCM among others. Also included is information around updated enhancements around vLCM, capacity reporting, planning, alerting, time-based health checks, and advanced networking metrics.
Introduction and prerequisites
Decision-making choices for vSAN architecture.
Plan on testing a reasonable hardware configuration resembling a production-ready environment that suits your business requirements. Refer to the VMware vSAN Design and Sizing Guide for information on design configurations and considerations when deploying vSAN. The hardware you plan to use should be listed on the VMware Compatibility Guide (VCG): this is critical to ensure success and supportability. If you're using a vSAN ReadyNode or VxRail appliance, the factory-installed hardware is guaranteed to be compatible with vSAN, however, BIOS updates, and firmware and device driver versions may be out of date and should be checked for alignment to the VCG. For vSAN software layer specifically, pay particular attention to the following areas of the VCG:
BIOS
Choose "Systems / Servers" from "What are you looking for": http://www.vmware.com/resources/compatibility/search.php

Network cards
Choose "IO Devices" from "What are you looking for" and select "Network" from "I/O Device Type" field: https://www.vmware.com/resources/compatibility/search.php?deviceCategory=io

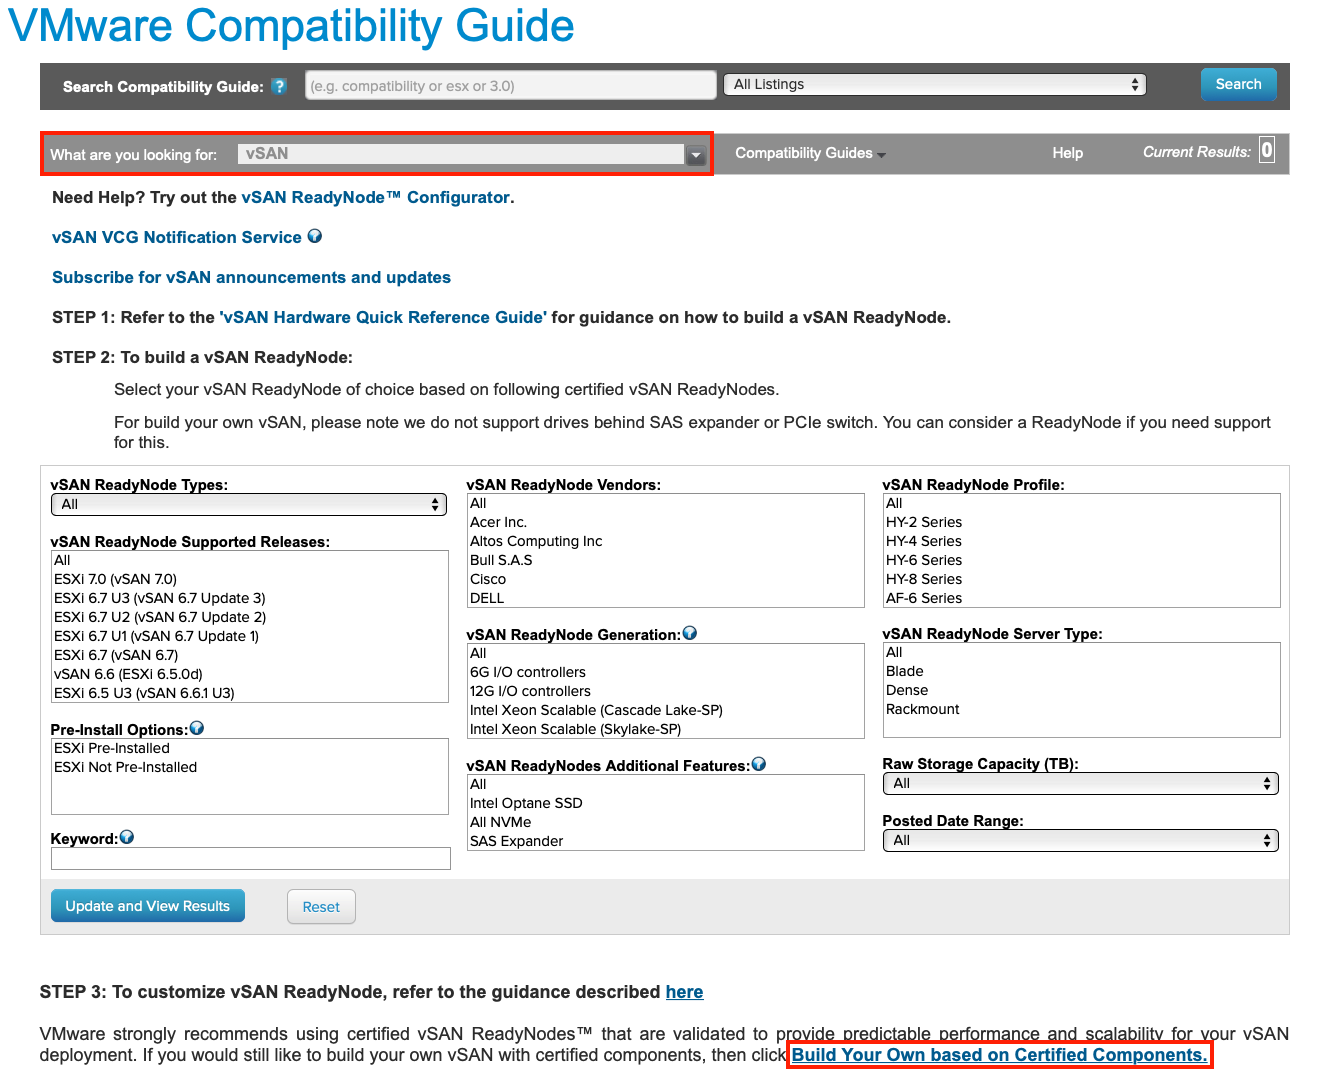
vSAN Storage I/O controllers & disks
Choose "vSAN" from "What are you looking for".
Scroll to 'STEP 3' and look for the link to "Build Your Own based on Certified Components":
https://www.vmware.com/resources/compatibility/search.php?deviceCategory=vsan
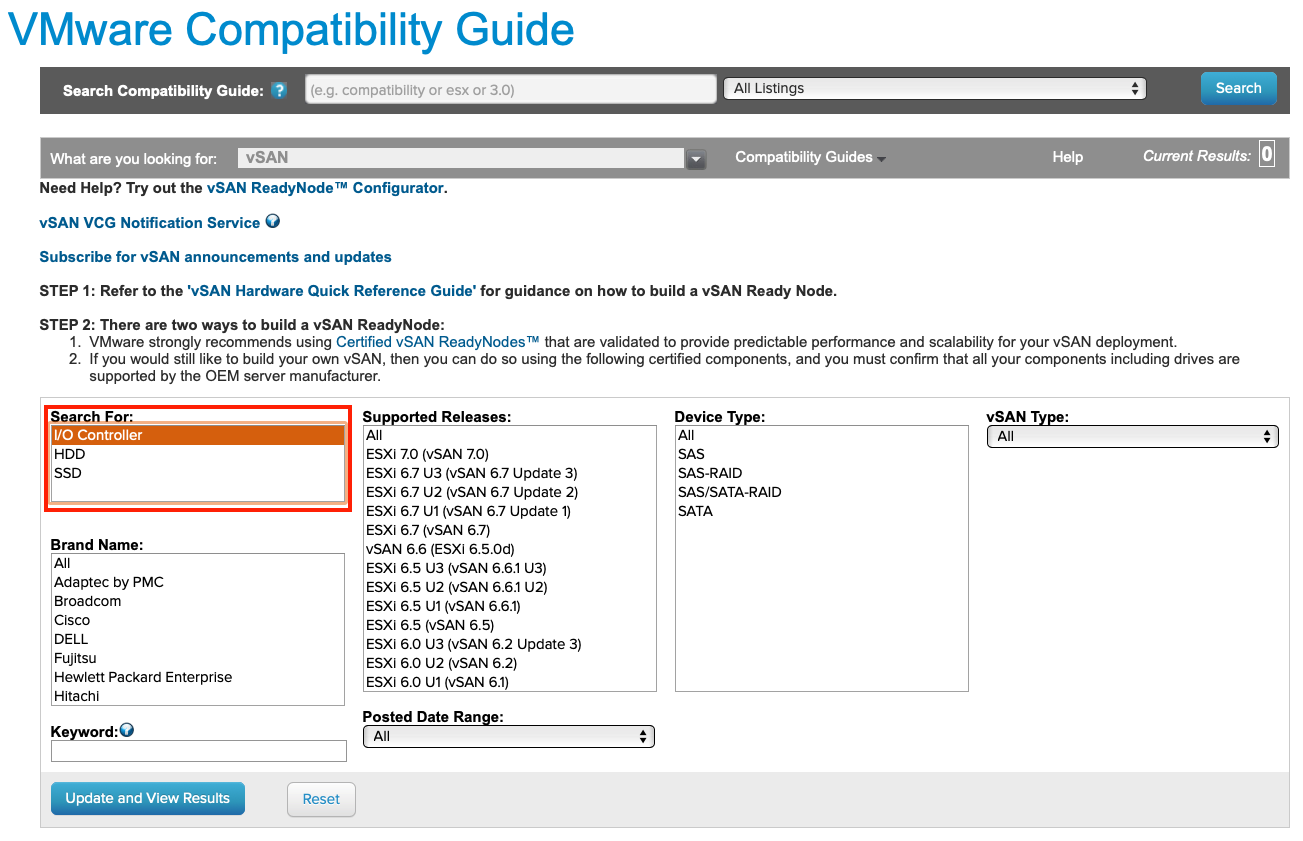
From the Build Your Own page, choose the appropriate device (i.e. I/O controller, SDD or HDD) to search for:
The following commands are useful to help identify firmware and drivers in ESXi for comparison with the VCG. First, log in to an ESXi host via SSH, then run the following commands to obtain the information from the server:
- To see the controller details:
esxcli vsan debug controller list
- To list VID DID SVID SSID of a storage controller or network adapter:
vmkchdev -l | egrep 'vmnic|vmhba'
- To show which NIC driver is loaded:
esxcli network nic list
- To show which storage controller driver is loaded:
esxcli storage core adapter list
- To display a driver version information:
vmkload_mod -s <driver-name> | grep -i version
- ForNVMe devices (replace X with the appropriate value):
esxcli nvme device get -A vmhbaX | egrep "Serial Number|Model Number|Firmware Revision"
All-Flash or Hybrid
There are several factors to consider if you plan to deploy an All-Flash vSAN solution:
- All-Flash vSAN requires a 10Gb Ethernet network for the vSAN traffic; it is not supported with 1Gb NICs
- Flash devices are used for both cache and capacity
- Deduplication and Compression are space-efficiency features available in all-flash configuration and not available with hybrid configuration
- Erasure Coding (RAID 5/ RAID 6) is a space efficiency feature available on all-flash configuration only
- Flash read cache reservation is not used with all-flash configurations; reads come directly from the capacity tier SSDs
- Endurance and performance classes now become important considerations for both cache and capacity layers
vSAN POC Setup Assumptions and Pre-Requisites
Prior to starting the proof of concept, the following pre-requisites must be completed. The following assumptions are being made with regards to the deployment:
- N+1 servers are available and compliant with the vSAN HCL
- All servers have had ESXi 7.0u3a (build number 18825058) or newer deployed
- vCenter Server 7.0u3a (build number 18778458) or newer has been deployed to manage these ESXi hosts (vCenter deployment procedures will not be covered in this POC guide)
- If possible, configure internet connectivity for vCenter such that the HCL database can be updated automatically. Internet connectivity is also a requirement to enable Customer Experience Improvement Program (CEIP), which is enabled by default to benefit customers with faster issue resolution by VMware support
- Services such as DHCP, DNS, and NTP are available in the environment where the POC is taking place
- All but one of the ESXi hosts should be placed in a new cluster container in vCenter (this host is set aside for cluster expansion testing)
- The cluster must not have any features enabled, such as DRS, HA or vSAN. These will be configured throughout the course of the POC
- Each host must have a management network VMkernel and a vMotion network VMkernel already configured. Initially, vSAN network VMkernel adapters are not configured. These will be configured later
- For the purposes of testing Storage vMotion operations, an additional datastore type, such as NFS or VMFS, should be presented to all hosts. (This is an optional POC exercise)
- A set of IP addresses, one per ESXi host will be needed for the vSAN network VMkernel ports. The recommendation is that these are all on the same VLAN and IPv4 or IPv6 network segment.
vSAN POC Overview
Hardware Selection
Choosing the appropriate hardware for a POC is one of the most important factors in the successful validation of vSAN. Below is a list of the more common options for vSAN POCs:
- Build Your Own: This method allows customers to repurpose a subset of their existing infrastructure hardware to evaluate vSAN. This method helps expedite the process and reduce the time taken in procuring the relevant hardware.
- Virtual POCs: Organizations solely interested in seeing vSAN functionality may be interested in the Virtual POC. This is a virtual environment and is not a true test of performance or hardware compatibility but can help stakeholders feel more comfortable using vSAN. Please contact your VMware HCI specialist to take advantage of our “Test Drive” environment.
- Hosted POCs: Many resellers, partners, distributors, and OEMs recognize the power of vSAN and have procured hardware to make it available to their customers in order to be able to conduct vSAN proof of concept tests.
- Try and Buy: Whether a VxRail or a vSAN ReadyNode, many partners will provide hardware for a vSAN POC as a “try and buy” option.
Choosing the appropriate hardware for a POC is vitally important. There are many variables with hardware (drivers, controller firmware versions) so be sure to choose hardware that is on the VMware Compatibility List.
Once the appropriate hardware is selected it is time to define the POC use case, goals, expected results and success metrics.
POC Validation Overview
The most important aspects to validate in a Proof of Concept are:
- Successful vSAN configuration and deployment
- VMs successfully deployed to vSAN Datastore
- Reliability: VMs and data remain available in the event of failure (host, disk, network, power)
- Serviceability: Maintenance of hosts, disk groups, disks, clusters
- Performance: vSAN and selected hardware can meet the application, as well as business needs
- Validation: vSAN features are working as expected (File Service, Deduplication and Compression, RAID-5/6, checksum, encryption)
- Day-2 Operations: Monitoring, management, troubleshooting, and upgrades
These can be grouped into three common vSAN POCs: resiliency testing, performance testing, and operational testing.

Operational Testing
Operational testing is a critical part of a vSAN POC. Understanding how the solution behaves on during normal (or “day two”) operations is important to consider as part of the evaluation. Fortunately, because vSAN is embedded within the ESXi hypervisor, many vSAN operations tasks are simply extensions of normal vSphere operations. Adding hosts, migrating VMs between nodes, and cluster creation are some of the many operations that are consistent between vSphere and vSAN.
- Some of the Operational Tests include:
- Adding hosts to a vSAN Cluster
- Adding disks to a vSAN node
- Create/Delete a Disk Group
- Clone/vMotion VMs
- Create/edit/delete storage policies
- Assign storage policies to individual objects (VMDK, VM Home)
- Monitoring vSAN
- Embedded vROps (vSAN 6.7 and above)
- Performance Dashboard on H5 client
- Monitor Resync components
- Monitor via vRealize Log Insight
- Put vSAN nodes in Maintenance Mode
- Evacuate Disks
- Evacuate Disk Groups
For more information about operational tests please visit the following sections on the vSAN POC Guide:
- Basic vSphere Functionality on vSAN
- Scaling vSAN
- Monitoring vSAN
- vSAN Storage Policies
- vSAN Management
Performance Testing
Performance testing often receives a lot of attention during vSAN POCs, so it's important to understand the performance requirements of the environment and pay close attention to details such as workload I/O profiles. Prior to conducting a performance test, first develop clear objectives, and understand whether a synthetic performance test is an appropriate benchmark. For a detailed description of recommended performing testing methods, please refer to the ‘Performance and Failure Testing’ section of this guide.
Resiliency Testing
vSAN is designed to protect data availability. By default, vSAN protects availability with 2 replicas of data, based on the vSAN default storage policy. As the number of nodes increases, you are presented with the option to further protect your data from multiple failures by increasing the number of data replicas. With a minimum of 7 nodes, you can have up to 4 data replicas, protecting against up to 3 failures at once, while still maintaining VM availability. For the sake of simplicity, we will keep the vSAN default storage policy in mind for any examples given in this guide (unless otherwise specified).
As with any other storage solution, failures can occur on different components at any time due to age, temperature, firmware, etc. Such failures can occur among storage controllers, disks, nodes, and network devices among other components. A failure on any of these components may manifest itself as a failure in vSAN if redundancies (e.g., multiple network paths) are not implemented.
When a failure occurs, vSAN components that comprise objects on the datastore will go into an “absent” or a “degraded” state. Depending on the component state, they will either rebuild immediately (if degraded), or wait the object repair timer to expire (if absent). By default, the repair delay value is set to 60 minutes. This timer exists because in situations where components are simply ‘absent’ (e.g. due to a host reboot), it may be more advantageous to wait for the absent components to return to the cluster, allowing vSAN to simply perform a ‘delta’ sync to catch-up these objects to present-state, rather than fully rebuilding a copy of these components elsewhere.
One common test is to physically remove a drive from a live vSAN node. In this scenario, vSAN sees the drive is missing, issues an alert about drive failure, but doesn’t know if the missing drive will return. In this scenario, objects on the drive are put in an absent state. vSAN notes the "absent" state and initiates a 60-minute repair timer countdown. If the drive does not come back within the time specified, vSAN will rebuild the objects to get back into policy compliance. If the drive was pulled by mistake, and is replaced within the 60 minutes, there is no rebuild, and after quick sync of data, the objects will be marked as healthy again.
In cases of a drive failure (permanent device loss, or PDL), the disk and its associated vSAN components are marked as degraded. vSAN will receive error codes from the hardware layer, mark the drive as degraded, and begin the repair of vSAN objects immediately.
Each type of object failure may be tested. and the associated object and component states observed during the POC. There is a Python script available within ESXi that allow injection of various error codes to generate both absent and degraded component states. This python script is called vsanDiskFaultInjection.pyc. You can see the usage of this script below.
Apart from disk failure testing, we also recommend including the following tests to better understand the resiliency features provided by vSAN:
- Simulate node failure with HA enabled
- Introduce network outage
- With and without network path redundancy
- Physical cable pull
- Network switch failure
- vCenter failure
vSAN Network Setup
How to configure vSAN Network Settings
|
Note: Optionally skip to 'Using Quickstart' in the next chapter to quickly configure a new cluster and enable vSAN |
Before vSAN can be enabled, all but one of the hosts must be added to the cluster and assigned management IP addresses; the final host is reserved for later testing of adding a host to the cluster. All ESXi hosts in a vSAN cluster communicate over a vSAN network. For network design and configuration best practices please refer to the VMware vSAN Design Guide on https://core.vmware.com/resource/vmware-vsan-design-guide#section1 .
The following example demonstrates how to configure vSAN networking services on an ESXi host.
Creating a VMkernel Port for vSAN
In many deployments, vSAN may be sharing the same uplinks as the vSphere management and vMotion traffic, especially when 10GbE NICs are utilized. When sharing vSAN traffic with other traffic types, VMware recommends using virtual distributed switches. Using a virtual distributed switch (vDS) provides Quality of Service (QoS) using a feature called Network I/O Control. Licensing for distributed virtual switches is included with all versions of vSAN.
The assumption for this POC is that there is already a standard vSwitch created and connected to the physical network uplinks that will be used for vSAN traffic. In this example, a separate vSwitch (vSwitch1) with two dedicated 10GbE NICs has been created for vSAN traffic, while the management and vMotion network use different uplinks on a separate standard vSwitch.
To create a vSAN VMkernel port, follow these steps:
Select an ESXi host in the inventory, then navigate to Configure > Networking > VMkernel Adapters. Click on the icon for Add Networking, as highlighted below:

Ensure that VMkernel Network Adapter is chosen as the connection type.

The next step gives you the opportunity to build a new standard vSwitch for the vSAN network traffic. In this example, an already existing vSwitch1 contains the uplinks for the vSAN traffic. If you do not have this already configured in your environment, you can use an already existing vSwitch, or select the option to create a new standard vSwitch.
If your hosts are limited to 2 x 10GbE uplinks, it often makes sense to use the same vSwitch for all traffic types.
As there is an existing vSwitch in our environment that contains the network uplinks for the vSAN traffic, the “BROWSE” button is used to select it as shown below.

Select an existing standard vSwitch via the "BROWSE" button:

Choose a vSwitch.

vSwitch1 is displayed once selected.
The next step is to set up the VMkernel port properties, and choose the services, such as vSAN traffic. This is what the initial port properties window looks like:

Here is what it looks like when enabling the vSAN service on the VMkernel port:

In the above example, the network label has been designated “vSAN Network”, and the vSAN traffic does not run over a VLAN. If there is a VLAN used for the vSAN traffic in your POC, change this from “None (0)” to an appropriate VLAN ID. Note that the usual practice is to dedicate a specific VLAN for vSAN usage.
The next step is to provide an IP address and subnet mask for the vSAN VMkernel interface. As per the assumptions and prerequisites section earlier, you should have these available before you start. At this point, add one per host by clicking on Use static IPv4 settings as shown below. Alternatively, if you plan on using DHCP IP addresses, leave the default setting which is Obtain IPv4 settings automatically.

The final window shows a summary of the VMkernel configuration. Here you can check that everything will be configured as expected. If anything is incorrect, you can navigate back through the wizard to make corrections. If everything looks correct, click on the FINISH button to apply the configuration change.

If the creation of the VMkernel port is successful, it will appear in the list of VMkernel adapters, as shown below.

This completes the vSAN networking setup for that host. This configuration process must be repeated for all other ESXi hosts that will participate in the vSAN cluster, including the host outside the cluster that will be added later.
2-Node Direct Connect
In cases where a 2-node vSAN cluster (with witness appliance) is deployed, a separately tagged VMkernel interface may be used for witness traffic transit instead of extending the vSAN network to the witness host. This feature allows for a more flexible network configuration by allowing for separate networks for node-to-node vs. node-to-witness communication. Note that this capability can only be enabled from the command line.
Witness Traffic Separation provides the ability to directly connect vSAN data nodes in a 2-node configuration; traffic destined for the Witness host can be tagged on an alternative physical interface separate from the directly connected network interfaces carrying vSAN traffic. Direct Connect eliminates the need for a 10Gb switch at remote offices/branch offices where the additional cost of the switch could be cost-prohibitive to the solution.
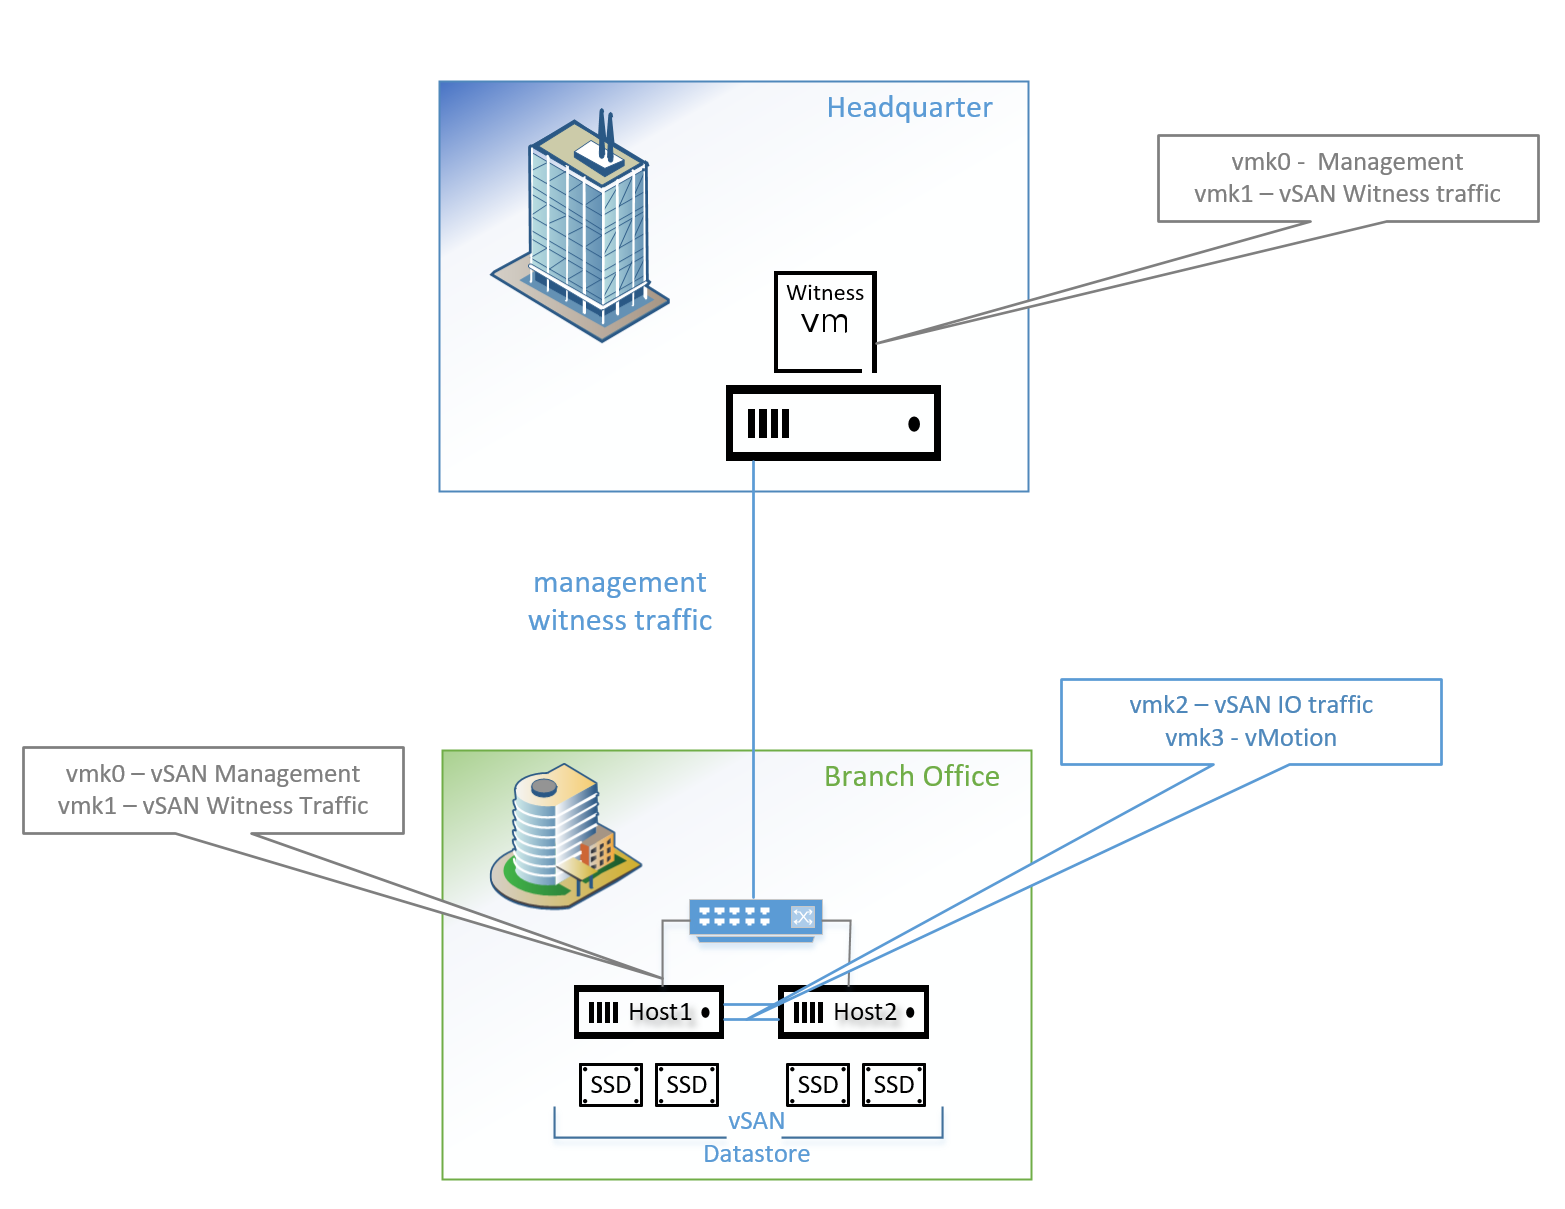
Enabling Witness Traffic Separation is not available from the vSphere Web Client. For the example illustrated above, to enable Witness Traffic on vmk1, execute the following on Host1 and Host2:
esxcli vsan network ip add -i vmk1 -T=witness
Any VMkernel port not used for vSAN traffic can be used for Witness traffic. In a more simplistic configuration, the Management VMkernel interface, vmk0, could be tagged for Witness traffic. The VMkernel port tagged for Witness traffic will be required to have IP connectivity to the vSAN traffic tagged interface on the vSAN Witness Appliance.
Simplified vSAN Witness setup
Minimum requirement for this particular setup is single vnic uplink and associate vmk0 with vSAN.
VMK1 static routes are no longer required and simplifies the setup requirements to one single vmk/vmnic and uses vmk0 default gateway to reach any endpoints in the network fabric.

Note: Ideal network setup uses routed L3 between vSAN Witness and ESXi branch office hosts.
Shared Witness 2node Robo and vSAN Stretch Cluster
vSAN 7.0u2 introduces vSAN witness for 2node setup and support for vSAN Stretch Cluster was extended in 7.0u3. Using different sizes of the vSAN Witness provides the functionality to share on a single VM multiple vSAN 2node / Stretch Clusters and reduces host resource requirements.
Graphical example

Note: vSAN Witness VM sizes recommendation for tiny/small/large/X-large (link)
Enabling vSAN
Steps to enable vSAN
Using Quickstart
The 'Quickstart' feature streamlines vSAN setup. Either follow this section to configure the cluster or use the next two sections to do so manually. Note that if you deployed vSAN using the bootstrap feature of vCenter deployment, you will not be able to use quickstart to configure your environment.
After creating a new cluster, you are presented with a dialog to edit settings. Provide a name for the cluster and select vSAN from the list of services:

The Quickstart screen is then displayed.

The next step is to add hosts. Clicking on the 'Add' button on the 'Add hosts' section presents the dialog below. Multiple hosts can be added at the same time (by IP or FDQN). Additionally, if the credentials of every host are the same, tick the checkbox above the list to quickly complete the form:

Once the host details have been entered, click next. You are then presented with a dialog showing the thumbprints of the hosts. If these are as expected, tick the checkbox(es) and then click next:

A summary will be displayed, showing the vSphere version on each host and other details. Verify the details are correct and click next:

Finally, review and click Finish if everything is in order:

After the hosts have been added, validation will be performed automatically on the cluster. Check for any errors and inconsistencies and re-validate if necessary:

The final step is to configure the cluster. After clicking on 'Configure' on step 3, the following dialog allows for the configuration of the distributed switch(es) for the cluster. Leave the default 'Number of distributed switches' set to 1 and assign a name to the switch:

Scroll down and configure the port groups and physical adapters as needed, then click next:

On the next screen, set the VLAN and IP addresses to be used, then click next:

Select the type of deployment: standard or stretched cluster. Enable any extra features, such as deduplication and compression. Check everything is correct and click next:

If possible, disks will be automatically selected as cache or capacity. Check the selection and click next:

Configure the fault domains, as required, then click next:

If stretched cluster was selected, the fault domain selection will look slightly different. Select the appropriate hosts for each fault domain and click next:

For stretched cluster, chose the witness host, then click next:

Select the disks for the witness host. Check and click next:

Finally, check everything is as expected and click finish:

Wait for the cluster and hosts to be configured correctly then proceed to the next chapter.
Enabling vSAN
Once all the pre-requisites have been met, vSAN can be configured. To enable vSAN complete the following steps:
- Open the vSphere HTML5 Client at https://<vcenter-ip>/ui.
- Click Menu > Hosts and Clusters.
- Select the cluster on which you wish to enable vSAN.
- Click the Configure tab.
- Under vSAN, Select Services and click the CONFIGURE button to start the configuration wizard.
- If desired, Stretched Cluster or 2-Node cluster options can be created as part of the workflow. As part of the basic configuration keep the default selection of Single site cluster and click NEXT.

- When using an All-Flash configuration, you have the option to enable deduplication and compression features. Deduplication and compression are covered in a later section of this guide.
- If encryption of data at rest is a requirement, here is where encryption can be enabled from the start. We will address encryption later in this POC guide.

Note: The process of later enabling deduplication and compression or encryption of data at rest can take quite some time, depending on the amount of data that needs to be migrated during the rolling reformat. In a production environment, if deduplication and compression is a known requirement, it is advisable to enable this while enabling vSAN to avoid multiple occurrences of rolling reformat.
- Click NEXT
- In the next screen, you can claim all the disks of the same type for either vSAN caching tier or capacity tier. For each listed disk make sure it is listed correctly as a Flash/HDD, and Caching/Capacity drive. Click NEXT
- If desired, created fault domains
- Verify the configuration and click FINISH


This completes the configuration process and can be validated by navigating to [Configure > vSAN > Services]
Enable HCI Mesh (If using multiple vSAN enabled clusters)
HCI Mesh (Datastore Sharing) is a new feature in vSAN 7U1, enabled with Enterprise edition or higher licensing. vSAN storage can now be shared between two clusters, utilizing vSAN’s native data path for cross-cluster connections.
Each client cluster can mount a maximum of 5 remote vSAN datastores, and a server cluster can export its datastore up to a maximum of 5 client clusters.
MTU size must be kept consistent across datastore connections.
All vSAN features are supported except for Data-in-Transit encryption, Cloud Native Storage (including vSAN Direct), Stretched Clusters, and 2-Node Clusters. Additionally, HCI Mesh will not support remote provisioning of File Services Shares, iSCSI volumes, or First-Class Disks (FCDs). File Services, FCDs, and the iSCSI service can be provisioned locally on clusters participating in a mesh topology but may not be provisioned on a remote vSAN datastore.
The same MTU sizing is required for both the Client and Server clusters.
New in vSAN 7.0U2 HCI Mesh now supports Compute Only Clusters. Compute only clusters would not require a vSAN license to consume a vSAN datastore on another cluster. Only the cluster providing the storage would need the vSAN license. HCI Mesh now supports up to 128 hosts connected with the previous maximum being 64.
To enable this feature:
- Click the cluster that you want to add the remote datastore.
- Click Configure > Datastore Sharing > Mount Remote Datastore.
- Select the remote datastore that you want to use, then Click Next
- On the Check Compatibility screen click Finish
- You should now see your new remote datastore available for use.


Check Your Network Thoroughly
Once the vSAN network has been created and vSAN is enabled, you should check that each ESXi host in the vSAN cluster is able to communicate to all other ESXi hosts in the cluster. The easiest way to achieve this is via the vSAN Health Check.
Why Is This Important?
vSAN is dependent on the network: its configuration, reliability, performance, etc. One of the most frequent causes of requesting support is either an incorrect network configuration or the network not performing as expected.
Use Health Check to Verify vSAN Functionality
Running individual commands from one host to all other hosts in the cluster can be tedious and time-consuming. Fortunately, since vSAN 6.0, vSAN has a health check system, part of which tests the network connectivity between all hosts in the cluster. One of the first tasks to do after setting up any vSAN cluster is to perform a vSAN Health Check. This will reduce the time to detect and resolve any networking issue, or any other vSAN issues in the cluster.
To run a vSAN Health Check, navigate to [vSAN cluster] > Monitor > vSAN > Health and click the RETEST button.
In the screenshot below, one can see that each of the health checks for networking has successfully passed.

If any of the network health checks fail, select the appropriate check and examine the details pane on the right for information on how to resolve the issue. Each detailed view under the Info tab also contains an AskVMware button where appropriate, which will take you to a VMware Knowledge Base article detailing the issue, and how to troubleshoot and resolve it.
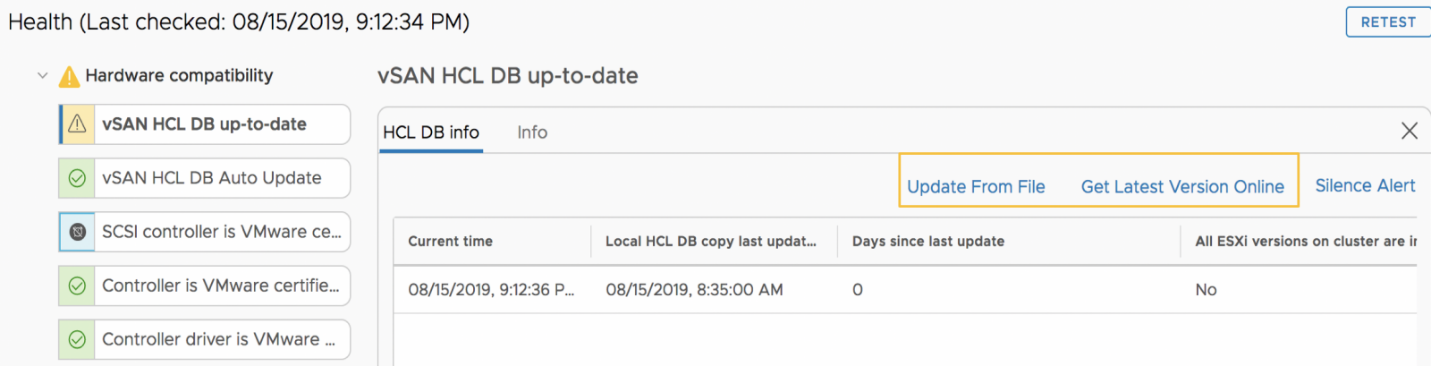
Before going any further with this POC, download the latest version of the HCL database and run a RETEST on the Health check screen. Do this by selecting vSAN HCL DB up-to-date health check under the "Hardware compatibility" category, and choosing GET LATEST VERSION ONLINE or UPDATE FROM FILE... if there is no internet connectivity.
The Performance Service is enabled by default. You can check its status from [vSAN cluster] > Configure > vSAN > Services. If it needs to be enabled, click the EDIT button next to Performance Service and turn it on using the defaults. The Performance Service provides vSAN performance metrics to vCenter and other tools like vRealize Operations Manager.

To ensure everything in the cluster is optimal, the Health service will also check the hardware against the VMware Compatibility Guide (VCG) for vSAN. Verify that the networking is functional, that there are no underlying disk problems or vSAN integrity issues. The desired goal is to have all the health checks succeed.
At this point, vSAN is successfully deployed. The remainder of this POC guide will involve various tests and error injections to show how vSAN will behave under these circumstances.
Enable vSAN RDMA
RoCEv2 support for vSAN was introduced in vSphere 7.0U2 and improves performance across hosts in the vSAN cluster.
RDMA RoCEv2 protocol is used instead of the default TCP/IP flow to leverage best possible, low latency between two physical endpoints.
NIC adapters can use both RDMA and TCP/IP at the same time which allows the NIC to do more work.
RDMA also reduces the 3-way handshake with TCP/IP protocol and lowers the network transport latency between two physical entities.
Requirements:
-
Network card support for RDMA RoCEv2
-
Switch support for RDMA RoCEv2
-
Switch configuration for PFC
-
No vSAN Stretch Cluster or 2node support
-
No LACP configured on network uplinks
-
Enable RDMA function for vSAN
Verify Network cards for RDMA support:

RDMA support and flag are required for the final setup to enable vSAN RDMA transport.
Note: If the RDMA flag is not visible, please verify NIC driver/firmware, vSphere HCL and hardware vendor specification. NIC driver automatically identifies RDMA capabilities on the physical switch and if not available, please contact your Switch vendor for assistance.
vSphere vSAN RDMA is using RoCEV2 as its protocol layer. When there is no RDMA support available on the physical link or setup, communication falls back to standard legacy TCP/IP automatically.
Setup Process:
- Switch setup
- ESXi host to verify RDMA functionality
- Enable vSAN RDMA
- Switch configuration example – setup:
Mellanox Switch SN2100:
- PFC (RDMA) support to be enabled
- PFC (RDMA) support across switch (ISLs) to be enabled
- PFC priority 3 or 4
Enable PFC on switch
switch01 [standalone: master] (config) # dcb priority-flow-control enable
This action might cause traffic loss while shutting down a port with priority-flow-control mode onType 'yes' to confirm enable pfc globally: yes
Enable Switch PFC for priority 4
dcb priority-flow-control priority 4 enable
Assign PFC to port (ESXi uplink) – example eth1/9:
switch01 [standalone: master] (config) # interface ethernet 1/9 dcb priority-flow-control mode on force
Verify RDMA available adapter through ESXi shell:
esxcli rdma device list
Name Driver State MTU Speed Paired Uplink Description
------- ---------- ------ ---- -------- ------------- -----------
vmrdma0 nmlx5_rdma Active 4096 100 Gbps vmnic4 MT27700 Family vmrdma1 nmlx5_rdma Active 4096 100 Gbps vmnic5 MT27700 Family
Looking at the vmrdmaX virtual RDMA adapter details provides detailed information on state, MTU size (see hardware specific documentation) and the linked adapter.
Note: To take advantage of RDMA you must have jumbo frames enabled on the physical switch. The RDMA adapter provides <= 4096 (maximum) MTU size.
Verify ESXi RDMA PFC status in esxcli – example vmnic4:
esxcli network nic dcb status get -n vmnic4
Nic Name: vmnic4
Mode: 3 - IEEE ModeEnabled: trueCapabilities:Priority Group: truePriority Flow Control: truePG Traffic Classes: 8PFC Traffic Classes: 8PFC Enabled: true
PFC Configuration: 0 0 0 0 1 1 0 0
In case an error was received during command execution, verify driver/firmware combination as per vSphere HCL (link).
esxcli network nic dcb status get --nic-name=vmnic5
DCB not supported for NIC vmnic5: Unable to complete Sysinfo operation. Please see the VMkernel log file for more details.: Not supported
Note: vSAN Health check invokes a similar process to query the device DCB status
Verify ESXi RDMA available protocols:
esxcli rdma device protocol list
Device RoCE v1 RoCE v2 iWARP
------- ------- ------- -----vmrdma0 true true falsevmrdma1 true true false
Verify vSAN health check in Virtual Center:
Example: PFC is set not to 3 or 4

Example: PFC is not enabled on Switch

Enable vSAN Network for RDMA


Verify with esxtop virtual RDMA adapter performance
- Login into ESXi via ssh
- Esxtop
- Press “r” (rdma view)
During load we can identify vmrdma0 performance:

- Press “n” (network view):
No vmk traffic during IO workload to verify

During our comparison, we can verify full function of the RDMA functions for vSAN during IO workload.
Verify functionality of RDMA and TCP/IP on the same physical vmnic
Setup:
- vSAN RDMA enabled
- Prepare DVS / vSwitch portgroup for VMs using RDMA enabled vmnicX
- Prepare two VMs with iperf/iperf3 package installed
- Both VMs require IP settings
- Place both VMs on different hosts
- Run one VM as iperf server with iperf3 -s
- Run the second VM as client with iperf3 -H a.b.c.d
- A.b.c.d – IP of the iperf3 server
- Cross-verify with esxtop difference between “n” network and “r” RDMA during iperf3 workload
In this setup we can verify, RDMA transport layer is not used for standard TCP/IP protocol and handled separately on the vmnic card layer.
RDMA troubleshooting:
- esxtop
Esxtop provides additional fields for enablement through the “f” key.
* A: NAME = Name of device
B: DRIVER = driver
C: STATE = State
* D: TEAM-PNIC = Team Uplink Physical NIC Name* E: PKTTX/s = Packets Tx/s* F: MbTX/s = Megabits Tx/s* G: PKTRX/s = Packets Rx/s* H: MbRX/s = Megabits Rx/sI: %PKTDTX = % Packets Dropped (Tx)
J: %PKTDRX = % Packets Dropped (Rx)* K: QP = Number of Queue Pairs Allocated
L: CQ = Number of Completion Queue Pairs Allocated
M: SRQ = Number of Shared Receive Queues Allocated
* N: MR = Memory Regions Allocated
Toggle fields with a-n, any other key to return:
Default setup enables only the minimum requirement for performance for MB/s, queue pairs (QP) and allocated memory regions verbs (MR). For in-depth RDMA functionality, please contact your hardware vendor.
-
esxcli rdma adapter statistic
Detailed adapter statistic shows in detail adapter health during the RDMA operation. Errors are not expected. Queue pairs are adjusted automatically by requirement.
esxcli rdma device stats get -d vmrdma0

Basic vSphere Functionality on vSAN
Deploy your first Virtual Machine
In this section, a VM is deployed to the vSAN datastore using the default storage policy. This default policy is preconfigured and does not require any intervention unless you wish to change the default settings, which we do not recommend.
To examine the default policy settings, navigate to Menu > Shortcuts > VM Storage Policies.

From there, select vSAN Default Storage Policy. Look under the Rules tab to see the settings on the policy:

We will return to VM Storage Policies in more detail later but suffice to say that when a VM is deployed with the default policy, it should have a mirror copy of the VM data created. This second copy of the VM data is placed on storage on a different host to enable the VM to tolerate any single failure. Also note that object space reservation is set to 'Thin provisioning', meaning that the object should be deployed as “thin”. After we have deployed the VM, we will verify that vSAN adheres to both of these capabilities.
One final item to check before we deploy the VM is the current free capacity on the vSAN datastore. This can be viewed from the [vSAN cluster] > Monitor > vSAN > Capacity view. In this example, it is 4.37 TB.

Make a note of the free capacity in your POC environment before continuing with the deploy VM exercise.
To deploy the VM, simply follow the steps provided in the wizard.
Select New Virtual Machine from the Actions Menu.
Select Create a new virtual machine.
At this point, a name for the VM must be provided, and then the vSAN Cluster must be selected as a compute resource.
Enter a Name for the VM and select a folder:

Select a compute resource:
Up to this point, the virtual machine deployment process is identical to all other virtual machine deployments that you have done on other storage types. It is the next section that might be new to you. This is where a policy for the virtual machine is chosen.
From the next menu, "4. Select storage", select the vSAN datastore, and the Datastore Default policy will actually point to the vSAN Default Storage Policy.
Once the policy has been chosen, datastores are split into those that are either compliant or non-compliant with the selected policy. As seen below, only the vSAN datastore can utilize the policy settings in the vSAN Default Storage Policy, so it is the only one that shows up as Compatible in the list of datastores.

The rest of the VM deployment steps in the wizard are quite straightforward, and simply entail selecting ESXi version compatibility (leave at default), a guest OS (leave at default) and customize hardware (no changes). Essentially you can click through the remaining wizard screens without making any changes.
Verifying Disk Layout of a VM stored in vSAN
Once the VM is created, select the new VM in the inventory, navigate to the Configure tab, and then select Policies. There should be two objects shown, "VM home" and "Hard disk 1". Both should show a compliance status of Compliant meaning that vSAN was able to deploy these objects in accordance with the policy settings.

To verify this, navigate to the Cluster's Monitor tab, and then select Virtual Objects. Once again, both the “VM home” and “Hard disk 1” should be displayed. Select “Hard disk 1” followed by View Placement Details. This should display a physical placement of RAID 1 configuration with two components, each component representing a mirrored copy of the virtual disk. It should also be noted that different components are located on different hosts. This implies that the policy setting to tolerate 1 failure is being adhered to.


The witness item shown above is used to maintain a quorum on a per-object basis. For more information on the purpose of witnesses, and objects and components in general, refer to the VMware vSAN Design Guide on core.vmware.com
The “object space reservation” policy setting defines how much space is initially reserved on the vSAN datastore for a VM's objects. By default, it is set to "Thin provisioning", implying that the VM’s storage objects are entirely “thin” and consume no unnecessary space. Note the free capacity in the vSAN datastore after deploying the VM, we see that the free capacity is very close to what it was before the VM was deployed, as displayed:

Because we have not installed anything in the VM (such as a guest OS) - it shows that only a tiny portion of the vSAN datastore has so far been used, verifying that the object space reservation setting of "Thin provisioning" is working correctly (observe that the "Virtual disks" and "VM home objects" consume less than 1GB in total, as highlighted in the "Used Capacity Breakdown" section).
Do not delete this VM as we will use it for other POC tests going forward.
Creating a Snapshot
Using the virtual machine created previously, take a snapshot of it. The snapshot can be taken when the VM is powered on or powered off. The objectives are to see that:
- no setup is needed to make vSAN handle snapshots
- the process for creating a VM snapshot is unchanged with vSAN
- a successful snapshot delta object is created
- the policy settings of the delta object are inherited directly from the base disk object
From the VM object in vCenter, click Actions > Snapshots > Take Snapshot...

Take a Snapshot of the virtual machine created in the earlier step.
Provide a name for the snapshot and optional description.
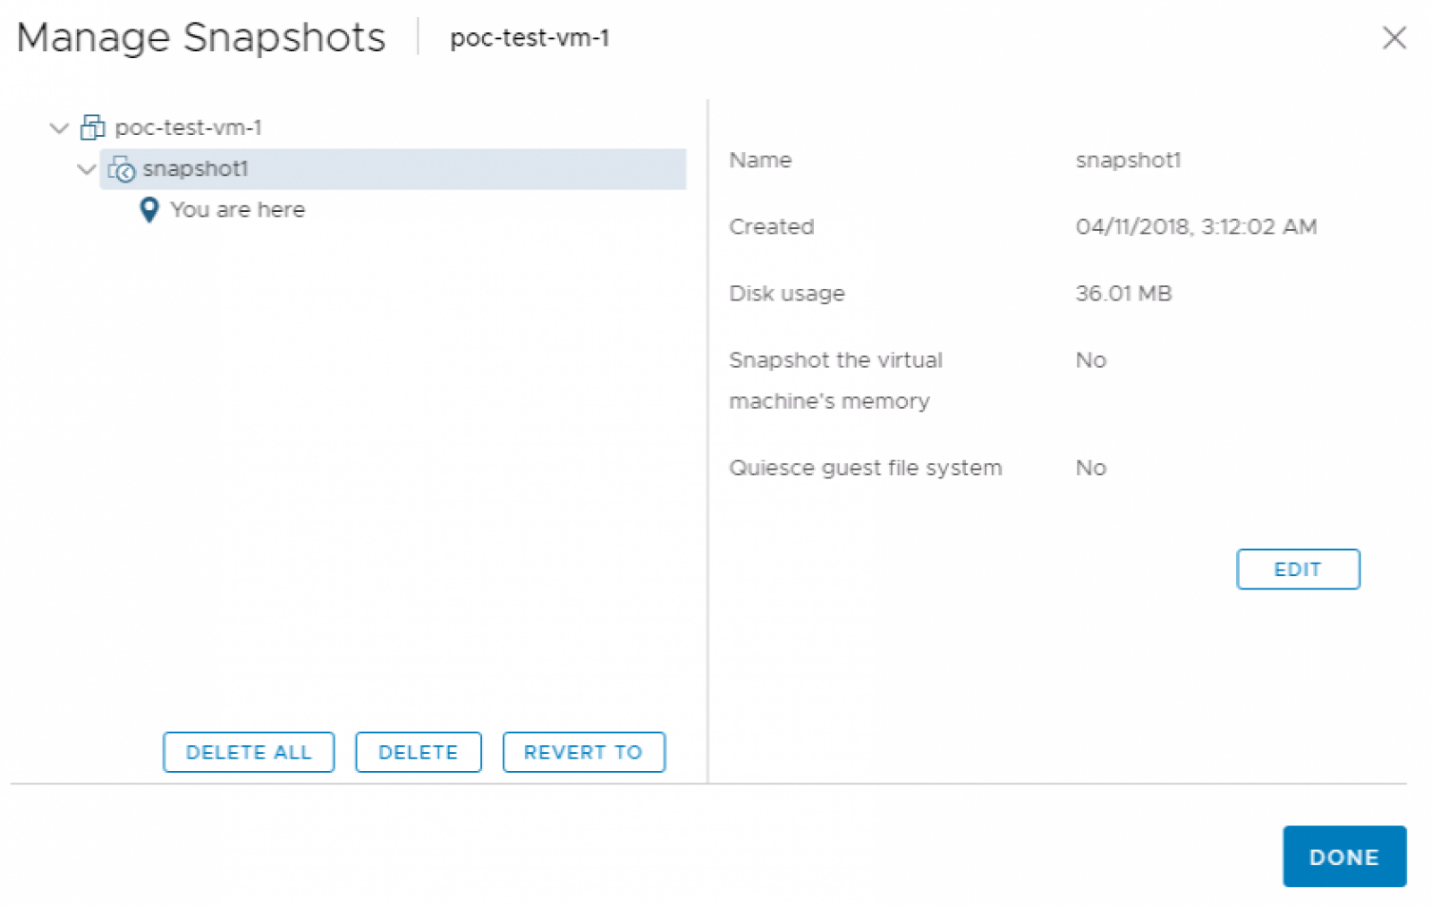
Once the snapshot has been requested, monitor tasks and events to ensure that it has been successfully captured. Once the snapshot creation has completed, additional actions will become available in the snapshot drop-down window. For example, there is a new action to Revert to Latest Snapshot and another action to Manage Snapshots.

Choose the Manage Snapshots option. The following is displayed. It includes details regarding all snapshots in the chain, the ability to delete one or all of them, as well as the ability to revert to a particular snapshot.
To see snapshot delta object information from the UI, navigate to [vSAN Cluster] > Monitor > vSAN > Virtual Objects.

There are now three objects that are associated with that virtual machine. First is the "VM Home" namespace. "Hard disk 1" is the base virtual disk, and "Hard disk 1 - poc-test-vm1.vmdk" is the snapshot delta. Notice the snapshot delta inherits its policy settings from the base disk that needs to adhere to the vSAN Default Storage Policy.
The snapshot can now be deleted from the VM. Monitor the VM’s tasks and ensure that it deletes successfully. When complete, snapshot management should look like this.

This completes the snapshot section of this POC. Snapshots in a vSAN datastore are very intuitive because they utilize vSphere native snapshot capabilities.
Clone a Virtual Machine
The next POC test is cloning a VM. We will continue to use the same VM as before. This time make sure the VM is powered on first. There are several different cloning operations available with vSAN 7. These are shown here.
The one that we will be running as part of this POC is the “Clone to Virtual Machine”. The cloning operation is a straightforward click-through operation. This next screen is the only one that requires human interaction. Simply provide the name for the newly cloned VM, and a folder if desired.


We are going to clone the VM in the vSAN cluster, so this must be selected as the compute resource.

On the “Select Storage” screen select the source datastore for the VM, “vsanDatastore”. This will all be pre-selected for you if the VM being cloned also resides on the vsanDatastore.

Select from the available options (leave unchecked - default)
This will take you to the “Ready to complete” screen. If everything is as expected, click FINISH to commence the clone operation. Monitor the VM tasks for the status of the clone operation.

Do not delete the newly cloned VM, we will be using it in subsequent POC tests.
This completes the cloning section of this POC.
vMotion a Virtual Machine Between Hosts
The first step is to power-on the newly cloned virtual machine. We will migrate this VM from one vSAN host to another vSAN host using vMotion.
Note: Take a moment to revisit the network configuration and ensure that the vMotion network is distinct from the vSAN network. If these features share the same network, performance will not be optimal.
First, determine which ESXi host the VM currently resides on. Selecting the Summary tab of the VM shows this. In this POC task, the VM that we wish to migrate is on host poc2.vsanpe.vmware.com.

Right-click on the VM and select Migrate.

"Migrate" allows you to migrate to a different compute resource (host), a different datastore or both at the same time. In this initial test, we are simply migrating the VM to another host in the cluster, so this initial screen should be left at the default of “Change compute resource only”.
Select Change compute resource only

Select a destination host and click Next.
Select a destination network and click Next.

The vMotion priority can be left as high(default), click Next.
At the “Ready to complete” window, click on FINISH to initiate the migration. If the migration is successful, the summary tab of the virtual machine should show that the VM now resides on a different host.

Verify that the VM has been migrated to a new host.

Do not delete the migrated VM. We will be using it in subsequent POC tests.
This completes the “VM migration using vMotion” section of this POC. As you can see, vMotion works just great with vSAN.
Storage vMotion a VM Between Datastores
This test will only be possible if you have another datastore type available to your hosts, such as NFS/VMFS. If so, then the objective of this test is to successfully migrate a VM from another datastore type into vSAN and vice versa. The VMFS datastore can even be a local VMFS disk on the host.
Mount an NFS Datastore to the Hosts
The steps to mount an NFS datastore to multiple ESXi hosts are described in the vSphere 7 Administrators Guide. See the Create NFS Datastore in the vSphere Client topic for detailed steps.
Storage vMotion a VM from vSAN to another Datastore Type
Currently, the VM resides on the vSAN datastore. As we did before, launch the migrate wizard, however, on this occasion move the VM from the vSAN datastore to another datastore type by selecting Change storage only.

In this POC environment, we have an NFS datastore presented to each of the ESXi hosts in the vSAN cluster. This is the intended destination datastore for the virtual machine.
Select destination storage of NFS-DS.
One other item of interest in this step is that the VM Storage Policy should also be changed to Datastore Default as the NFS datastore will not understand the vSAN policy settings.

At the “Ready to complete” screen, click FINISH to initiate the migration:

Once the migration completes, the VM Summary tab can be used to examine the datastore on which the VM resides.

Verify that the VM has been moved to the new storage.
Scale Out vSAN
Scaling out vSAN by adding a host into the cluster
One nice feature is the simplistic scale-out nature of vSAN. If you need more compute or storage resources in the cluster, simply add another host to the cluster.
Before initiating the task, revisit the current state of the cluster. There are currently three hosts in the cluster, and there is a fourth host not in the cluster. We also created two VMs in the previous exercises.

Let us also remind ourselves of how big the vSAN datastore is.

In the current state, the size of the vSAN datastore is 3.52TB with a free capacity of 3.47TB free.
Add the Fourth Host to vSAN Cluster
We will now proceed with adding a fourth host to the vSAN Cluster.
Note: Back in section 2 of this POC guide, you should have already set up a vSAN network for this host. If you have not done that, revisit section 2, and set up the vSAN network on this fourth host.
Having verified that the networking is configured correctly on the fourth host, select the new host in the inventory, right-click on it and select the option Move To… as shown below.

You will then be prompted to select the location to which the host will be moved. In this POC environment, there is only one vSAN cluster. Select that cluster.
Select a cluster as the destination for the host to move into.
The next screen is related to resource pools. You can leave this at the default, which is to use the cluster’s root resource pool, then click OK.

This moves the host into the cluster. Next, navigate to the Hosts and Clusters view and verify that the cluster now contains the new node.

As you can see, there are now 4 hosts in the cluster. However, you will also notice from the Capacity view that the vSAN datastore has not changed with regards to total and free capacity. This is because vSAN does not claim any of the new disks automatically. You will need to create a disk group for the new host and claim disks manually. At this point, it would be good practice to re-run the health check tests. If there are any issues with the fourth host joining the cluster, use the vSAN Health Check to see where the issue lies. Verify that the host appears in the same network partition group as the other hosts in the cluster.
Creating a Disk Group on a New Host
Navigate to [vSAN Cluster] > Configure > vSAN > Disk Management, select the new host and then click on the highlighted icon to claim unused disks for a new disk group:

As before, we select a flash device as a cache disk and three flash devices as capacity disks. This is so that all hosts in the cluster maintain a uniform configuration.

Select flash and capacity devices.
Verify vSAN Disk Group Configuration on New Host
Once the disk group has been created, the disk management view should be revisited to ensure that it is healthy.

Verify New vSAN Datastore Capacity
The final step is to ensure that the vSAN datastore has now grown in accordance with the capacity devices in the disk group that was just added on the fourth host. Return to the Capacity view and examine the total and free capacity fields.

As we can clearly see, the vSAN datastore has now grown in size to 4.69 TB. Free space is shown as 4.62 TB as the amount of space used is minimal. The original datastore capacity with three hosts (in the example POC environment) was 3.52TB.
This completes the “Scale-Out” section of this POC. As seen, scale-out on vSAN is simple but very powerful.
Monitoring vSAN
When it comes to monitoring vSAN, there are several areas that need particular attention.
These are the key considerations when it comes to monitoring vSAN:
- Overall vSAN Health
- vSAN Capacity
- Resynchronization & rebalance operations in the vSAN cluster
- Performance Monitoring through vCenter UI and command-line utility(vsantop)
- Advanced monitoring through integrated vROPS dashboards
Overall vSAN Health
The first item to monitor is the overall health of the cluster. vSAN Skyline Health provides a consolidated list of health checks that correlate to the resiliency and performance of a vSAN cluster. From the vCenter, navigate to the cluster object, then go to [vSAN Cluster] > Monitor > vSAN > Skyline Health. This provides a holistic view of the health states pertaining to hardware and software components that constitute a vSAN cluster. There is an exhaustive validation of components states, configuration, and compatibility.
SCSI Device Controller: (7.0u3 and prio)

NVMe Device Controller: (7.0u3+)

More information about this is available here - Working with vSAN Health checks.
vSAN Capacity
vSAN storage capacity usage may be examined by navigating to [vSAN Cluster] > Monitor > vSAN > Capacity. This view provides a summary of current vSAN capacity usage, and also displays historical capacity usage information when Capacity History is selected. From the default view, a breakdown of capacity usage per object type is presented. In addition, a capacity analysis tool that facilitates effective free space remaining with respect to individual is available.

Note that beginning with vSAN 7.0, the vSAN UI now distinguishes vSphere replication objects within the capacity view.
Prior to vSAN 7u1, VMware recommended reserving 25-30% of total capacity for use as “slack space”. This space is utilized during operations that temporarily consume additional storage space, such as host rebuilds, maintenance mode, or when VMs change storage policies. Beginning with vSAN 7u1, this concept has been replaced with “capacity reservation”.
An improved methodology for calculating the amount of capacity set aside for vSAN operations yields significant gains in capacity savings (up to 18% in some cases). Additionally, the vSAN UI makes it simple to understand what amount of capacity is being reserved for vSAN’s temporary operations associated with normal usage, versus for host rebuilds (one host of capacity reserved for maintenance and host failure events).
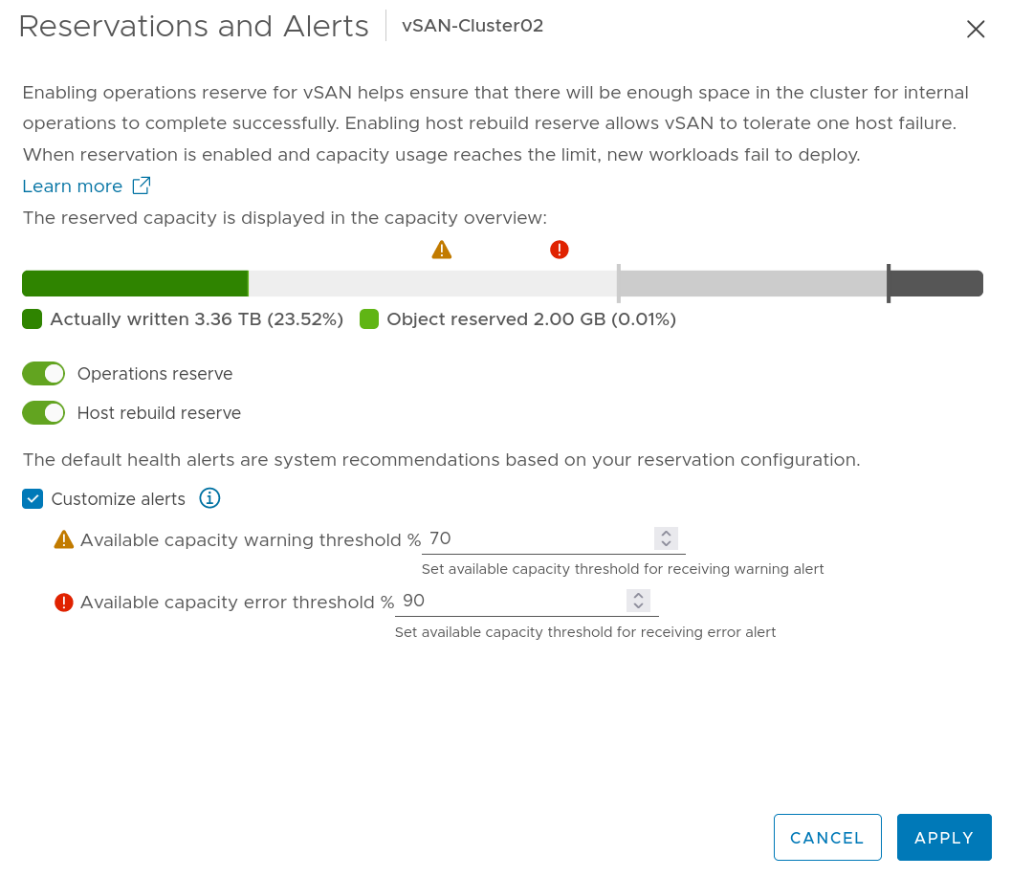
This feature should be enabled during normal vSAN operations. To enable this new feature:
Click Reservations and Alerts.
Tick the Operations Reserve and the Host Rebuild Reserve options.

Note that when Operations Reserve and Host Rebuild Reserve are enabled, “soft” thresholds are implemented that will attempt to prevent over-consumption of vSAN datastore capacity. In addition to triggering warnings/alerts in vSphere when capacity utilization is in danger of consuming space set aside as reserved, once the capacity threshold is met, operations such as provisioning new VMs, virtual disks, FCDs, clones, iSCSI targets, snapshots, file shares, or other new objects consuming vSAN datastore capacity will not be allowed.
Note, I/O activity for existing VMs and objects will continue even if the threshold is exceeded, ensuring that current workloads remain available and functioning as expected.
As VMs will continue to be able to write to provisioned space, it is important that administrators monitor for capacity threshold alerts, and take action to free up (or add) capacity to the vSAN cluster before capacity consumption significantly exceeds the set thresholds.
vSAN 7.0u2 introduces additional monitoring capabilities for oversubscription on the vSAN datastore. Within the vCenter UI, an estimate of the capacity required if thin-provisioned objects were fully provisioned has been added to the monitoring summary at vSAN Datastore > Monitor > vSAN > Capacity:

This update also introduced a more user-friendly method to customize thresholds for triggering capacity warnings and errors in vSAN Health. To view this information and modify alerts, navigate to vSAN Datastore > Monitor > vSAN > Capacity, and click [Reservations and Alerts] on the bottom-right of the ‘Capacity Overview’ summary.
Resync Operations
Another very useful view is [vSAN Cluster] > Monitor > vSAN > Resyncing Objects view. This will display any resyncing or rebalancing operation that might be taking place on the cluster. For example, if there was a device failure, resyncing or rebuilding activity could be observed here. Resync can also happen if a device was removed or a host failed, and the CLOMd (Cluster Logical Object Manager daemon) timer expired. Resyncing objects dashboard provides details of the resync status, amount of data in transit, and estimated time to completion.
With regards to rebalancing, vSAN attempts to keep all physical disks at less than 80% capacity. If any physical disks’ capacity passes this threshold, vSAN will move components from this disk to other disks in the cluster in order to rebalance the physical storage.
In an ideal state, no resync activity should be observed, as shown below.

Resyncing activity usually indicates:
- a failure of a device or host in the cluster
- a device has been removed from the cluster
- a physical disk has greater than 80% of its capacity consumed
- a policy change has been implemented which necessitates a rebuilding of a VM’s object layout. In this case, a new object layout is created, synchronized with the source object, and then discards the source object
vSAN 7.0 also introduces visibility of vSphere replication object types within the Virtual Objects view, allowing administrators to clearly distinguish replica data from other data types.

Performance Monitoring through vCenter UI
Performance monitoring service can be used for verification of performance as well as quick troubleshooting of performance-related issues. Performance charts are available for many different levels.
- Cluster
- Hosts
- Virtual Machines and Virtual Disks
- Disk groups
- Physical disks
A detailed list of performance graphs and descriptions can be found here.
The performance monitoring service is enabled by default. If in case it is disabled, it can be re-enabled through the following steps:
Navigate to the vSAN Cluster.
- Click the Configure tab.
- Select Services from the vSAN Section
- Navigate to Performance Service, Click EDIT to edit the performance settings.

Once the service has been enabled performance statistics can be viewed from the performance menus in vCenter. The following example is meant to provide an overview of using the performance service. For purposes of this exercise, we will examine IOPS, throughput, and latency from the Virtual Machine level and the vSAN Backend level.
The cluster level shows performance shows metrics from a cluster level. This includes all virtual machinesTo access cluster-level performance graphs:
- From the Cluster level in vCenter, Click on the Monitor tab.
- Navigate to the vSAN section and click on Performance

For this portion of the example, we will step down a level and the performance statistics for the vSAN Backend. To access the vSAN - Backend performance metrics select the BACKEND tab from the menu on the left.

File Service is a new feature included with vSAN 7, this helps unify block and file storage. When enabled, you can monitor the performance of the File Shares in the FILE SHARE tab. More information on vSAN File Services can be found here.

The performance service allows administrators to view not only real-time data but historical data as well. By default, the performance service looks at the last hour of data. This time window can be increased or changed by specifying a custom range.
vSAN 7U1 brings with it some new features around performance monitoring. First, it is easier to compare VM performance. From the cluster level, click Monitor and then Performance. Now we can look at the cluster level or show specific VMs (Up to 10 at a time). 
This makes it easy to compare IOPS, Throughput, and Latency for multiple VMs. 
The next major improvement to performance monitoring is the inclusion of IOInsight. Click IOInsight and then New Instance. You can select entire hosts or specific VMs to monitor. IOInsight can monitor from 1 minute to 24 hours. The system will limit IOInsight monitoring overhead to 1% CPU and Memory and when running high IOPS of 200K/host you might see 2-3% drop in IOPS. 
The capture shows you detailed information coming from each VM. Key metrics include IOPS, Throughput, Latency, Random/Sequential, Alignment, Read/Write %, and IO Size (Block Size) Distribution. 
Network Monitoring
vSAN is reliant upon upstream networking resources to transmit data between cluster nodes, making network health and performance a critical aspect that influences vSAN performance and reliability.
vSAN 7.0u2 introduces new network monitoring capabilities that are useful in isolating potential network issues at the TCP/IP and physical layers that may adversely impact vSAN performance.
Newly introduced metrics, visible in the vCenter UI at [ESXi Host] > Monitor > vSAN > Performance > Physical Adapters, include:
|
Metric |
Default Alert Threshold |
|
|
|
Yellow (Warning) |
Red (Error) |
|
pNIC Flow Control (AKA RX/TX Pauses) |
>1% |
>10% |
|
pNIC CRC Error |
>0.1% |
>1% |
|
pNIC TX Carrier Error |
>0.1% |
>1% |
|
pNIC RX Generic Error |
>0.1% |
>1% |
|
pNIC TX Generic Error |
>0.1% |
>1% |
|
pNIC RX Missed Error |
>0.1% |
>1% |
|
pNIC Buffer Overflow Error |
>0.1% |
>1% |
|
pNIC RX FIFO Error |
>0.1% |
>1% |

Additional useful metrics regarding were introduced with vSAN 7.0u1 or earlier, visible in the vCenter UI at [ESXi Host] > Monitor > vSAN > Performance > Host Network:

Monitoring vSAN through integrated vRealize Operations Manager in vCenter
Monitoring vSAN has become simpler and accessible from the vCenter UI. This is made possible through the integration of vRealize Operations Manager plugin in vCenter.
The feature is enabled through the HTML5 based vSphere client and allows an administrator to either install a new instance or integrate with an existing vRealize Operations Manager.
You can initiate the workflow by navigating to Menu > vRealize Operations as shown below:

Once the integration is complete, you can access the predefined dashboards as shown below:

The following out-of-the-box dashboards are available for monitoring purposes,
- vCenter - Overview
- vCenter - Cluster View
- vCenter - Alerts
- vSAN- Overview
- vSAN - Cluster View
- vSAN - Alerts
From a vSAN standpoint, the Overview, Cluster View, and Alerts dashboards allow an administrator to have a snapshot of the vSAN cluster. Specific performance metrics such as IOPS, Throughput, Latency, and Capacity related information are available as depicted below,

VM Storage Policies and vSAN
VM Storage Policies form the basis of VMware’s Software-Defined Storage vision. Rather than deploying VMs directly to a datastore, a VM Storage Policy is chosen during initial deployment. The policy contains the characteristics and capabilities of the storage required by the virtual machine. Based on the policy contents, the correct underlying storage is chosen for the VM.
If the underlying storage meets the VM storage Policy requirements, the VM is said to be in a compliant state.
If the underlying storage fails to meet the VM storage Policy requirements, the VM is said to be in a non-compliant state.
In this section of the POC Guide, we shall look at various aspects of VM Storage Policies. The virtual machines that have been deployed thus far have used the vSAN Default Storage Policy, which has the following settings:
|
Storage Type |
vSAN |
|
Site disaster tolerance |
None(standard cluster) |
|
Failures to tolerate |
1 failure - RAID-1 (Mirroring) |
|
Number of disk stripes per object |
1 |
|
IOPS limit for object |
0 |
|
Object space reservation |
Thin provisioning |
|
Flash read cache reservation |
0% |
|
Disable object checksum |
No |
|
Force provisioning |
No |
In this section of the POC, we will walk through the process of creating additional storage policies.
Create a New VM Storage Policy
In this part of the POC, we will build a policy that creates a stripe width of two for each storage object deployed with this policy. The VM Storage Policies can be accessed from the 'Shortcuts' page on the vSphere client (HTML 5) as shown below.

There will be some existing policies already in place, such as the vSAN Default Storage Policy (which we’ve already used to deploy VMs in section 4 of this POC guide).
To create a new policy, click on Create VM Storage Policy.

The next step is to provide a name and an optional description for the new VM Storage Policy. Since this policy will contain a stripe width of 2, we have given it a name to reflect this. You may also give it a name to reflect that it is a vSAN policy.
The next section sets the policy structure. We select Enable rules for "vSAN" Storage to set a vSAN specific policy
Now we get to the point where we create a set of rules. The first step is to select the Availability of the objects associated with this rule, i.e. the failures to tolerate.
We then set the Advanced Policy Rules. Once this is selected, the six customizable capabilities associated with vSAN are exposed. Since this VM Storage Policy is going to have a requirement where the stripe width of an object is set to two, this is what we select from the list of rules. It is officially called “Number of disk stripes per object”.

Clicking NEXT moves on to the Storage Compatibility screen. Note that this displays which storage “understands” the policy settings. In this case, the vsanDatastore is the only datastore that is compatible with the policy settings.
Note: This does not mean that the vSAN datastore can successfully deploy a VM with this policy; it simply means that the vSAN datastore understands the rules or requirements in the policy.

At this point, you can click on NEXT to review the settings. On clicking FINISH, the policy is created.

Let’s now go ahead and deploy a VM with this new policy, and let’s see what effect it has on the layout of the underlying storage objects.
Note: vSAN 7 includes a pre-defined storage policy for File Service called "FSVM_Profile_DO_NOT_MODIFY", this is intended for File Service specific entities and should not be modified.
Deploy a new VM with a new Storage Policy
The workflow to deploy a New VM remains the same until we get to the point where the VM Storage Policy is chosen. This time, instead of selecting the default policy, select the newly created StripeWidth=2 policy as shown below.

As before, the vsanDatastore should show up as the compatible datastore, and thus the one to which this VM should be provisioned.

Now let's examine the layout of this virtual machine, and see if the policy requirements are met; i.e. do the storage objects of this VM have a stripewidth of 2? First, ensure that the VM is compliant with the policy by navigating to [VM] > Configure > Policies, as shown here.

The next step is to select the [vSAN Cluster] > Monitor > vSAN > Virtual Objects and check the layout of the VM’s storage objects. The first object to check is the "VM Home" namespace. Select it, and then click on the View Placement Details icon.

This continues to show that there is only one mirrored component, but no stripe width (which is displayed as a RAID 0 configuration). Why? The reason for this is that the "VM home" namespace object does not benefit from striping, so it ignores this policy setting. Therefore, this behavior is normal and to be expected.

Now let’s examine “Hard disk 1” and see if that layout is adhering to the policy. Here we can clearly see a difference. Each replica or mirror copy of the data now contains two components in a RAID 0 configuration. This implies that the hard disk storage objects are indeed adhering to the stripe width requirement that was placed in the VM Storage Policy.

Note that each striped component must be placed on its own physical disk. There are enough physical disks to meet this requirement in this POC. However, a request for a larger stripe width would not be possible in this configuration. Keep this in mind if you plan a POC with a large stripe width value in the policy.
It should also be noted that snapshots taken of this base disk continue to inherit the policy of the base disk, implying that the snapshot delta objects will also be striped.
Edit VM Storage Policy of an existing VM
You can choose to modify the VM Storage Policy of an existing VM deployed on the vSAN datastore. The configuration of the objects associated with the VM will be modified to comply with the newer policy. For example, if NumberOfFailuresToTolerate is increased, newer components would be created, synchronized with the existing object, and subsequently, the original object is discarded. VM Storage policies can also be applied to individual objects.
In this case, we will add the new StripeWidth=2 policy to one of the VMs which still only has the default policy (NumberOfFailuresToTolerate=1, NumberOfDiskStripesPerObject=1, ObjectSpaceReservation=0) associated with it.
To begin, select the VM that is going to have its policy changed from the vCenter inventory, then select the Configure > Policies view. This VM should currently be compliant with the vSAN Default Storage Policy. Now click on the EDIT VM STORAGE POLICIES button as highlighted below.

This takes you to the edit screen, where the policy can be changed.

Select the new VM Storage Policy from the drop-down list. The policy that we wish to add to this VM is the StripeWidth=2 policy.
Once the policy is selected, click the OK button as shown above to ensure the policy gets applied to all storage objects. The VM Storage Policy should now appear updated for all objects.
Now when you revisit the Configure > Policies view, you should see the changes in the process of taking effect (Reconfiguring) or completed, as shown below.

This is useful when you only need to modify the policy of one or two VMs, but what if you need to change the VM Storage Policy of a significant number of VMs.
That can be achieved by simply changing the policy used by those VMs. All VMs using those VMs can then be “brought to compliance” by reconfiguring their storage object layout to make them compliant with the policy. We shall look at this next.
Note: Modifying or applying a new VM Storage Policy leads to additional backend IO as the objects are being synchronized.
Modify a VM Storage Policy
In this task, we shall modify an existing VM Storage policy to include an ObjectSpaceReservation=25%. This means that each storage object will now reserve 25% of the VMDK size on the vSAN datastore. Since all VMs were deployed with 40GB VMDKs with Failures to tolerate=1 failure - RAID-1 (Mirroring), the reservation value will be 20 GB.
As the first step, note the amount of free space in the vSAN datastore. This would help ascertain the impact of the change in the policy.
Select StripeWidth=2 policy from the list of available policies, and then the Edit Settings option. Navigate to vSAN > Advanced Policy Rules and modify the Object space reservation setting to 25%, as shown below

Proceed to complete the wizard with default values and click FINISH. A pop-up message requiring user input appears with details of the number of VMs using the policy being modified. This is to ascertain the impact of the policy change. Typically, such changes are recommended to be performed during a maintenance window. You can choose to enforce a policy change immediately or defer it to be changed manually at a later point. Leave it at the default, which is “Manually later”, by clicking Yes as shown below:

Next, select the Storage policy - StripeWidth=2 and click on the VM Compliance tab in the bottom pane. It will display the two VMs along with their storage objects, and the fact that they are no longer compliant with the policy. They are in an “Out of Date” compliance state as the policy has now been changed.
You can now enforce a policy change by navigating to [VM Storage Policies] and clicking on Reapply VM Storage Policy

When this button is clicked, the following popup appears.

When the reconfigure activity completes against the storage objects, and the compliance state is once again checked, everything should show as Compliant.

Since we have now included an ObjectSpaceReservation value in the policy, you may notice corresponding capacity reduction from the vSAN datastore.
For example, the two VMs with the new policy change have 40GB storage objects. Therefore, there is a 25% ObjectSpaceReservation implying 10GB is reserved per VMDK. So that's 10GB per VMDK, 1 VMDK per VM, 2 VMs equals 20 GB reserved space, right? However, since the VMDK is also mirrored, so there is a total of 40GB reserved on the vSAN datastore.
IOPS Limits and Checksum
vSAN incorporates a quality-of-service feature that can limit the number of IOPS an object may consume. IOPS limits are enabled and applied via a policy setting. The setting can be used to ensure that a particular virtual machine does not consume more than its fair share of resources or negatively impact the performance of the cluster as a whole.
This blog provides an insight into the feature - Performance Metrics when using IOPS Limits with vSAN
IOPS Limit
To create a new policy with an IOPS limit complete the following steps:
- Create a new Storage Policy as done previously
- In the Advanced Policy Rules set IOPS limit for object.

- Note that this value is calculated as the number of IOs using a weighted size of 32KB. In this example, we will use a value of 1000. Applying this rule to an object will result in an IOPS limit of 1000x32KB=32MB/s bandwidth being set.
It is important to note that not only is read and write I/O counted in the limit, but any I/O incurred by a snapshot is counted as well. If I/O against this VM or VMDK should rise above the 1000 threshold, the additional I/O will be throttled.
Checksum
In addition, by default end-to-end software checksum is enabled to ensure data integrity. In certain scenarios, an application or operating system within the VM has an inbuilt checksum mechanism. In such instances, you may choose to disable Object Checksum at the vSAN layer.
Follow these steps to disable Object Checksum,
- From the vSphere Client, navigate to Menu > Policies and Profiles and select VM Storage Policies.
- Select a Storage Policy to modify.
- Select Edit Settings
- Click NEXT and Navigate to Advanced Policy Rules
- Toggle Disable object checksum option as shown below:

vSAN POC Performance and Failure Testing Overview
Overview of a vSAN Performance POC process
POC or Proof-of-Concept testing demonstrates a conceptual proof of a desired solution. In the case of vSAN, a POC includes ESXi host setup, vCenter and cluster configuration, and resiliency and performance testing.
In the event of multiple solutions are compared, each solution should follow the exact same process during a POC for a clear distinctive comparison.
Definitions of day-operations in a Proof-of-Concept
In colloquial terms, the POC lifecycle is frequently divided into three phases:
Day-0
The post-design phase dedicated to “rack & stack” a hardware-based solution, including install of the hypervisor (in the case of ESXi) and Control plane (Virtual Center). Physical network uplinks and upstream network devices often require physical configuration, for example to support VLANs with their defined subnets supporting cluster services.
Day-1
Setup and configuration of the required solution (in the case of vSAN).
Day-2
Operational aspects operating a solution is to verify the full set of functionalities a solution offers, and typical administration task will be handled during a PoC. However, a proof-of-concept cluster should not run any production workload (i.e. facing end-users or customers) running, to disrupt usual business operations, but rather closely mirror actual production operations.
Proof-of-Concept flow diagram
This flow diagram summarizes the POC process: 
Performance Testing
For vSAN POCs, performance testing is often one of the most important factors to define the success of the PoC effort.
As with all Enterprise storage solutions, there are many variables that may impact performance: type of hardware, network infrastructure, cluster design, and workload performance characteristics, all contribute to performance testing results. Identifying the IO profile of workloads from an existing environment, is one of the important factors in a proof-of-concept to reflect the future production workload accurately. Performance test results can be further process and validates the design of a solution. (in this case vSAN)
To ensure proper interpretation of results, understanding of the typical metrics used in storage performance testing is required:
Reference for interdependencies between IOPS, MByte/s, blocksize in KByte, latency in milliseconds:
- IOPS = (MByte/s throughput / KByte per IO) * 1024
- MByte/s = (IOPS * KByte per IO) / 1024
- KByte per IO = (MByte/s * 1024) / IOPS
- IO latency = reflects the latency for reads and/or writes for each IO
OIO or Outstanding IO = parallel IO queues against a single storage device
Hardware design and sizing for high performance systems
High performance systems require undivided and unshared resources, including CPU, memory, and network. For the best possible performance, consider the following design patterns:
- Low or no CPU/memory overcommitment
- Ensure appropriate Host Power Management settings
- Use only NVMe or better devices with multiple disk groups per host
- Overcommitted PCI-Bus should be avoided
- Unconstrained network bandwidth between host top-of-rack switch
- Utilize switches with deep buffers.
- Ensure that the network fabric leaf/spine/super spine or core switch layer are designed to avoid overcommitment
Cache and capacity tier design choice
An all-flash vSAN design is necessary to achieve the lowest possible latencies. Devices from higher performance classes generally result in higher throughput in terms of IOPS and/or MB/s.
Performance class choice:
NVMe 3D Xpoint -> NVMe MLC high spec -> NVMe low spec
NVMe -> SAS SSD -> SATA SSD -> Magnetic Disk
In high-performance configurations, capacity disks are usually chosen from one category lower to the caching tier to achieve an ideal balance of latency and throughput during de-staging phase.
Network fabric and hardware design choice
For network-based storage solutions, network design is one of the most critical factors contributing to stability and IO performance and is not a unique to vSAN. Any type of storage requires the same care in design and sizing, especially when Performance is a critical factor. Deep buffer switches should be always considered, as vSAN benefits greatly from undisrupted network flow. Network transport issues introduced by shallow switch buffers, or other switch configurations that distort traffic flow (e.g. packet deprioritization) can result in higher latency for each IP flow (in case of vSAN) and respectively impact IO performance in a negative manner
Though not especially common among Enterprise hardware, switches with backplanes that cannot support full link utilization among all ports supporting vSAN, are not recommended. Further, devices that introduce bottlenecks to an upstream switching device for cross-port communications (such as a fabric extender), should not be utilized for vSAN traffic.
Calculating ideal switch buffer per port and total switch
Example: 25Gbit/s link speed, RTT latency with 1ms between hosts
- 25Gbit/s for TX & RX full duplex = 2x 3125 MByte/s at line speed
- 1ms round trip time
- 1x TX 3125MByte/s x 0.001 seconds = 3.125 MByte buffer per port
Assuming we have multiple hosts attached to one switch, multiply by the total ports consumed to obtain total required buffer size.
Example: 48port switch, 12 hosts consuming the same switch (assumptions from prior example remain unchanged)
- 12 x 3.125 MByte = 37.5MByte switch buffers (TX) minimum required
Note that some models of switch may be configured in ways that impact the amount of buffer
memory available to any given port. To ensure that a switch meets these estimated requirements,
consult the switch documentation, review the switch configuration, and if necessary, obtain assistance from the switch vendor.
Inter-switch link/uplink (ISL) capacity must be considered in cases where vSAN traffic will flow between hosts connected to distinct physical switches.
For example, continuing the above example with 12 hosts, we can estimate the peak level of possible traffic northbound to leaf to spine/ super spine or core switch:
- Extremely high IO may result in full link utilization for RX/TX on each host
- The bandwidth requirement for the inter-switch link may be found by multiplying:
Number of hosts x their network link speed x the number of ports per host; in this example 12 x 25Gbit x 2 = 600Gbit/s bandwidth (TX+RX) capacity required to support theoretical peak utilization.
Note that though inter-switch links may be overcommitted, IP latency resulting from congestion during peak utilization will directly increase IO latency for vSAN.
Additionally, vSAN cluster designs such as 2-node, stretched cluster, and use of manually defined fault domains can introduce additional network hops and traffic requirements that result in additional IO latency; take limitations regarding factors such as inter-site links into account when planning to test performance in these scenarios.
Synthetic vs. Real-Workload setup
vSAN performance testing includes usually two to three different workload profiles for evaluation.
Ideally, evaluating the performance of a clone of the actual workload would provide the most accurate insight into potential workload performance. However, this is not always possible, so it is important to understand the use case and IO profile of potential workloads in cases where synthetic benchmark testing will be used.
Software vendors often provide guidance on a storage setup and design in order to deliver ideal performance and application reliability. These recommendations should be considered both when configuring the workload itself (e.g. the quantity of disks attached to a VM and the use case for those disks by the application), as well as the vSAN Storage Policy that is applied to the VM/virtual disk objects.
Some typical IO profiles resemble the following:
- DB server
- Ideally specified by the application vendor with RAID1
- Large blocksize >32KB can be expected, high read %
- High IO demand
-
Front-End applications
- RAID1/5/6 depending on the application vendor
- Medium to low blocksize <32KB
- Low IO demand, high read %
-
Other standard application
- RAID1/5/6 depending on the application vendor
- Medium block size and can vary largely
- Low to medium IO demand, medium read %
Note: Revisit our Troubleshooting vSAN Performance Guide (link)
For example, if testing the performance of a SQL server solution, you would want to follow VMware’s SQL best practices for vSAN, including using a RAID-1 storage policy, while also setting an Object Space Reservation of 100% for objects such as the log drive(s). Furthermore, consider for performance related tests, to initialize all assigned disks for the first, to reduce the first write penalty during block allocation.
In cases where a real application cannot be deployed, a synthetic benchmark test is a useful tool to analyze vSAN performance. However, such tests require that you understand the workload profile to be tested (and should ideally be modeled from I/O characteristics observed in current ‘real-world’ scenarios). Some key characteristics of a workload profile include block size, read/write percentage, and sequential/random I/O percentage among others.
One noteworthy tool you can use to obtain your current workload I/O profiles is LiveOptics (previously known as DPACK). This tool is free to use.
Conducting a synthetic benchmark test will require knowledge of testing tools how to deploy/configure them and interpret the results. To expedite synthetic benchmarking tests, VMware publishes a ‘fling’ called HCIBench, which automates the deployment of Linux VMs with vdbench or Flexible IO tester (FIO) to generate storage I/O load on the cluster. The results can be monitored through the HCI Bench and vCenter UIs. HCIBench also utilizes vSAN Observer on the back end,and makes relevant output available as in a summary of test results.
For more information about HCIBench, please refer to the following blog posts:
- https://blogs.vmware.com/virtualblocks/2016/09/06/use-hcibench-like-pro-part-1/
- https://blogs.vmware.com/virtualblocks/2016/11/03/use-hcibench-like-pro-part-2/
- https://blogs.vmware.com/virtualblocks/2017/01/11/introducing-hcibench-1-6/
- https://labs.vmware.com/flings/hcibench
A high-level view of Performance Testing:
- Characterize the target workload(s)
- LiveOptics
- IOInsight
- Simulate target workloads
- HCIBench
- Change Storage Policies and/or vSAN Services as needed
- Compare result reports & vSAN Observer output

Characterize target workload with Liveoptics
The following represent key aspects of workload performance that constitute a workload IO profile:
The relevant metrics are easily identifiable in the output from a performance auditing tool such as Live Optics:
Example: LiveOptics Report

When collecting performance data, long-term capture periods provide more accurate statistics for peak IO load and 95%-percentile performance. Performance statistics should not be collected for less than 24 hours if possible, and 7-10 days is ideal. In any case, it is critically important to capture performance statistics that highlight peak load during working hours, and any IO load generated by off-hours operations such as batch data processing or system backup jobs. Note also that LiveOptics is not limited virtualized environments -- physical hosts can be included in the data capture.
In the above example, you can identify the following details to define a workload for testing with HCIbench:
- VM amount
- IOPS peak and 95%ile
- Read / Write ratio
- IO block size independently for reads and writes average
- IO latency for reads and writes average
- Runtime
To create a custom workload profile for FIO with the above example with some simple calculations:
- # VMs to deploy
- Local disks / # VMs= 410 / 90 = 4.5 vmdk per VM = ~ 5 vmdk per VM
- Read %
- Read/write blocksize
- IO Latency for latency probing approach or as reference
- IOdepth or outstanding IO can be calculated:
- Peak IOPS = 175885
- Read + write latency
- # vmdk
- OIO setting = peak IOPS (∑ reads + writes) x (reads + write latency) / # vmdk =
175885 x 0.0029sec / # 410 vmdk = ~1.2 = ~ 2 OIO
This provides the parameters for the FIO custom profile definition for HCIbench, runtime with 3600sec:
[global]
runtime=3600
time_based=1
rw=randwrite
rwmixread=67
rwmixwrite=100
percentage_random=100
blocksize=62k,28k
ioengine=libaio
buffered=0
direct=1
fsync=1
group_reporting
log_avg_msec=1000
continue_on_error=all
[job0]
filename=/dev/sda
size=100%
iodepth=2
[job1]
filename=/dev/sdb
size=100%
iodepth=2
When testing any storage solution, be sure to set a sufficiently long run-time to accurately assess the performance characteristics of the system. Short performance benchmark runtimes often present inaccurate metrics that are artificially enhanced by caching performance but cannot be sustained during longer term operations. This is usually reflected in longer-term performance tests regardless if the storage solution tested is an HCI solution, or a traditional array.
Because of caching effects, when testing with small IO blocksizes or low IO write %, a longer runtime is required to confirm the storage performance. Please also consult FIO documentation for additional information: (link)
Performance test approach flow diagram

IO load definitions
Some helpful hints for interpreting performance test results:
- Peak workload
Peak workload performance reflects the observed maximum of a storage system for all hosts/workloads participating in a performance test. Spikes to peak workload performance are generally associated with IO intensive application operations.

- 95%ile workload
95%ile workload performance identifies 95% of all IO processed in a specific time frame (capture time):

- Average performance
Average performance provides the total average IO performance across all VMs within a cluster or host and time frame and is less ideal for workload profile definition. IO burst or unusually high IO outlier workloads may be obscured by other more normalized workloads contributing to the average.
Note: HCIbench easy-run feature provides in a simple way this test with different types of workloads.

Peak and 95% percentile workload are the most reliable values to be used to develop an IO profile for synthetic benchmark testing, and most effectively demonstrate the cluster’s sustainable workload performance when tested for an adequate period of time (> 1hr).
- Comparison between all performance measurements

Maximum’s performance test with single/multi-tier solution
Storage Solutions are most often using any type of in-cache function to pre-buffer IO through the backend channels. Any test performed should highlight any type of shortcoming during an IO test run.
HCIbench provides the choice to upload a customized FIO profile to replay on a storage system.
Recommended procedure is by probing the amount of parallel outstanding IO against the experienced IO latency and setting thresholds during IO test period and let the IO generating application (FIO) automatically adjust the outstanding IO. In this scenario, IO will receive a certain maximum in IO latency but not overwhelm the underlay hardware. Focus – IO representation on latency versus uncontrolled synthetic tests.
In this example we are using 50ms IO latency for IO reads and IO writes combined and separately control reads/writes with FIO. In order to achieve best possible performance outcome each attached vmdk, to generate IO, will become a critical factor.
Common case, using the same amount of average vmdk as in production, or limit to =4 (higher side). More VMs per host to be considered (4-16 VMs) to achieve a balanced and heavy workload.
Example:
- Read/write ratio 70/30%, 100% randomness, 4k block reads and writes
- Unbuffered and verified
- Generated IO to be 2:1 dedup- and compressible (or 50%)
- Latency target with 50000us or 50ms IO reads + writes
- Latency window to increase every 5min the value of outstanding IO
- 95%ile for all IO require to be executed and requested
- Test must run 3600s (must be also set in HCIbench)
- Example Test requires 4x vmdk and total size must exceed caching tier (or memory) capacity of Tier-1
- OIO start with =1 and maximum =256 for each vmdk
[global]
runtime=3600time_based=1rw=randrwrwmixread=70rwmixwrite=30percentage_random=100
# IO split example#bssplit=4k/20:64k/40:32k/40
blocksize=4k,4kioengine=libaiobuffered=0direct=1fsync=1group_reportinglog_avg_msec=1000continue_on_error=all# 50% buffer dedup and compress = 2:1, if value set to 80% = 5:1dedupe_percentage=50buffer_compress_percentage=50refill_buffers=1
[job-sda]# /dev/sda in hcibench is not the OS disk
filename=/dev/sdasize=100%iodepth=256iodepth_low=1latency_target=50000latency_window=300000latency_percentile=95random_distribution=zoned:25/25:25/25:25/25:25/25
[job-sdb]filename=/dev/sdbsize=100%iodepth=256iodepth_low=1latency_target=50000latency_window=300000latency_percentile=95random_distribution=zoned:25/25:25/25:25/25:25/25
[job-sdc]filename=/dev/sdcsize=100%iodepth=256iodepth_low=1latency_target=50000latency_window=300000latency_percentile=95random_distribution=zoned:25/25:25/25:25/25:25/25
[job-sdd]filename=/dev/sddsize=100%iodepth=256iodepth_low=1latency_target=50000latency_window=300000latency_percentile=95random_distribution=zoned:25/25:25/25:25/25:25/25
Over the course of the IO test, the latency will increase to the maximum and might overreach above the threshold and reduces accordingly by IO engine from FIO.
Traditional storage system should incorporate one LUN per VM and all vmdk being placed on the very same.
Comparison between different type of storage solutions can be achieved through this approach by controlling IO through latency.
Performance Monitoring through vCenter UI
vSAN includes a performance monitoring service that can be used to observe performance and allows to troubleshoot related issues in a quick fashion. Performance charts are available for many different components of the vSAN solution:
- Cluster
- Hosts
- Virtual Machines and Virtual Disks
- Disk groups
- Physical disks
A detailed list of performance graphs and descriptions can be found here.
The vSAN performance monitoring service is enabled by default. If in case it is disabled, it can be re-enabled through the following steps:
Navigate to the vSAN Cluster.
- Click the Configure tab.
- Select Services from the vSAN Section
- Navigate to Performance Service, Click EDIT to edit the performance settings.
Once the service has been enabled (default), performance statistics can be viewed from the performance menus in vCenter. The following example is meant to provide an overview of using the performance service. For purposes of this exercise, we will examine IOPS, throughput, and latency from the Virtual Machine level (reflecting IO performance observed by VMs) and the vSAN Backend level (vSAN operations such as replication and resync traffic that are not directly observable at the VM layer).
The cluster level shows performance metrics from a cluster level perspective and includes all virtual machine operations.
To observe IOPS from a cluster level:
- From the Cluster level in vCenter, Click on the Monitor tab.
- Navigate to the vSAN section and click on Performance
We will now examine performance statistics for the vSAN Backend.
To access the vSAN - Backend performance metrics select the BACKEND tab from the menu on the left.
File Service is a new feature included with vSAN 7 that provides file share capabilities. When enabled, you can monitor the performance of the File Shares in the FILE SHARE tab.
More information on vSAN File Services can be found here.
The performance service allows administrators to view not only real-time data, but historical data as well. By default, the performance service view displays the last hour of data. This time window can be changed by specifying a custom range of 24 hours.
vCenter real-time data
If more detailed information regarding outstanding IO (OIO), read/write latency, IOPS or other performance counters is required, real-time data collected by vCenter allows us to analyze performance for the previous hour.

Performance counters are available for Cluster / ESXi host / VMs and their associated disks including vSAN backend data.
Advanced statistics through Support Insight
Beginning with version 6.7U3, vCenter provides advanced support statistics to facilitate troubleshooting the vSphere and vSAN solution stacks.
Additionally, in 6.7U3 and above, advanced network statistics are available to monitor physical network uplinks or VMkernel ports.

The ‘Network diagnostic mode’ option for the vSAN performance service should be only enable if required by VMware support.
Advanced and debug information can be accessed via Monitor -> Support -> Performance for Support

IOInsight
vSphere 7U1 introduces IOinsight for deep-dive performance analytics around performance. IOInsight is available as fling if using vSphere versions < 7.0U1.
From the cluster level, click Monitor and then Performance. Now we can examine performance from the cluster level or observe specific VMs (up to 10 at a time).
This makes it easy to compare IOPS, throughput, and latency for multiple VMs.
The next major improvement to performance monitoring is the inclusion of IOInsight in 7.0U1.
Click IOInsight and then New Instance. You can select entire hosts or specific VMs to monitor. IOInsight can capture statistics for a time period ranging from 1 minute to 24 hours. The system will limit IOInsight monitoring overhead to 1% CPU and memory consumption but note that when running with high IOPS of 200K/host or greater, you might see 2-3% drop in IOPS while the service is running.
The capture shows you detailed metrics for each VM. Key metrics include IOPS, Throughput, Latency, Random/Sequential, Alignment, read/Write %, latency and IO Size (Block Size) Distribution.
Performance monitoring through vsantop utility
Beginning in vSphere 6.7 Update 3 a new command-line utility, vsantop, was introduced. This utility is focused on monitoring vSAN performance metrics at an individual ESXi host level. Traditionally with ESXi, an embedded utility called esxtop was used to view real-time performance metrics. This utility assisted in ascertaining the resource utilization and performance of the system. However, vSAN required a custom utility with awareness of its distributed architecture. It collects and persists statistical data in a RAM disk. Based on the configured interval rate, the metrics are displayed on the secure shell console. This interval is configurable and can be reduced or increased depending on the amount of detail required. The workflow is illustrated below for a better understanding:

To initiate vsantop, log in to the ESXi host through a secure shell (ssh) with root user privileges and run the command vsantop on the ssh console.
vsantop provides detailed insights into vSAN component level metrics at a low interval rate. This helps in understanding resource consumption and utilization patterns. vsantop is primarily intended for advanced vSAN users and VMware support personnel.
Monitoring vSAN through integrated vRealize Operations Manager in vCenter
One option for monitoring vSAN is through the integration of vRealize Operations Manager plugin in vCenter.
The feature is enabled in the HTML5 based vSphere client and allows an administrator to either install a new vRealize Operations Manager instance or integrate with an existing deployment.
You can initiate the workflow by navigating to Menu > vRealize Operations as shown below:
Once the integration is complete, you can access the predefined dashboards as shown below:
The following out-of-the-box dashboards are available for monitoring purposes:
- vCenter - Overview
- vCenter - Cluster View
- vCenter - Alerts
- vSAN- Overview
- vSAN - Cluster View
- vSAN - Alerts
For vSAN, the Overview, Cluster View, and Alerts dashboards allow an administrator to have a snapshot of a vSAN cluster’s current state. Specific performance metrics such as IOPS, Throughput, Latency, and Capacity related information are also available as depicted below:
Performance Testing Using HCIbench
HCIbench aims to simplify and accelerate customer Proof of Concept (POC) performance testing in a consistent and controlled methodology. The tool fully automates the end-to-end process of deploying test VMs, coordinating workload runs, aggregating test results, and collecting necessary data for troubleshooting purposes. Evaluators choose the profiles they are interested in and HCIbench does the rest quickly and easily.
This section provides an overview and recommendations for successfully using HCIbench. For complete documentation, refer to the HCIbench User Guide.
HCIbench and complete documentation can be downloaded from https://labs.vmware.com/flings/hcibench
This tool is provided free of charge and with no restrictions. Support will be provided solely on a best-effort basis as time and resources allow, by the VMware vSAN Community Forum.
Deploying HCIbench
Step 1 – Deploy the OVA
Firstly, download and deploy the HCIbench appliance. The process for deploying the HCIbench appliance is no different from deploying any other appliance in vSphere platform.
Step 2 – HCIbench Configuration
After deployment, navigate to http://<Controller VM IP>:8080/ to configure the appliance
There are three main sections to consider:
- vSAN cluster and host information
- Guest VM Specification
- Workload Definitions
For detailed steps on configuring and using HCIbench refer to the HCIbench User Guide.
vSAN Hybrid vs. vSAN All-flash
vSAN hybrid cluster are defined by the SSD/NVMe caching disks and magnetic disks and the performance between caching and capacity is significantly different. SSDs/NVMe usually can perform > 300MB/s for reads and writes in parallel whereas magnetic disks usually reach less then 50MByte/s with a latency <20ms (typical less than 250 IOPS). If reads can be served by the caching tier (if not de-staged) the performance can reach the maximums values from the caching tier. Ideal approach reaching > 90% of all IO served from the caching tier under normal circumstances.
Ideal Test-workflow for vSAN Hybrid:
Working set used to accommodate 30% of IO write on the caching tier
- VM vmdk disks are initialized with zero or random (ideal), covering physical block allocation - first write penalty
- Enforced de-staging with HCIbench is not required
- Long Test-Runs to reach the phase of “hot cache” and multiple de-staging phases to identify max/95%/avg and sustained workload
- All-flash on the other hand uses the caching tier only for IO writes and if the IO is de-staged, read IO can be served from the capacity tier in parallel.
Ideal Test-workflow for vSAN all-flash:
- Working set to over-size for the caching tier size of a solution
- VM vmdk disks are initialized with zero or random (ideal), covering physical block allocation - first write penalty
- Enforced de-staging with HCIbench to identify clearly IO write performance from the start
- Long Test-Runs to reach multiple de-staging phases to identify max/95%/avg and sustained workload across the cluster
Considerations for Defining Test Workloads
Either FIO (default) or vdbench can be chosen as the testing engine. Here, we recommend using FIO, due to the exhaustive list of parameters that can be set. Pre-defined parameter files can be uploaded to HCIbench to be executed (a wider variety of options are available, such as different read/write block sizes outside of what can be defined within the configuration page, for a full list of FIO options, consult the FIO documentation (link)
Although 'Easy Run' can be selected, we recommend explicitly defining a workload pattern to ensure that tests are tailored to the performance requirements of the POC. Below, we walk through some of the important considerations.
Working set
Defining the appropriate working set is one of the most important factors for correctly running performance tests and obtaining accurate results and is defined as IO change to the VM vmdk. For the best performance, a virtual machine’s working set should be mostly in the cache. Care should be taken when sizing your vSAN caching tier to account for all the virtual machines’ working sets residing in the cache. A general rule of thumb, in hybrid environments, is to size cache as 10% of your consumed virtual machine storage (not including replica objects). While this is adequate for most workloads, understanding your workload’s working set before sizing is a useful exercise.
For all-flash environments, consult the table below

The following process is an example of sizing an appropriate working set for performance testing with HCIbench:
Consider a four-node cluster with one 400GB SSD per node. This gives the cluster a total cache size of 1.6TB. For a Hybrid cluster, the total cache available in vSAN is split 70% for read cache and 30% for write cache. This gives the cluster in our example 1120GB of available read cache and 480GB of available write cache.
To correctly fit the HCIbench within the available cache, the total capacity of all VMDKs used for I/O testing should not exceed 1,120GB. For All-Flash, 100% of the cache is allocated for writes (thus the total capacity of all VMDKs is 1.6TB).
We create a test scenario with four VMs per host, each VM having 5 X 10GB VMDKs, resulting in a total size of 800GB -- this will allow the test working set to fit within the cache.
The number and size of the data disk, along with the number of threads should be adjusted so that the product of the test set is less than the total size of the cache tier.
Thus:
# of VMs x # of Data Disk x Size of Data Disk x # of Threads < Size of Cache Disk x Disk Groups per Host x Number of Hosts x [70% read cache (hybrid)]
For example:
4 VMs x 5 Data Disks x 10GB x 1 Thread = 800GB,
400GB SSDs x 70% x 1 Disk Group per Host x 4 Hosts = 1,120GB
Therefore, 800GB working set size is less than the 1,120GB read cache in cluster, i.e there is more read cache available than our defined working set size. Therefore, this is an acceptable working set size.
Note: the maximum working set size per cache disk is 600GB. If your cache disk size is greater, use this value in the above calculations.
Sequential workloads versus random workloads
Before doing performance tests, it is important to understand the performance characteristics of the production workload to be tested: different applications have different performance characteristics. Understanding these characteristics is crucial to successful performance testing. When it is not possible to test with the actual application or application-specific testing tool it is important to design a test that matches the production workload as closely as possible. Different workload types will perform differently on vSAN.
- Sustained sequential write workloads (such as VM cloning operations) running on vSAN will simply fill the cache and future writes will need to wait for the cache to be de-staged to the capacity tier before more I/Os can be written to the cache. Thus, in a hybrid environment, performance will be a reflection of the spinning disk(s) and not of flash. The same is true for sustained sequential reads. If the block is not in the cache, it will have to be fetched from the spinning disk. Mixed workloads will benefit more from vSAN’s caching design.
- HCIbench allows you to change the percentage read and the percentage random parameters; a good starting point here is to set the percentage read parameter to 70% and the percentage random parameter to 30%.
Prepare Virtual Disk Before Testing
To achieve a 'clean' performance run, the disks should be wiped before use. To achieve this, select a value for the 'Prepare Virtual Disk Before Testing'. This option will either zero or randomize the data (depending on the selection) on the disks for each VM being used in the test, helping to alleviate a first write penalty during the performance testing phase. We recommend that the disks are randomized if using the Deduplication & Compression feature.
Warm up period
As a best practice, performance tests should include at least a 15-minute warm-up period. Also, keep in mind that the longer testing runs the more accurate the results will be. Warm-up period is used mainly in hybrid solutions.
Testing Runtime
HCIbench tests should be configured for at least one hour to observe the effects of destaging from the cache to the capacity tier. Runtime is defined by the amount of block changes in the caching tier and chosen workload load profile. Small blocksizes required more time to achieve a total block change on the cache versus large blocksizes.
Blocksize
It is important to match the block size of the test to that of the workload being simulated, as this will directly affect the throughput and latency of the cluster. Therefore, it is paramount that this information be gathered before the start of the tests (for instance, from a Live Optics assessment).
Results
After testing is completed, you can view the results at http://<Controller VM IP>:8080/results in a web browser. A summary file of the tests will be present inside the subdirectory corresponding to the test run. To export the results to a ZIP file, click on the 'save result' option on the HCIbench configuration page (and wait for the ZIP file to be fully populated).
As HCIbench is integrated with the vSAN performance service, the performance data can also be reviewed within the vCenter HTML5 UI, under [vSAN cluster] > Monitor > vSAN > Performance.
Testing Hardware Failures
Understanding Expected Behaviors
When conducting any failure testing, it is important to consider the expected outcome before the test is conducted. With each test described in this section, you should first read the preceding description to first understand how the test will affect the system.
Note: It is important to test one scenario at any instance and restore completely before the next test condition
As with any system design, a configuration is built to tolerate a certain level of availability and performance. It is important that each test is conducted within the limit of the design systematically. By default, VMs deployed on vSAN inherit the default storage policy, with the ability to tolerate one failure. When a second failure is introduced without resolving the first, the VMs will not be able to tolerate the second failure and may become inaccessible. It is important that you resolve the first failure or test within the system limits to avoid such unexpected outcomes.
VM Behavior when Multiple Failures Encountered
Previously we discussed VM operational states and availability. To recap, a VM remains accessible when the full mirror copy of the objects are available, as well as greater than 50% of the components that make up the VM; the witness components are there to assist with the latter requirement.
Let’s talk a little about VM behavior when there are more failures in the cluster than the NumberOfFailuresToTolerate setting in the policy associated with the VM.
VM Powered on and VM Home Namespace Object Goes Inaccessible
If a running VM has its VM Home Namespace object go inaccessible due to failures in the cluster, a number of different things may happen. Once the VM is powered off, it will be marked "inaccessible" in the vSphere web client UI. There can also be other side effects, such as the VM getting renamed in the UI to its “.vmx” path rather than VM name, or the VM being marked "orphaned".
VM Powered on and Disk Object is inaccessible
If a running VM has one of its disk objects become inaccessible, the VM will keep running, but its VMDK’s I/O is stalled. Typically, the Guest OS will eventually time out I/O. Some operating systems may crash when this occurs. Other operating systems, for example, some Linux distributions, may downgrade the filesystems on the impacted VMDK to read-only. The Guest OS behavior and even the VM behavior is not vSAN specific. It can also be seen on VMs running on traditional storage when the ESXi host suffers an APD(All Paths Down).
Once the VM becomes accessible again, the status should resolve, and things go back to normal. Of course, data remains intact during these scenarios.
What happens when a server fails or is rebooted?
A host failure can occur in numerous ways, it could be a crash, or it could be a network issue (which is discussed in more detail in the next section). However, it could also be something as simple as a reboot, and that the host will be back online when the reboot process completes. Once again, vSAN needs to be able to handle all of these events.
If there are active components of an object residing on the host that is detected to be failed (due to any of the stated reasons) then those components are marked as ABSENT. I/O flow to the object is restored within 5-7 seconds by removing the ABSENT component from the active set of components in the object.
The ABSENT state is chosen rather than the DEGRADED state because in many cases a host failure is a temporary condition. A host might be configured to auto-reboot after a crash, or the host’s power cable was inadvertently removed, but plugged back in immediately. vSAN is designed to allow enough time for a host to reboot before starting to rebuild objects on other hosts so as not to waste resources. Because vSAN cannot tell if this is a host failure, a network disconnect, or a host reboot, the 60-minute timer is once again started. If the timer expires, and the host has not rejoined the cluster, a rebuild of components on the remaining hosts in the cluster commences.
If a host fails or is rebooted, this event will trigger a "Host connection and power state" alarm, and if vSphere HA is enabled on the cluster. It will also cause a" vSphere HA host status" alarm and a “Host cannot communicate with all other nodes in the vSAN Enabled Cluster” message.
If NumberOfFailuresToTolerate=1 or higher in the VM Storage Policy, and an ESXi host goes down, VMs not running on the failed host continue to run as normal. If any VMs with that policy were running on the failed host, they will get restarted on one of the other ESXi hosts in the cluster by vSphere HA, as long as it is configured on the cluster.
Caution: If VMs are configured in such a way as to not tolerate failures, (NumberOfFailuresToTolerate=0), a VM that has components on the failing host will not have objects protected on another host and might not survive a failure.
Simulating Failure Scenarios
It can be useful to run simulations on the loss of a particular host or disk, to see the effects of planned maintenance or hardware failure. The Data Migration Pre-Check feature can be used to check object availability for any given host or disk. These can be run at any time without affecting VM traffic.
Loss of a Host
Navigate to:
[vSAN Cluster] → Monitor → vSAN → Data Migration Pre-check

From here, you can select the host to run the simulations on. After a host is selected, the pre-check can be run against three available options, i.e., Full data migration, Ensure accessibility, No data migration:

Select the desired option and click the Pre-Check button. This gives us the results of the simulation. From the results, three sections are shown, i.e.: Object Compliance and Accessibility, Cluster Capacity and Predicted Health.
The Object Compliance and Accessibility view show how the individual objects will be affected:

Cluster Capacity shows how the capacity of the other hosts will be affected. Below we see the effects of the 'Full data migration' option:

Predicted Health shows how the health of the cluster will be affected:

Loss of a Disk
Navigate to:
[vSAN Cluster] → Configure → vSAN → Disk Management
From here, select a host or disk group to bring up a list of disks. Simulations can then be run on a selected disk or the entire disk group:

Once the Pre-Check Data Migration button option is selected, we can run different simulations to see how the objects on the disk are affected. Again, the options are Full data migration, Ensure accessibility (default) and No data migration:

Selecting 'Full data migration' will run a check to ensure that there is sufficient capacity on the other hosts:

Host Failures
Simulate Host Failure without vSphere HA
Without vSphere HA, any virtual machines running on the host that fails will not be automatically started elsewhere in the cluster, even though the storage backing the virtual machine in question is unaffected.
Let’s take an example where a VM is running on a host (10.159.16.118):

It would also be a good test if this VM also had components located on the local storage of this host. However, it does not matter as the test will still highlight the benefits of vSphere HA.
Next, the host, namely 10.159.16.118 is rebooted. As expected, the host is not responding in vCenter, and the VM becomes disconnected. The VM will remain in a disconnected state until the ESXi host has fully rebooted, as there is no vSphere HA enabled on the cluster, so the VM cannot be restarted on another host in the cluster.

If you now examine the policies of the VM, you will see that it is non-compliant. This VM should be able to tolerate one failure but due to the failure currently in the cluster (i.e. the missing ESXi host that is rebooting) this VM cannot tolerate another failure, thus it is non-compliant with its policy.
What can be deduced from this is that, not only was the VM’s compute running on the host, which was rebooted, but that it also had some components residing on the storage of the host that was rebooted. We can see the effects of this on the other VMs in the cluster, that show reduced availability:

Once the ESXi host has rebooted, we see that the VM is no longer disconnected but left in a powered off state.

If the physical disk placement is examined, we can clearly see that the storage on the host that was rebooted, i.e. 10.159.16.118, was used to store components belonging to the VM.

Simulate Host Failure With vSphere HA
Let’s now repeat the same scenario, but with vSphere HA enabled on the cluster. First, power on the VM from the last test.
Next, navigate to [vSAN cluster] > Configure > Services > vSphere Availability. vSphere HA is turned off currently.

Click on the EDIT button to enable vSphere HA. When the wizard pops up, toggle the vSphere HA option as shown below, then click OK.

Similarly, enable DRS under Services > vSphere DRS.
This will launch several tasks on each node in the cluster. These can be monitored via the "Recent Tasks" view near the bottom. When the configuring of vSphere HA tasks are complete, select [vSAN cluster] > Summary and expand the vSphere HA window and ensure it is configured and monitoring. The cluster should now have vSAN, DRS and vSphere HA enabled.

Verify the host the test VM is residing on. Now repeat the same test as before by rebooting the host. Examine the differences with vSphere HA enabled.

On this occasion, a number of HA related events should be displayed on the "Summary" tab of the host being rebooted (you may need to refresh the UI to see these):

This time, rather than the VM becoming disconnected for the duration of the host reboot like was seen in the last test, the VM is instead restarted on another host, in this case, 10.159.16.115:

Earlier we saw that there were some components belonging to the objects of this VM residing a disk of the host that was rebooted. These components now show up as “Absent” under [vSAN Cluster] > Monitor > vSAN > Virtual Objects > View Placement Details, as shown below:

Once the ESXi host completes rebooting, assuming it is back within 60 minutes, these components will be rediscovered, resynchronized and placed back in an "Active" state.
Should the host be disconnected for longer than 60 minutes (the CLOMD timeout delay default value), the “Absent” components will be rebuilt elsewhere in the cluster.
Disk Failures
Drive is removed unexpectedly from ESXi Host
When a drive contributing storage to vSAN is removed from an ESXi host without decommissioning, all the vSAN components residing on the disk go ABSENT and are inaccessible.
The ABSENT state is chosen over DEGRADED because vSAN knows the disk is not lost, but just removed. If the disk is placed back in the server before a 60-minute timeout, no harm is done and vSAN syncs it back up. In this scenario, vSAN is back up with full redundancy without wasting resources on an expensive rebuild task.
Expected Behaviors
- If the VM has a policy that includes NumberOfFailuresToTolerate=1 or greater, the VM’s objects will still be accessible from another ESXi host in the vSAN Cluster.
- The disk state is marked as ABSENT and can be verified via vSphere client UI.
- At this point, all in-flight I/O is halted while vSAN reevaluates the availability of the object (e.g. VM Home Namespace or VMDK) without the failed component as part of the active set of components.
- If vSAN concludes that the object is still available (based on a full mirror copy and greater than 50% of the components being available), all in-flight I/O is restarted.
- The typical time from physical removal of the disk, vSAN processing this event, marking the component ABSENT, halting and restoring I/O flow is approximately 5-7 seconds.
- If the same disk is placed back on the same host within 60 minutes, no new components will be rebuilt.
- If 60 minutes pass and the original disk has not been reinserted in the host, components on the removed disk will be built elsewhere in the cluster (if capacity is available) including any newly inserted disks claimed by vSAN.
- If the VM Storage Policy has NumberOfFailuresToTolerate=0, the VMDK will be inaccessible if one of the VMDK components (think one component of a stripe or a full mirror) resides on the removed disk. To restore the VMDK, the same disk must be placed back in the ESXi host. There is no other option for recovering the VMDK.
SSD is Pulled Unexpectedly from ESXi Host
When a solid-state disk drive is pulled without decommissioning it, all the vSAN components residing in that disk group will go ABSENT and are inaccessible. In other words, if an SSD is removed, it will appear as a removal of the SSD as well as all associated magnetic disks backing the SSD from a vSAN perspective.
Expected Behaviors
- If the VM has a policy that includes NumberOfFailuresToTolerate=1 or greater, the VM’s objects will still be accessible.
- Disk group and the disks under the disk group states will be marked as ABSENT and can be verified via the vSphere web client UI.
- At this point, all in-flight I/O is halted while vSAN reevaluates the availability of the objects without the failed component(s) as part of the active set of components.
- If vSAN concludes that the object is still available (based on a full mirror copy and greater than 50% of components being available), all in-flight I/O is restarted.
- The typical time from physical removal of the disk, vSAN processing this event, marking the components ABSENT, halting and restoring I/O flow is approximately 5-7 seconds.
- When the same SSD is placed back on the same host within 60 minutes, no new objects will be re-built.
- When the timeout expires (default 60 minutes), components on the impacted disk group will be rebuilt elsewhere in the cluster, providing enough capacity and is available.
- If the VM Storage Policy has NumberOfFailuresToTolerate=0, the VMDK will be inaccessible if one of the VMDK components (think one component of a stripe or a full mirror) exists on disk group whom the pulled SSD belongs to. To restore the VMDK, the same SSD has to be placed back in the ESXi host. There is no option to recover the VMDK.
What Happens When a Disk Fails?
If a disk drive has an unrecoverable error, vSAN marks the disk as DEGRADED as the failure is permanent.
Expected Behaviors
- If the VM has a policy that includes NumberOfFailuresToTolerate=1 or greater, the VM’s objects will still be accessible.
- The disk state is marked as DEGRADED and can be verified via vSphere web client UI.
- At this point, all in-flight I/O is halted while vSAN reevaluates the availability of the object without the failed component as part of the active set of components.
- If vSAN concludes that the object is still available (based on a full mirror copy and greater than 50% of components being available), all in-flight I/O is restarted.
- The typical time from physical removal of the drive, vSAN processing this event, marking the component DEGRADED, halting, and restoring I/O flow is approximately 5-7 seconds.
- vSAN now looks for any hosts and disks that can satisfy the object requirements. This includes adequate free disk space and placement rules (e.g. 2 mirrors may not share the same host). If such resources are found, vSAN will create new components on there and start the recovery process immediately.
- If the VM Storage Policy has NumberOfFailuresToTolerate=0, the VMDK will be inaccessible if one of the VMDK components (think one component of a stripe) exists on the pulled disk. This will require a restore of the VM from a known good backup.
What Happens When an SSD Fails?
An SSD failure follows a similar sequence of events to that of a disk failure with one major difference; vSAN will mark the entire disk group as DEGRADED. vSAN marks the SSD and all disks in the disk group as DEGRADED as the failure is permanent (disk is offline, no longer visible, and others).
Expected Behaviors
- If the VM has a policy that includes NumberOfFailuresToTolerate=1 or greater, the VM’s objects will still be accessible from another ESXi host in the vSAN cluster.
- Disk group and the disks under the disk group states will be marked as DEGRADED and can be verified via the vSphere web client UI.
- At this point, all in-flight I/O is halted while vSAN reevaluates the availability of the objects without the failed component(s) as part of the active set of components.
- If vSAN concludes that the object is still available (based on available full mirror copy and witness), all in-flight I/O is restarted.
- The typical time from physical removal of the drive, vSAN processing this event, marking the component DEGRADED, halting, and restoring I/O flow is approximately 5-7 seconds.
- vSAN now looks for any hosts and disks that can satisfy the object requirements. This includes adequate free SSD and disk space and placement rules (e.g. 2 mirrors may not share the same hosts). If such resources are found, vSAN will create new components on there and start the recovery process immediately.
- If the VM Storage Policy has NumberOfFailuresToTolerate=0, the VMDK will be inaccessible if one of the VMDK components (think one component of a stripe) exists on disk group whom the pulled SSD belongs to. There is no option to recover the VMDK. This may require a restore of the VM from a known good backup.
Warning: Test one thing at a time during the following POC steps. Failure to resolve the previous error before introducing the next error will introduce multiple failures into vSAN which it may not be equipped to deal with, based on the NumberOfFailuresToTolerate setting, which is set to 1 by default.
vSAN Disk Fault Injection Script for POC Failure Testing
A python script to help with POC disk failure testing is available on all ESXi hosts. The script is called vsanDiskFaultInjection.pyc and can be found on the ESXi hosts in the directory /usr/lib/vmware/vsan/bin. To display the usage, run the following command:
[root@cs-ie-h01:/usr/lib/vmware/vsan/bin] python ./vsanDiskFaultInjection.pyc -h
Usage:
injectError.py -t -r error_durationSecs -d deviceName
injectError.py -p -d deviceName
injectError.py -z -d deviceName
injectError.py -c -d deviceName
Options:
-h, --help show this help message and exit
-u Inject hot unplug
-t Inject transient error
-p Inject permanent error
-z Inject health error
-c Clear injected error
-r ERRORDURATION Transient error duration in seconds
-d DEVICENAME, --deviceName=DEVICENAME
[root@cs-ie-h01:/usr/lib/vmware/vsan/bin]
Warning: This command should only be used in pre-production environments during a POC. It should not be used in production environments. Using this command to mark disks as failed can have a catastrophic effect on a vSAN cluster.
Readers should also note that this tool provides the ability to do “hot unplug” of drives. This is an alternative way of creating a similar type of condition. However, in this POC guide, this script is only being used to inject permanent errors.
Note: With the release of vSAN 6.7 P02 and vSAN 7.0 P01 , vSAN introduced Full Rebuild Avoidance. In some circumstances transient device/storage errors could cause vSAN objects to be marked as degraded and, as a result vSAN may unnecessarily mark device as failed. Now vSAN can differentiate between transient and permanent storage errors thereby avoids marking device as FAILED, thus avoiding unnecessary rebuilds of objects if a device recovers from a transient failure.
However for the purposed of POC it maybe required to simulate failures. Below procedure outlines toggling this feature on or off.
As setting is enabled on a per vSAN node basis, to view the current value issue from an ESXi host issue:
esxcli system settings advanced list -o /LSOM/lsomEnableFullRebuildAvoidance
To disable (0) issue:
esxcli system settings advanced set -o /LSOM/lsomEnableFullRebuildAvoidance -i 0
Once the POC failure simulations have completed enable this important feature (1)
esxcli system settings advanced set -o /LSOM/lsomEnableFullRebuildAvoidance -i 1
Pull Magnetic Disk/Capacity Tier SSD and Replace before Timeout Expires
In this first example, we shall remove a disk from the host using the vsanDiskFaultInjection.pyc python script rather than physically removing it from the host.
It should be noted that the same tests can be run by simply removing the disk from the host. If physical access to the host is convenient, literally pulling a disk would test exact physical conditions as opposed to emulating it within the software.
Also, note that not all I/O controllers support hot unplugging drives. Check the vSAN Compatibility Guide to see if your controller model supports the hot unplug feature.
We will then examine the effect this operation has on vSAN, and virtual machines running on vSAN. We shall then replace the component before the CLOMD timeout delay expires (default 60 minutes), which will mean that no rebuilding activity will occur during this test.
Pick a running VM. Next, navigate to [vSAN Cluster] > Monitor > Virtual Objects and find the running VM from the list shown and select a Hard Disk.

Select View Placement Details:

Identify a Component object. The column that we are most interested in is HDD Disk Name, as it contains the NAA SCSI identifier of the disk. The objective is to remove one of these disks from the host (other columns may be hidden by right-clicking on them).

From the figure above, let us say that we wish to remove the disk containing the component residing on 10.159.16.117. That component resides on physical disk with an NAA ID string of naa.5000cca08000d99c Make a note of your NAA ID string. Next, SSH into the host with the disk to pull. Inject a hot unplug event using the vsanDiskFaultInjection.pyc python script:
[root@10.159.16.117:~] python /usr/lib/vmware/vsan/bin/vsanDiskFaultInjection.pyc –u –d naa.5000cca08000d99c
Injecting hot unplug on device vmhba2:C0:T5:L0
vsish -e set /reliability/vmkstress/ScsiPathInjectError 0x1
vsish -e set /storage/scsifw/paths/vmhba2:C0:T5:L0/injectError 0x004C0400000002
Let’s now check out the VM’s objects and components and as expected, the component that resided on that disk on host 10.159.16.117 shows up as absent:

To put the disk drive back in the host, simply rescan the host for new disks. Navigate to the [vSAN host] > Configure > Storage > Storage Adapters and click the Rescan Storage button.

Look at the list of storage devices for the NAA ID that was removed. If for some reason, the disk doesn’t return after refreshing the screen, try rescanning the host again. If it still doesn’t appear, reboot the ESXi host. Once the NAA ID is back, clear any hot unplug flags set previously with the –c option:
[root@10.159.16.117:~] python /usr/lib/vmware/vsan/bin/vsanDiskFaultInjection.pyc –c –d naa.5000cca08000d99c
Clearing errors on device vmhba2:C0:T5:L0
vsish -e set /storage/scsifw/paths/vmhba2:C0:T5:L0/injectError 0x00000
vsish -e set /reliability/vmkstress/ScsiPathInjectError 0x00000
Pull Magnetic Disk/Capacity Tier SSD and Do not Replace before Timeout Expires
In this example, we shall remove the magnetic disk from the host, once again using the vsanDiskFaultInjection.pyc script. However, this time we shall wait longer than 60 minutes before scanning the HBA for new disks. After 60 minutes, vSAN will rebuild the components on the missing disk elsewhere in the cluster.
The same process as before can now be repeated. However, this time we will leave the disk drive out for more than 60 minutes and see the rebuild activity take place. Begin by identifying the disk on which the component resides.
[root@10.159.16.117:~] date
Thu Apr 19 11:17:58 UTC 2018
[root@cs-ie-h01:~] python /usr/lib/vmware/vsan/bin/vsanDiskFaultInjection.pyc –u –d naa.5000cca08000d99c
Injecting hot unplug on device vmhba2:C0:T5:L0
vsish -e set /reliability/vmkstress/ScsiPathInjectError 0x1
vsish -e set /storage/scsifw/paths/vmhba2:C0:T5:L0/injectError 0x004C0400000002
At this point, we can once again see that the component has gone "Absent". After 60 minutes have elapsed, the component should now be rebuilt.
After 60 minutes have elapsed, the component should be rebuilt on a different disk in the cluster. That is what is observed. Note the component resides on a new disk (NAA id is different).

The removed disk can now be re-added by scanning the HBA:
Navigate to the [vSAN host] > Configure > Storage Adapters and click the Rescan Storage button.
Look at the list of storage devices for the NAA ID that was removed. If for some reason, the disk doesn’t return after refreshing the screen, try rescanning the host again. If it still doesn’t appear, reboot the ESXi host. Once the NAA ID is back, clear any hot unplug flags set previously with the –c option:
[root@10.159.16.117:~] python /usr/lib/vmware/vsan/bin/vsanDiskFaultInjection.pyc –c –d naa.5000cca08000d99c
Clearing errors on device vmhba2:C0:T5:L0
vsish -e set /storage/scsifw/paths/vmhba2:C0:T5:L0/injectError 0x00000
vsish -e set /reliability/vmkstress/ScsiPathInjectError 0x00000
Pull Cache Tier SSD and Do Not Reinsert/Replace
For the purposes of this test, we shall remove an SSD from one of the disk groups in the cluster. Navigate to the [vSAN cluster] > Configure > vSAN > Disk Management. Select a disk group from the top window and identify its SSD in the bottom window. If All-Flash, make sure it’s the Flash device in the “Cache” Disk Role. Make a note of the SSD’s NAA ID string.

In the above screenshot, we have located an SSD on host 10.159.16.116 with an NAA ID string of naa.5000cca04eb0a4b4. Next, SSH into the host with the SSD to pull. Inject a hot unplug event using the vsanDiskFaultInjection.pyc python script:
[root@10.159.16.116:~] python /usr/lib/vmware/vsan/bin/vsanDiskFaultInjection.pyc -u -d naa.5000cca04eb0a4b4
Injecting hot unplug on device vmhba2:C0:T0:L0
vsish -e set /reliability/vmkstress/ScsiPathInjectError 0x1
vsish -e set /storage/scsifw/paths/vmhba2:C0:T0:L0/injectError 0x004C0400000002
Now we observe the impact that losing an SSD (flash device) has on the whole disk group.

And finally, let’s look at the components belonging to the virtual machine. This time, any components that were residing on that disk group are "Absent".

If you search all your VMs, you will see that each VM that had a component on the disk group 10.159.16.116 now has absent components. This is expected since an SSD failure impacts the whole of the disk group.
After 60 minutes have elapsed, new components should be rebuilt in place of the absent components. If you manage to refresh at the correct moment, you should be able to observe the additional components synchronizing with the existing data.

To complete this POC, re-add the SSD logical device back to the host by rescanning the HBA:
Navigate to the [vSAN host] > Configure > Storage > Storage Adapters and click the Rescan Storage button.
Look at the list of storage devices for the NAA ID of the SSD that was removed. If for some reason, the SSD doesn’t return after refreshing the screen, try rescanning the host again. If it still doesn’t appear, reboot the ESXi host. Once the NAA ID is back, clear any hot unplug flags set previously with the –c option:
[root@10.159.16.116:~] python /usr/lib/vmware/vsan/bin/vsanDiskFaultInjection.pyc –c –d naa.5000cca04eb0a4b4
Clearing errors on device vmhba2:C0:T0:L0
vsish -e set /storage/scsifw/paths/vmhba2:C0:T0:L0/injectError 0x00000
vsish -e set /reliability/vmkstress/ScsiPathInjectError 0x00000
Warning: If you delete an SSD drive that was marked as an SSD, and a logical RAID 0 device was rebuilt as part of this test, you may have to mark the drive as an SSD once more.
Checking Rebuild/Resync Status
To display details on resyncing components, navigate to [vSAN cluster] > Monitor > vSAN > Resyncing Objects.

Injecting a Disk Error
The first step is to select a host and then select a disk that is part of a disk group on that host. The –d DEVICENAME argument requires the SCSI identifier of the disk, typically the NAA id. You might also wish to verify that this disk does indeed contain VM components. This can be done by selecting the [vSAN Cluster] > Monitor > Virtual Objects > [select VMs/Objects] > View Placement Details > Group components by host placement button.

The objects on each host can also be seen via [vSAN Cluster] > Monitor > vSAN > Physical Disks and selecting a host:

The error can only be injected from the command line of the ESXi host. To display the NAA ids of the disks on the ESXi host, you will need to SSH to the ESXi host, log in as the root user, and run the following command:
[root@10.159.16.117:~] esxcli storage core device list| grep ^naa
naa.5000cca08000ab0c
naa.5000cca04eb03560
naa.5000cca08000848c
naa.5000cca08000d99c
naa.5000cca080001b14
Once a disk has been identified, and has been verified to be part of a disk group, and that the disk contains some virtual machine components, we can go ahead and inject the error as follows:
[root@10.159.16.117:~] python /usr/lib/vmware/vsan/bin/vsanDiskFaultInjection.pyc -p -d naa.5000cca08000848c
Injecting permanent error on device vmhba2:C0:T2:L0
vsish -e set /reliability/vmkstress/ScsiPathInjectError 0x1
vsish -e set /storage/scsifw/paths/vmhba2:C0:T2:L0/injectError 0x03110300000002
Before too long, the disk should display an error and the disk group should enter an unhealthy state, as seen in [vSAN cluster] > Configure > vSAN > Disk Management

Notice that the disk group is in an "Unhealthy" state and the status of the disk is “Permanent disk failure”. This should place any components on the disk into a degraded state (which can be observed via the "Physical Placement" window and initiate an immediate rebuild of components. Navigating to [vSAN cluster] > Monitor > vSAN > Resyncing Components should reveal the components resyncing.

At this point, we can clear the error. We use the same script that was used to inject the error, but this time we provide a –c (clear) option:
[root@10.159.16.117:~] python /usr/lib/vmware/vsan/bin/vsanDiskFaultInjection.pyc -c -d naa.5000cca08000848c
vsish -e get /reliability/vmkstress/ScsiPathInjectError
vsish -e set /storage/scsifw/paths/vmhba2:C0:T2:L0/injectError 0x00000
vsish -e set /reliability/vmkstress/ScsiPathInjectError 0x00000
Note however that since the disk failed, it will have to be removed, and re-added from the disk group. This is very simple to do. Simply select the disk in the disk group and remove it by clicking on the icon highlighted below.

This will display a pop-up window regarding which action to take regarding the components on the disk. You can choose to migrate the components or not. By default, it is shown as Evacuate all data to other hosts.

For the purposes of this POC, you can select the No data evacuation option as you are adding the disk back in the next step. When the disk has been removed and re-added, the disk group will return to a healthy state. That completes the disk failure test.
When Might a Rebuild of Components Not Occur?
There are a couple of reasons why a rebuild of components might not occur. Start by looking at vSAN Health Check UI [vSAN cluster] > Monitor > vSAN > Health for any alerts indicative of failures.
You could also check specifically for resource constraints or failures through RVC as described below.
Verify that there are enough resources to rebuild components before testing with the following RVC command:
- vsan.whatif_host_failures
Of course, if you are testing with a 3-node cluster, and you introduce a host failure, there will be no rebuilding of objects. Once again, if you have the resources to create a 4-node cluster, then this is a more desirable configuration for evaluating vSAN.
Another cause of a rebuild not occurring is due to an underlying failure already present in the cluster. Verify there are none before testing with the following RVC command:
- vsan.hosts_info
- vsan.check_state
- vsan.disks_stats
If these commands reveal underlying issues (ABSENT or DEGRADED components for example), rectify these first or you risk inducing multiple failures in the cluster, resulting in inaccessible virtual machines.
PCIe Hotplug
NVMe has helped usher in all-new levels of performance capabilities for storage systems. vSphere 7 introduces a feature that meets or exceeds the capability associated with older SAS and SATA devices: Hotplug support for NVMe devices in vSphere and vSAN. This introduces a new level of flexibility and serviceability to hosts populated with NVMe devices, improving uptime by simplifying maintenance tasks around adding, removing, and relocating storage devices in hosts. Modern hosts can potentially have dozens of NVMe devices, and the benefits of hotplug most help environments large and small.
Minimum requirement:
- vSphere 7.0 or above
- Hardware support by hardware vendor (Server system)
Hotplug support for any PCIe device (network/storage card), please visit our vSAN HCL (link) to verify supportability and requires appropriate driver and firmware in order to function.
- Verify ESXi hypervisor support
PCIe option is enabled by default as a kernel option and can be verified via command line on the ESXi host:
zcat /var/log/boot.gz |grep Hotplug
Example output:TSC: 560230 cpu0:1)BootConfig: 711: enablePCIEHotplug = TRUE (1)
TSC: 563288 cpu0:1)BootConfig: 711: forceOSCGrantPCIEHotplug = FALSE (0)
TSC: 566560 cpu0:1)BootConfig: 711: enableACPIPCIeHotplug = FALSE (0)
2021-11-01T13:09:43.019Z cpu0:2097152)PCI: 209: enablePCIErrors: 0, enableValidPCIDevices: 1, pciSetBusMaster: 1, disableACSCheck: 0, disableACSCheckForRP: 1, enablePCIEHotplug: 1
2021-11-01T13:09:43.019Z cpu0:2097152)PCI: 212: pciBarAllocPolicy: 2, disablePciPassthrough: 0, enableACPIPCIeHotplug: 0
- Verify PCI-E devices and support
PCIe hotplug support requires support by the PCIe slot in order to allow the device the capability. PCI slot ID can be used to verify device and slot identifier, as an example:
dmesg|grep -I pcie|less
2020-04-10T10:28:41.113Z cpu0:131072)PCIE: 480: 0000:00:18.7: claimed by PCIe port module.2020-04-10T10:28:41.113Z cpu0:131072)PCIEHP: 1952: 0000:00:18.7: hotplug slot:0x107 has NO adapter.2020-04-10T10:28:41.114Z cpu0:131072)PCIEHP: 1837: 0000:00:18.7: Enabled HP events (0x1029) for hotplug slot:0x107“"esxcli hardware pci lis”" assists on the hardware status and identifying PCIe slot and card.
- Hot-add and Hot-removal process
Hot-add procedure
ESXi 7.0 release and above follow the standard hot plug controller process and can be categorized into two processes, surprised and planned PCIe device hot-add.
Surprise hot-add
The device is inserted into the hot-plug slot without prior notification without the Attention button or software interface (UI/CLI) mechanism.
|
Step |
User Action |
ESXi Action |
Power Indicator |
|
1 |
User selects an empty, disabled slot and inserts a PCIe device |
Platform/PCI hotplug layer detects the new additional hardware and notifies the ESXi device manger to scan for hot-added devices. |
BLINKS |
|
2 |
User waits for the slot to be enabled |
PCI bus driver enumerates the hot-added device and registers it with the vSphere device manager |
ON |
Planned hot-add
|
Step |
User Action |
ESXi Action |
Power Indicator |
|
1 |
User selects an empty, disabled slot and inserts a PCIe device |
|
OFF |
|
2 |
User presses attention button / issues software UI/CLI command to enable the slot |
In case of software interface (UI/CLI), there is no provision to aport to hot-add request, so once the command is issued control direly jumps to Step 4 In case of attention button, PCIe hotplug layer waits for ABORT INTERVAL (=5sec) |
BLINKS |
|
3 |
User cancels the operation by pressing the attention button a second time within ABORT INTERVAL |
If canceled, the Power Indicator goes back to previous state OFF |
OFF |
|
4 |
No user action in the ABORT INTERVAL |
PCIe hotplug layer validates the hot-add operation, powers the slot. On success, it notifies the ESXi device manager to scan for the hot-added device(s). in case of any failure, the Power Indicator goes back to previous state OFF |
BLINKS |
|
5 |
User waits for the slot to be enabled |
PCI bus driver enumerates the hot-added device and registers it with the ESXi device manager. |
ON |
Note: After these steps, the ESXi device manager attaches the devices to the driver and the storage stack, presents the HBA, and the associated disk(s) to the upper layer, for example vSAN/VMFS.
- Hot-remove procedure
Surprise hot-remove
In this case, the drive is removed without any prior notification through attention button or UI/CLI. If the user did not run preparatory steps, data consistency cannot be guaranteed. In the case of failed drives, the scenario is the same as abrupt removal without the preparatory steps, in which case no data consistency can be guaranteed.
|
Step |
User Action |
ESXi Action |
Power Indicator |
|
1 |
User selects an enabled slot with a PCIe device to be removed. |
ESXi executes the requested preparatory steps for the drive corresponding to this device and flags as an error if unable to perform any step. |
ON |
|
2 |
User removes the PCIe device |
Platform/PCIe hot-unplug layer detects the device removal and notifies the ESXi device manager to remove the device. In case of any failure, the Power Indicator goes OFF. |
BLINKS |
|
3 |
User waits for the slot to become disabled |
PCIe bus driver removes the device from the system and power down the PCI slot. |
OFF |
Planned hot-remove
It is expected that the user runs the preparatory steps to ensure the data consistency, before initiating hot remove operation via the attention button/software interface (UI/CLI). Even in this case, if the user does not run preparatory steps, data consistency cannot be guaranteed.
|
Step |
User Action |
ESXi Action |
Power Indicator |
|
1 |
User selects an enabled slot with a PCIe device to be removed and initiates preparatory steps. |
ESXi executes the requested preparatory steps for the drive corresponding to this PCIe device and flags an error if unable to perform any step. |
ON |
|
2 |
User presses Attention Button/issues software UI command to disable the slot |
In the case of software interface (UI/CLI), there is no provision to abort the hot-remove request, so once the command is issued, control directly jumps to Step 5. |
BLINKS |
|
3 |
User can cancel the operation by pressing the Attention Button a second time |
The Power Indicator goes back to previous state ON |
ON |
|
4 |
No user action in the ABORT INTERVAL |
PCI Bus driver removes the device from the system and power down the slot. |
OFF |
|
5 |
User waits for the slot to be disabled |
PCI Bus driver removes the device from the system and power down the slot. |
OFF |
|
6 |
User removes the PCIe device |
|
OFF |
Note: KBs:
- Supported drivers' firmware versions for I/O devices (2030818)
- vSphere and vSAN support for Hot-plug of NVMe SSDs on AMD EPYC Processors (74726)
- PCIe hotplug: ESX host may crash when PCIe NVMe device(s) surprise hot removed and hot inserted back quickly ( < 1 minute) (78390)
Air-gapped Network Failures
Air-gapped vSAN network design is built around the idea of redundant, yet completely isolated storage networks. It is used in conjunction with multiple vmknics tagged for vSAN traffic, while each vmknic is segregated on different subnets. There is physical and/or logical separation of network switches. A primary use case is to have two segregated uplink paths and non-routable VLANs to separate the IO data flow onto redundant data paths.
Note: This feature does not guarantee the load-balancing of network traffic between VMkernel ports. Its sole function is to tolerate link failure across redundant data paths.
Air-gapped vSAN Networking and Graphical Overview
The figure below shows all the vmnic uplinks per hosts, including mapped VMkernel ports that are completely separated by physical connectivity and have no communication across each data path. VMkernel ports are logically separated either by different IP segments and/or separate VLANs in different port groups.

Distributed switch configuration for the failure scenarios
With air-gapped network design, we need to place each of the two discrete IP subnets on a separate VLAN. With this in mind, we would need the two highlighted VLANs/port groups created in a standard vSwitch or distributed vSwitch as shown below before the failover testing.

Separating IP segments on different VLANs
The table below shows the detailed vmknic/portgroup settings to allow for two discrete IP subnets to reside on two separate VLANs (201 and 202). Notice each vmknic port group is configured with two uplinks and only one of which is set to active.
|
VMkernel interface tagged for vSAN traffic |
IP address segment and subnet mask |
Port group name |
VLAN ID |
Port group uplinks |
|
vmk1 |
192.168.201.0 / 255.255.255.0 |
VLAN-201-vSAN-1 |
201 |
UPLINK 1 - Active |
|
vmk2 |
192.168.202.0 / 255.255.255.0 |
VLAN-202-vSAN-2 |
202 |
UPLINK 1 - Unused |
Failover test scenario using DVS portgroup uplink priority
Before we initiate a path failover, we need to generate some background workload to maintain a steady network flow through the two VMkernel adapters. You may choose your own workload tool or simply refer to the previous section to execute an HCIbench workload.
Using the functionality in DVS, we can simulate a physical switch failure or physical link down by moving an "Active" uplink for a port group to "Unused" as shown below. This affects all vmk ports that are assigned to the port group.

Expected outcome on vSAN IO traffic failover
Prior to vSAN 6.7, when a data path is down in air-gapped network topology, VM IO traffic could pause up to 120 seconds to complete the path failover while waiting for the TCP timeout signal. Starting in vSAN 6.7, failover time improves significantly to no more than 15 seconds as vSAN proactively monitors failed data path and takes corrective action as soon as a failure is detected.
Monitoring network traffic failover
To verify the traffic failover from one vmknic to another and capture the timeout window, we can start esxtop on each ESXi host and press "n" to actively monitor host network activities before and after a failure is introduced. The screenshot below illustrates that the data path through vmk2 is down when the "Unused" state is set for the corresponding uplink and "void" status is reported for that physical uplink. TCP packet flow has suspended on that vmknic as zeroes are reported under the Mb/s transmit (TX) and receive (RX) columns.
![]()
It is expected that vSAN health check reports failed pings on vmk2 as we set the vmnic1 uplink to "Unused".

To restore the failed data path after a failover test, modify the affected uplink from "Unused" back to "Active". Network traffic should be restored through both vmknics (though not necessarily load-balanced). This completes this section of the POC guide. Before moving on to other sections, remove vmk2 on each ESXi host (as the vmknic is also used for other purposes in Stretched Cluster testing in a later section), and perform a vSAN health check and ensure all tests pass.
vSAN Management Tasks
Common management task in vSAN and how to complete them.
Maintenance Mode
In this section, we shall look at a number of management tasks, such as the behavior when placing a host into maintenance mode, and the evacuation of a disk and a disk group from a host. We will also look at how to turn on and off the identifying LED's on a disk drive.
There are a number of options available when placing a host into maintenance mode. The first step is to identify a host that has a running VM, as well as components belonging to virtual machine objects.
Select the Summary tab of the virtual machine to verify which host it is running on.

Then select the [vSAN cluster] > Monitor > Virtual Objects, then select the appropriate VM (with all components) and click View Placement Details. Selecting Group components by host placement will show which hosts have been used. Verify that there are components also residing on the same host.

From the screenshots shown here, we can see that the VM selected is running on host 10.159.17.3 and also has components residing on that host. This is the host that we shall place into maintenance mode.
Right-click on the host, select Maintenance Mode from the drop-down menu, then select the option Enter Maintenance Mode as shown here.

There are three options displays when the maintenance mode is selected:
- Full data migration
- Ensure accessibility
- No data migration

When the default option of "Ensure accessibility" is chosen, a popup is displayed regarding migrating running virtual machines. Since this is a fully automated DRS cluster, the virtual machines should be automatically migrated.

After the host has entered maintenance mode, we can now examine the state of the components that were on the local storage of this host. What you should observe is that these components are now in an “Absent” state. However, the VM remains accessible as we chose the option “Ensure Accessibility” when entering maintenance mode.

Beginning in vSAN 7U1 we introduced the RAID_D (Delta) Component. This was done to increase vSAN resiliency. When a host goes into maintenance mode the Delta component captures the latest writes to another host. When the host comes out of maintenance mode the latest writes are applied to stale components. This is used with the ensure accessibility option. This helps protect against another failure while you have a host in maintenance mode. 
The host can now be taken out of maintenance mode. Simply right click on the host as before, select Maintenance Mode > Exit Maintenance Mode.

After exiting maintenance mode, the “Absent” component becomes "Active" once more. This is assuming that the host exited maintenance mode before the vsan.ClomdRepairDelay expires (default 60 minutes).

We shall now place the host into maintenance mode once more, but this time instead of Ensure accessibility, we shall choose Full data migration. This means that although components on the host in maintenance mode will no longer be available, those components will be rebuilt elsewhere in the cluster, implying that there is full availability of the virtual machine objects.
Note: This is only possible when NumberOfFailuresToTolerate=1 and there are 4 or more hosts in the cluster. It is not possible with 3 hosts and NumberOfFailuresToTolerate=1, as another host needs to be available to rebuild the components. This is true for higher values of NumberOfFailuresToTolerate also.

Now if the VM components are monitored, you will see that no components are placed in an “Absent” state, but rather they are rebuilt on the other hosts in the cluster. When the host enters maintenance mode, you will notice that all components of the virtual machines are "Active", but none resides on the host placed into maintenance mode.

Safeguards are in place such that warnings are shown when multiple hosts are placed into maintenance mode (MM) at the same time, or a host is about to enter MM while another host is already in MM or resync activity is in progress to avoid multiple unintended outages that may cause vSAN objects to become inaccessible. The screenshot below illustrates an example of the warnings if we attempt to place host 10.159.16.116 into MM, while 10.159.16.115 had already been in MM. Simply select CANCEL to abort the decommission operation.
Ensure that you exit maintenance mode of all the hosts to restore the cluster to a fully functional state. This completes this part of the POC.
Remove and Evacuate a Disk
In this example, we show the ability to evacuate a disk prior to removing it from a disk group.
Navigate to [vSAN cluster] > Configure > vSAN > Disk Management and select a disk group in one of the hosts as shown below. Then select one of the capacity disks from the disk group, also shown below. Note that the disk icon with the red X becomes visible. This is not visible if the cluster is in automatic mode.

Make a note of the devices in the disk group, as you will need these later to rebuild the disk group. There are a number of icons on this view of disk groups in vSAN. It is worth spending some time understanding what they mean. The following table should help to explain that.
|
|
Add a disk to the selected disk group |
|
|
See the expected result of the disk or disk group evacuation |
|
|
Remove (and optionally evacuate data) from a disk in a disk group |
|
|
Turn on the locator LED on the selected disk |
|
|
Turn off the locator LED on the selected disk |


To continue with the option of removing a disk from a disk group and evacuating the data, click on the icon to remove a disk highlighted earlier. This pops up the following window, which gives you the option to Evacuate all data to other hosts (selected automatically). Click DELETE to continue:

When the operation completes, there should be one less disk in the disk group, but if you examine the components of your VMs, there should be none found to be in an “Absent” state. All components should be “Active”, and any that were originally on the disk that was evacuated should now be rebuilt elsewhere in the cluster.
Evacuate a Disk Group
Let’s repeat the previous task for the rest of the disk group. Instead of removing the original disk, let’s now remove the whole of the disk group. Make a note of the devices in the disk group, as you will need these later to rebuild the disk group.

As before, you are prompted as to whether you wish to evacuate the data from the disk group or not. The amount of data is also displayed, and the option is selected by default. Click DELETE to continue.

Once the evacuation process has completed, the disk group should no longer be visible in the "Disk Group" view.

Once again, if you examine the components of your VMs, there should be none found to be in an “Absent” state. All components should be “Active”, and any that were originally on the disk that was evacuated should now be rebuilt elsewhere in the cluster.
Add Disk Groups Back Again
At this point, we can recreate the deleted disk group. This was already covered in section 5.2 of this POC guide. Simply select the host that the disk group was removed from and click on the icon to create a new disk group. Once more, select a flash device and the two magnetic disk devices that you previously noted were members of the disk group. Click CREATE to recreate the disk group.

Turning On/Off Disk LEDs
Our final maintenance task is to turn on and off the locator LEDs on the disk drives. For turning on and off the disk locator LEDs, utility such as hpssacli is a necessity when using HP controllers. Refer to vendor documentation for information on how to locate and install this utility.
Note: This is not an issue for LSI controllers, and all necessary components are shipped with ESXi for these controllers.
The icons for turning on and off the disk locator LEDs are shown in section 10.2. To turn on a LED, select a disk in the disk group and then click on the icon highlighted below.

This will launch a task to “Turn on disk locator LEDs”. To see if the task was successful, go to the "Monitor" tab and check the "Events" view. If there is no error, the task was successful. At this point, you can also look at the data center and visually check if the LED of the disk in question is lit.
Once completed, the locator LED can be turned off by clicking on the “Turn off disk locator LEDs” as highlighted in the screenshot below. Once again, this can be visually checked in the data center if you wish.

This completes this section of the POC guide. Before moving on to other sections perform and final check and ensure that all tests pass
Lifecyle Management
Lifecycle management is a time-consuming task. It is common for admins to maintain their infrastructure with many tools that require specialized skills. VMware customers currently use two different interfaces for day two operations: vSphere Update Manager (VUM) for software and drivers and server vendor-provided utility for firmware updates. VMware HCI sets the foundation for a new, unified mechanism to update software and firmware management that is native to vSphere called vSphere Lifecycle Manager (vLCM).
vLCM is built off a desired-state model that provides lifecycle management for the hypervisor and the full stack of drivers and firmware for the servers powering your data center. vLCM can be used to apply an image, monitor the compliance, and remediate the cluster if there is a drift. This reduces the effort to monitor compliance for individual components and helps maintain a consistent state for the entire cluster in adherence to the VMware Compatibility Guide (VCG). vLCM is a powerful new approach to creating simplified consistent server lifecycle management at scale.
Beginning with vSAN 7U1 vLCM is aware of fault domains and supports both 2 node and stretched cluster deployments.
Note: Check VMware Compatibility Guide to ensure that the hardware used in the POC is supported with vSphere Lifecycle Manager(vLCM).
Using VLCM to set the desired image for a vSAN cluster
vLCM is based on a desired-state or declarative model which allows the user to define a desired image (ESXi version, drivers, firmware) and apply it to an entire vSphere or HCI cluster. Once defined and applied, all hosts in the cluster will be imaged with the desired state.
A vLCM Desired Image consists of a base ESXi image (required), vendor add-ons, and firmware and driver addons.
- Base Image: The desired ESXi version that can be pulled from vSphere depot or manually uploaded.
- Vendor Addons: Packages of vendor specified components such as firmware and drivers.
Note: Firmware and driver add-ons are not distributed through the official VMware online depot or as offline bundles available at my.vmware.com. For a given hardware vendor, firmware updates are available in a special vendor depot, whose content you access through a software module called a hardware support manager. The hardware support manager is a plug-in that registers itself as a vCenter Server extension. Each hardware vendor provides and manages a separate hardware support manager that integrates with vSphere. Consult vendor documentation based on the hardware to deploy and integrate hardware support manager appliances. As of vSAN 7U1 there are three hardware vendors supported: Dell, HP, and Lenovo.
In this section, we enable vSphere Lifecycle Manager(vLCM) to establish the desired state image for the cluster:
Click on MANAGE WITH A SINGLE IMAGE to initiate vSphere Lifecycle Manager on the cluster

You can choose to set up an image or import an existing image (such as a custom ISO), Click on SETUP IMAGE

Define Image
- Choose the appropriate ESXi Version
- (Optional) Select the relevant vendor add-ons
- (Optional) Select Firmware and Drivers Addon
- Click on VALIDATE and SAVE
Click on CHECK COMPLIANCE to check if the components in the image are compliant with the server
Click on FINISH IMAGE SETUP to complete setting the desired image to the cluster

Note: This workflow enables vLCM on the cluster and disables any VUM based updates and baselines, this process is irreversible.
vLCM using Hardware Support Manager (HSM)
In the previous section, an image was created to be used by vLCM to continuously check against and reach the desired state. However, this step only covers the configuration of the ESXi image. To fully take advantage of vLCM, repositories can be configured to obtain firmware and drivers, among others, by leveraging the vendor's HSM.
In this example, Dell OpenManage Integration for VMware vCenter (OMIVV) will be mentioned. Deploying and configuring HSM will not be covered in this guide, as this varies by vendor.
Overview of steps within HSM prior to vLCM integration (steps may vary)
- Deploy HSM appliance
- Register HSM plug-in with vCenter
- Configure hosts' credentials through a cluster profile
- Configure Repository Profile (where vLCM will get Firmware and drivers)
To configure Firmware and Drivers Addon within vLCM, follow the steps below:
In vCenter select Cluster -> Updates
Edit Image

Edit Firmware and Drivers Addon

Select the desired HSM, then select firmware and driver addon (previously created profile in HSM, and then save the image settings.

Image compliance check will initiate and the option to remediate will be available

Stretched Cluster
Design and Overview
Good working knowledge of how vSAN Stretched Cluster is designed and architected is assumed. Readers unfamiliar with the basics of vSAN Stretched Cluster are urged to review the relevant documentation before proceeding with this part of the proof-of-concept. Details on how to configure a vSAN Stretched Cluster are found in the vSAN Stretched Cluster Guide.
vSAN 7 introduces new intelligence to minimize impact due to capacity strained conditions. When an imbalance is detected, vSAN checks multiple parameters based on which it limits the IO to the capacity-constrained site and redirects active IO to the healthy site. Additionally, vSAN 7 enhances the replacement and resynchronizing logic of a vSAN Witness Host for Stretched Cluster and 2-node topologies.
With the release of vSAN 7U3 witnesses can now be shared between sites. Each witness appliance supports up to 64 clusters. Before vSAN 7U3 it was a 1-1 ratio for witness and cluster.
7.0U3 introduced LCM integration for vSAN Witness (link)
Deployment of the witness is a simple deployment of an OVF:

After deployment you need to add the witness as a new host into your datacenter; it cannot be added to a cluster. Once the host has been added you are ready to configure vSAN on your cluster.
vSAN 7.0U2 has some additional enhancements to stretched clusters. Now vSAN will:
- Prioritize I/O read locality over VM site affinity rules
- Instructs DRS not to migrate VMs to desired site until resyncs complete
- Reduces I/O across ISL (Inter-switch link/uplink) in recovery conditions which should improve read performance and free up ISL for resyncs to regain compliance
- Supports larger stretched clusters of 20+20+1

The first time you configure vSAN with a witness host you will claim the disks used by the witness, when adding additional clusters this step is skipped.


This is covered in greater detail in the vSAN Stretched Cluster Guide.
Stretched Cluster Network Topology
As per the vSAN Stretched Cluster Guide, several different network topologies are supported for vSAN Stretched Cluster. The network topology deployed in this lab environment is a full layer 3 stretched vSAN network. L3 IP routing is implemented for the vSAN network between data sites, and L3 IP routing is implemented for the vSAN network between data sites and the witness site. VMware also supports stretched L2 between the data sites. The VM network should be a stretched L2 between both data sites.
When it comes to designing stretched cluster topology, there are options to configure layer 2 (same subnet) or layer 3 (routed) connectivity between the three sites (2 active/active sites and a witness site) for different traffic types (i.e. vSAN data, witness, VM traffic) with/without Witness Traffic Separation (WTS) depending on the requirements. You may consider some of the common designs listed below. Options 1a and 1b are configurations without WTS. The only difference between them is whether L2 or L3 is deployed for vSAN data traffic. As option 2 utilizes WTS, that is the only difference compared to option 1a. For simplicity, all options use L2 for VM traffic.
In the next sections, we will cover configurations and failover scenarios using option 1a (without WTS) and option 2 (with WTS). During a POC, you may choose to test one or another, or both options if you wish.
For more information on network design best practices for the stretched cluster, refer to the vSAN Stretched Cluster Guide on core.vmware.com.
Stretched Cluster Hosts
There are four ESXi hosts in this cluster, two ESXi hosts on data site A (the “preferred” site), and two hosts on data site B (the “secondary” site). There is one disk group per host. The witness host/appliance is deployed in a 3rd remote data center. The configuration is referred to as 2+2+1.

VMs are deployed on both the “Preferred” and “Secondary” sites of the vSAN Stretched Cluster. VMs are running/active on both sites.
Below is a diagram detailing the POC environment used for the Stretched Cluster testing.

- This configuration uses L3 IP routing for the vSAN network between all sites.
- Static routes are required to enable communication between sites.
- The vSAN network VLAN for the ESXi hosts on the preferred site is VLAN 4. The gateway is 172.4.0.1.
- The vSAN network VLAN for the ESXi hosts on the secondary site is VLAN 3. The gateway is 172.3.0.1.
- The vSAN network VLAN for the witness host on the witness site is VLAN 80.
- The VM network is stretched L2 between the data sites. This is VLAN 30. Since no VMs are run on the witness, there is no need to extend this network to the third site.
Stretched Cluster Network Configuration
As per the vSAN Stretched Cluster Guide, several different network topologies are supported for vSAN Stretched Cluster. The options below provide some of the different for stretched cluster network configuration.
Option 1a:
- L3 for witness traffic (without Witness Traffic Separation)
- L2 for vSAN data traffic between 2 data sites
- L2 for VM traffic

Option 1b:
- L3 for witness traffic (without WTS)
- L3 for vSAN data traffic between 2 data sites
- L2 for VM traffic

Option 2:
- L3 for witness traffic with WTS
- L2 for vSAN data traffic between 2 data sites
- L2 for VM traffic

vSAN Stretched Cluster (Without Witness Traffic Separation) Topology and Configuration
As per the vSAN Stretched Cluster Guide, several different network topologies are supported for vSAN Stretched Cluster.
The network topology deployed in this lab environment for our POC test case is layer 2 between the vSAN data sites and L3 between data sites and witness. ESXi hosts and vCenter are in the same L2 subnet for this setup. The VM network should be a stretched L2 between both data sites as the unique IP used by the VM can remain unchanged in a failure scenario.
Stretched Cluster Hosts
There are four ESXi hosts in this cluster, two ESXi hosts on data site A (the “preferred” site) and two hosts on data site B (the “secondary” site). There is one disk group per host. The witness host/appliance is deployed in a 3rd, remote data center. The configuration is referred to as 2+2+1.


VMs are deployed on both the “Preferred” and “Secondary” sites of the vSAN Stretched Cluster. VMs are running/active on both sites.
vSAN Stretched Cluster Diagram
Below is a diagram detailing the POC environment used for the Stretched Cluster testing with L2 across Preferred and Secondary data sites.

- This configuration uses L2 across data sites for vSAN data traffic, host management, and VM traffic. L3 IP routing is implemented between the witness site and the two data sites.
- Static routes are required to enable communication between data sites and witness appliance.
- The vSAN data network VLAN for the ESXi hosts on the preferred and secondary sites is VLAN 201. The gateway is 192.168.201.162.
- The vSAN network VLAN for the witness host on the witness site is VLAN 203. The gateway is 192.168 203.162
- The VM network is stretched L2 between the data sites. This is VLAN 106. Since no production VMs are run on the witness, there is no need to extend this network to the third site.
Preferred / Secondary Site Details
In vSAN Stretched Clusters, the “preferred” site simply means the site that the witness will ‘bind’ to in the event of an inter-site link failure between the data sites. Thus, this will be the site with the majority of VM components, so this will also be the site where all VMs will run when there is an inter-site link failure between data sites.
In this example, vSAN traffic is enabled on vmk1 on the hosts on the preferred site, which is using VLAN 201. For our failure scenarios, we create two DVS port groups and add the appropriate vmkernel port to each port group to test the failover behavior in a later stage.


Static routes need to be manually configured on these hosts. This is because the default gateway is on the management network, and if the preferred site hosts tried to communicate to the secondary site hosts, the traffic would be routed via the default gateway and thus via the management network. Since the management network and the vSAN network are entirely isolated, there would be no route.
L3 routing between vSAN data sites and Witness host requires an additional static route. While default gateway is used for the Management Network on vmk0, vmk1 has no knowledge of subnet 192.168.203.0, which needs to be added manually.

Commands to Add Static Routes
The command to add static routes is as follows:
esxcli network ip route ipv4 add -g LOCAL-GATEWAY -n REMOTE-NETWORK
To add a static route from a preferred host to the witness host in this POC:
esxcli network ip route ipv4 add -g 192.168.201.162 -n 192.168.203.0/24
Note: Prior to vSAN version 6.6, multicast is required between the data sites but not to the witness site. If L3 is used between the data sites, multicast routing is also required. With the advent of vSAN 6.6, multicast is no longer needed.
Witness Site details
The witness site only contains a single host for the Stretched Cluster, and the only VM objects stored on this host are “witness” objects. No data components are stored on the witness host. In this POC, we are using the witness appliance, which is an “ESXi host running in a VM”. If you wish to use the witness appliance, it should be downloaded from VMware. This is because it is preconfigured with various settings and comes with a preinstalled license. Note that this download requires a login to My VMware.
With the release of vSAN 7U1 witnesses can now be shared between sites for 2 node deployments, and each witness appliance supports up to 64 clusters. Before vSAN 7.0U1 it was a 1-1 ratio for witness and cluster. Deployment of the witness is a simple deployment of an OVF:
After deployment you need to add the witness as a new host into your datacenter; it cannot be added to a cluster. Once the host has been added you are ready to configure vSAN on your cluster.
The first time you configure vSAN with a witness host you will claim the disks used by the witness, when adding additional clusters this step is skipped.
This is covered in greater detail in the vSAN Stretched Cluster Guide.
Alternatively, customers can use a physical ESXi host for the witness.
While two VMkernel adapters can be deployed on the Witness Appliance (vmk0 for Management and vmk1 for vSAN traffic), it is also supported to tag both vSAN and Management traffic on a single VMkernel adapter (vmk0), as we use in this case, vSAN traffic would need to be disabled on vmk1, since only one vmk has vSAN traffic enabled.


Once again, static routes should be manually configured on vSAN vmk0 to route to “Preferred site” and “Secondary Site" (VLAN 201). The image below shows the witness host routing table with static routes to remote sites.

Commands to Add Static Routes
The following command to add static routes is as follows:
esxcli network ip route ipv4 add -g LOCAL-GATEWAY -n REMOTE-NETWORK
To add a static route from the witness host to hosts on the preferred and secondary sites in this POC:
esxcli network ip route ipv4 add -g 192.168.203.162 -n 192.168.201.0/24
Note: Witness Appliance is a nested ESXi host and requires the same treatment as a standard ESXi host (i.e, patch updates). Keep all ESXi hosts in a vSAN cluster at the same update level, including the Witness appliance.
vSphere HA Settings
vSphere HA plays a critical part in Stretched Cluster. HA is required to restart virtual machines on other hosts and even the other site depending on the different failures that may occur in the cluster. The following section covers the recommended settings for vSphere HA when configuring it in a Stretched Cluster environment.
Response to Host Isolation
The recommendation is to “Power off and restart VMs” on isolation, as shown below. In cases where the virtual machine can no longer access the majority of its object components, it may not be possible to shut down the guest OS running in the virtual machine. Therefore, the “Power off and restart VMs” option is recommended.

Admission Control
If a full site fails, the desire is to have all virtual machines run on the remaining site. To allow a single data site to run all virtual machines if the other data site fails, the recommendation is to set Admission Control to 50% for CPU and Memory as shown below.

Advanced Settings
The default isolation address uses the default gateway of the management network. This will not be useful in a vSAN Stretched Cluster when the vSAN network is broken. Therefore, the default isolation response address should be turned off. This is done via the advanced setting das.usedefaultisolationaddress to false.
To deal with failures occurring on the vSAN network, VMware recommends setting at least one isolation address, which is local to each of the data sites. In this POC, we only use Stretched L2 on VLAN 201, which is reachable from the hosts on the preferred and secondary sites. Use advanced settings das.isolationaddress0 to set the isolation address for the IP gateway address to reach the witness host.

- Since 6.5 there is no need for VM anti-affinity rules or VM to host affinity rules in HA
These advanced settings are added in the Advanced Options > Configuration Parameter section of the vSphere HA UI. The other advanced settings get filled in automatically based on additional configuration steps. There is no need to add them manually.
VM Host Affinity Groups
The next step is to configure VM/Host affinity groups. This allows administrators to automatically place a virtual machine on a particular site when it is powered on. In the event of a failure, the virtual machine will remain on the same site, but placed on a different host. The virtual machine will be restarted on the remote site only when there is a catastrophic failure or a significant resource shortage.
To configure VM/Host affinity groups, the first step is to add hosts to the host groups. In this example, the Host Groups are named Preferred and Secondary, as shown below.


The next step is to add the virtual machines to the host groups. Note that these virtual machines must be created in advance.

Note that these VM/Host affinity rules are “should” rules and not “must” rules. “Should” rules mean that every attempt will be made to adhere to the affinity rules. However, if this is not possible (due lack of resources), the other site will be used for hosting the virtual machine.
Also, note that the vSphere HA rule setting is set to “should”. This means that if there is a catastrophic failure on the site to which the VM has an affinity, HA will restart the virtual machine on the other site. If this was a “must” rule, HA would not start the VM on the other site.

The same settings are necessary on both the primary VM/Host group and the secondary VM/Host group.
DRS Settings
In this POC, the partially automated mode has been chosen. However, this could be set to Fully Automated if customers wish but note that it should be changed back to partially automated when a full site failure occurs. This is to avoid failback of VMs occurring while rebuild activity is still taking place. More on this later.

vSAN Stretched Cluster Local Failure Protection
In vSAN 6.6, we build on resiliency by including local failure protection, which provides storage redundancy within each site and across sites. Local failure protection is achieved by implementing local RAID-1 mirroring or RAID-5/6 erasure coding within each site. This means that we can protect the objects against failures within a site, for example, if there is a host failure on site 1, vSAN can self-heal within site 1 without having to go to site 2 if properly configured.

Local Failure Protection in vSAN 6.6 is configured and managed through a storage policy in the vSphere Web Client. The figure below shows rules in a storage policy that is part of an all-flash stretched cluster configuration. The "Site disaster tolerance" is set to Dual site mirroring (stretched cluster), which instructs vSAN to mirror data across the two main sites of the stretched cluster. The "Failures to tolerate" specifies how data is protected within the site. In the example storage policy below, 1 failure - RAID-5 (Erasure Coding) is used, which can tolerate the loss of a host within the site.

Local failure protection within a stretched cluster further improves the resiliency of the cluster to minimize unplanned downtime. This feature also reduces or eliminates cross-site traffic in cases where components need to be resynchronized or rebuilt. vSAN lowers the total cost of ownership of a stretched cluster solution as there is no need to purchase additional hardware or software to achieve this level of resiliency.
vSAN Stretched Cluster Site Affinity
New in vSAN 6.6 flexibility improvements of storage policy-based management for stretched clusters have been made by introducing the “Affinity” rule. You can specify a single site to locate VM objects in cases where cross-site redundancy is not necessary. Common examples include applications that have built-in replication or redundancy such as Microsoft Active Directory and Oracle Real Application Clusters (RAC). This capability reduces costs by minimizing the storage and network resources used by these workloads.
Site affinity is easy to configure and manage using storage policy-based management. A storage policy is created and the Affinity rule is added to specify the site where a VM’s objects will be stored using one of these "Site disaster tolerance" options: None - keep data on Preferred (stretched cluster) or None - keep data on Non-preferred (stretched cluster).

vSAN Stretched Cluster Preferred Site Override
Preferred and secondary sites are defined during cluster creation. If it is desired to switch the roles between the two data sites, you can navigate to [vSAN cluster] > Configure > vSAN > Fault Domains, select the "Secondary" site in the right pane and click the highlighted button as shown below to switch the data site roles.

vSAN Stretched Cluster and 2 Node (Without Witness Traffic Separation)
Failover Scenarios
In this section, we will look at how to inject various network failures in a vSAN Stretched Cluster configuration. We will see how the failure manifests itself in the cluster, focusing on the vSAN health check and the alarms/events as reported in the vSphere client.
Network failover scenarios for Stretched Cluster with or without Witness Traffic separation and ROBO with/without direct connect are the same because the Witness traffic is always connected via L3.
Network failover scenarios for Stretched Cluster with or without Witness Traffic separation and ROBO with/without direct connect are the same because the Witness traffic is always connected via L3.
Scenario #1: Network Failure between Secondary Site and Witness host

Trigger the Event
To make the secondary site lose access to the witness site, one can simply remove the static route on the witness host that provides a path to the secondary site.
On secondary host(s), remove the static route to the witness host. For example:
esxcli network ip route ipv4 remove -g 192.168.201.162 -n 192.168.203.0/24
Cluster Behavior on Failure
In such a failure scenario, when the witness is isolated from one of the data sites, it implies that it cannot communicate to both the master node AND the backup node. In stretched clusters, the master node and the backup node are placed on different fault domains [sites]. This is the case in this failure scenario. Therefore, the witness becomes isolated, and the nodes on the preferred and secondary sites remain in the cluster. Let's see how this bubbles up in the UI.
To begin with, the Cluster Summary view shows one configuration issue related to "Witness host found".

This same event is visible in the [vSAN Cluster] > Monitor > Issues and Alarms > All Issues view.

Note that this event may take some time to trigger. Next, looking at the health check alarms, a number of them get triggered.

On navigating to the [vSAN Cluster] > Monitor > vSAN > Health view, there are a lot of checks showing errors.

One final place to examine is virtual machines. Navigate to [vSAN cluster] > Monitor > vSAN > Virtual Objects > View Placement Details. It should show the witness absent from the secondary site perspective. However, virtual machines should still be running and fully accessible.

Returning to the health check, selecting Data > vSAN object health, you can see the error 'Reduced availability with no rebuild - delay timer'

Conclusion
The loss of the witness does not impact the running virtual machines on the secondary site. There is still a quorum of components available per object, available from the data sites. Since there is only a single witness host/site, and only three fault domains, there is no rebuilding/resyncing of objects.
Repair the Failure
Add back the static routes that were removed earlier and rerun the health check tests. Verify that all tests are passing before proceeding. Remember to test one thing at a time.
Scenario #2: Network Failure between Preferred Site and Witness host

Trigger the Event
To make the preferred site lose access to the witness site, one can simply remove the static route on the witness host that provides a path to the preferred site.
On preferred host(s), remove the static route to the witness host. For example:
esxcli network ip route ipv4 remove –g 192.168.201.162 –n 192.168.203.0/24
Cluster Behavior on Failure
As per the previous test, this results in the same partitioning as before. The witness becomes isolated, and the nodes in both data sites remain in the cluster. It may take some time for alarms to trigger when this event occurs. However, the events are similar to those seen previously.

One can also see various health checks fail, and their associated alarms being raised.

Just like the previous test, the witness component goes absent.


This health check behavior appears whenever components go ‘absent’ and vSAN is waiting for the 60-minute clomd timer to expire before starting any rebuilds. If an administrator clicks on “Repair Objects Immediately”, the objects switch state and now the objects are no longer waiting on the timer and will start to rebuild immediately under general circumstances. However, in this POC, with only three fault domains and no place to rebuild witness components, there is no syncing/rebuilding.
Conclusion
Just like the previous test, a witness failure has no impact on the running virtual machines on the preferred site. There is still a quorum of components available per object, as the data sites can still communicate. Since there is only a single witness host/site, and only three fault domains, there is no rebuilding/resyncing of objects.
Repair the Failure
Add back the static routes that were removed earlier and rerun the health check tests. Verify that all tests are passing before proceeding. Remember to test one thing at a time.
Scenario #3: Network Failure from both Data sites to Witness host

Trigger the Event
To introduce a network failure between the preferred and secondary data sites and the witness site, we remove the static route on each preferred/secondary host to the Witness host. The same behavior can be achieved by shutting down the Witness Host temporarily.
On Preferred / Secondary host(s), remove the static route to the witness host. For example:
esxcli network ip route ipv4 remove -g 192.168.201.162 -n 192.168.203.0/24
Cluster Behavior on Failure
The events observed are for the most part identical to those observed in failure scenarios #1 and #2.
Conclusion
When the vSAN network fails between the witness site and both the data sites (as in the witness site fully losing its WAN access), it does not impact the running virtual machines. There is still a quorum of components available per object, available from the data sites. However, as explained previously, since there is only a single witness host/site, and only three fault domains, there is no rebuilding/resyncing of objects.
Repair the Failure
Add back the static routes that were removed earlier and rerun the health check tests. Verify that all tests are passing. Remember to test one thing at a time.
Scenario #4: Network Failure (Data and Witness Traffic) in Secondary site

Trigger the Event
To introduce a network failure on the secondary data site we require to disable network flow on vSAN vmk1, as both vSAN data and witness traffic are served over this single VMkernel port.
Initially we created two Port groups but only place host 23/24 named "VLAN201-vSAN-Secondary", host 21/22 on the preferred site using "VLAN201-vSAN-Preferred".
1) On secondary host(s), remove the static route to the witness host. For example:
esxcli network ip route ipv4 remove –g 192.168.201.162 –n 192.168.203.0/24
During failure scenario, using the DVS (can be also standard vSwitch) capability, place the "active" Uplink 1 to "Unused" via "Teaming and failover" policy in the Portgroup "VLAN201-vSAN-Secondary":

Cluster Behavior on Failure
To begin with, the Cluster Summary view shows the "HA host status" error which is expected in vSAN as in our case vmk1 is used for HA.

All VMs from the secondary data site will be restarted via HA on the Preferred data site

vSAN Health Service will show errors, such as "vSAN cluster partition" which is expected as one full site was failed.
Verify on each host or via [vSAN cluster] -> VMs if all VMs were restarted on the preferred site. Adding the "Host" column will show if the VMs are now started on the preferred site.


Conclusion
When the vSAN network fails in one of the data sites, it does not impact the running virtual machines on the available data site because the quorum exists. VMs on the not available data site will be restarted via HA on the available data site. However, as explained previously, since there is only a single witness host/site, and only three fault domains, there is no rebuilding/resyncing of objects.
Note: DRS is set to "Partial Automatic" and if the "Uplink 1" is changed from "Unused" back to "Active" the VMs won't automatically be restarted on the secondary site again. DRS in "Fully Automated" mode will move the VMs via vMotion back to their recommended site as configured earlier via VM/Host Groups and Rules.
Repair the Failure
Change the Uplink 1 from "Unused" back to "Active" on the DVS Portgroup and verify that all tests are passing. Remember to test one thing at a time.
Scenario #5; Network Failure (Data and Witness Traffic) in Preferred site

Trigger the Event
To introduce a network failure on the preferred data site we require to disable network flow on vSAN vmk1. as both vSAN data and witness traffic are served over this single VMkernel port.
Initially, we created two Portgroups but only place host .23/.24 named "VLAN201-vSAN-Secondary", host .21/.22 on the preferred site using "VLAN201-vSAN-Preferred".
1) On preferred host(s), remove the static route to the witness host. For example:
esxcli network ip route ipv4 remove –g 192.168.201.162 –n 192.168.203.0/24
2) During failure scenario, using the DVS (can be also standard vSwitch) capability, place the "active" Uplink 1 to "Unused" via "Teaming and failover" policy in the Portgroup "VLAN201-vSAN-Preferred":

Cluster Behavior on Failure
To begin with, the Cluster Summary view shows the "HA host status" error which is expected in vSAN as in our case vmk1 is used for HA. Quorum is formed on the Secondary site with the


vSAN Health Service will show errors such as "vSAN cluster partition" which is expected as one full site was failed.
Verify on each host or via [vSAN cluster] -> VMs if all VMs were restarted on the secondary site. Adding the "Host" column will show if the VMs are now started on the secondary site.

Conclusion
When the vSAN network fails in one of the data sites, it does not impact the running virtual machines on the available data site because the quorum exists. VMs on the not available data site will be restarted via HA on the available data site. However, as explained previously, since there is only a single witness host/site, and only three fault domains, there is no rebuilding/resyncing of objects.
Note: DRS is set to "Partial Automatic" and if the "Uplink 1" is changed from "Unused" back to "Active" the VMs won't automatically be restarted on the secondary site again. DRS in "Fully Automated" mode will move the VMs via vMotion back to their recommended site as configured earlier via VM/Host Groups and Rules.
Repair the Failure
Change the Uplink 1 from "Unused" back to "Active" on the DVS Portgroup and verify that all tests are passing. Remember to test one thing at a time.
Scenario #6: Network Failure between both Data Sites but Witness Host still accessible

Trigger the Event
Link failure between preferred and secondary data sites simulates a datacenter link failure while Witness Traffic remains up and running (i.e. router/firewall are still accessible to reach the Witness host).
To trigger the failure scenario, we can either disable the network link between both data centers physically or use the DVS traffic filter function in the POC. In this scenario, we require to have each link active and the static route(s) need to be intact.
Note: This IP filter functionality only exists in DVS. The use of IP filter is only practical with few hosts as separate rules need to be created between each source and destination hosts.

Create filter rule by using "ADD" for each host per site and in our 2+2+1 setup, four filter rules we create as followed, to simulate an IP flow disconnect between preferred and secondary sites:

Note: Verify the settings as highlighted above, especially the protocol is set to "any" to ensure no traffic of any kind is flowing between host .21/22 and .23/24.
Enable the newly created DVS filters:

Cluster Behavior on Failure
The events observed are similar and through the create IP filter policies we discover a cluster partition, which is expected. HA will restart all VMs from the secondary site to the preferred site.

VMs are restarted by HA on preferred site:

Conclusion
In the failure scenario, if the data link between data centers is disrupted, HA will start the VMs on the preferred site. There is still a quorum of components available per object, available from the data sites. However, as explained previously, since there is only a single witness host/site, and only three fault domains, there is no rebuilding/resyncing of objects.
Repair the Failure
Disable the DVS filter rules and rerun the health check tests. Verify that all tests are passing. Remember to test one thing at a time.
Stretched Cluster with WTS Configuration
Starting with vSphere 6.7, several new vSAN features were included. One of the features expands the vSAN Stretched Cluster configuration by adding the Witness traffic separation functionality.
A good working knowledge of how vSAN Stretched Cluster is designed and architected is assumed. Readers unfamiliar with the basics of vSAN Stretched Cluster are urged to review the relevant documentation before proceeding with this part of the proof-of-concept. Details on how to configure a vSAN Stretched Cluster are found in the vSAN Stretched Cluster Guide .
Stretched Cluster Network Topology
As per the vSAN Stretched Cluster Guide, several different network topologies are supported for vSAN Stretched Cluster.
The network topology deployed in this lab environment for our POC test case is layer 2 between the vSAN data sites and L3 between data sites and witness. ESXi hosts and vCenter are in the same L2 subnet for this setup. The VM network should be a stretched L2 between both data sites as the unique IP used by the VM can remain unchanged in a failure scenario.
With WTS, we leave Management vmk0 and vSAN enabled vmk1 unchanged, while adding vmk2 to all hosts on data sites to isolate witness traffic on vmk2. In vSAN ROBO with WTS, vmk0 is used for Witness Traffic and vmk1 for vSAN Data in a direct connect scenario.
Stretched Cluster Hosts with WTS
There are four ESXi hosts in this cluster, two ESXi hosts on data site A (the “preferred” site) and two hosts on data site B (the “secondary” site). There is one disk group per host. The witness host/appliance is deployed in a 3rd, remote data center. The configuration is referred to as 2+2+1.
VMs are deployed on both the “Preferred” and “Secondary” sites of the vSAN Stretched Cluster. VMs are running/active on both sites.
vSAN Stretched Cluster with WTS Diagram
Below is a diagram detailing the POC environment used for the Stretched Cluster testing with L2 across Preferred and Secondary data sites. vmk2 is added to expand the functionality for WTS.

- This configuration uses L2 across data sites for vSAN data traffic, host management and VM traffic. L3 IP routing is implemented between the witness site and the two data sites.
- Static routes are required to enable communication between data sites and witness appliance.
- The vSAN data network VLAN for the ESXi hosts on the preferred and secondary sites is VLAN 201 in pure L2 configuration
- The vSAN network VLAN for the witness host on the witness site is VLAN 203. The gateway is 192.168 203.162
- The WTS uses VLAN205, L3 routed to Witness Host.
- The VM network is stretched L2 between the data sites. This is VLAN 106. Since no production VMs are run on the witness, there is no need to extend this network to the third site.
Preferred / Secondary Site Details
In vSAN Stretched Clusters, “preferred” site simply means the site that the witness will ‘bind’ to in the event of an inter-site link failure between the data sites. Thus, this will be the site with the majority of VM components, so this will also be the site where all VMs will run when there is an inter-site link failure between data sites.
In this example, vSAN traffic is enabled on vmk1 on the hosts on the preferred site, which is using VLAN 201. For our failure scenarios, we create two DVS port groups and add the appropriate vmkernel port to each port group to test the failover behavior in a later stage.

vmk2 is configured as a VMkernel port without any services assigned and will be tagged for witness traffic using command line. Only vmk1 for vSAN Data Traffic is tagged for vSAN.

Commands to configured vmk port for WTS
The command to tag a VMkernel port for WTS is as follows:
esxcli vsan network ipv4 add -i vmkX -T=witness
To tag vmk2 for WTS on each of the POC hosts .21-24:
esxcli vsan network ipv4 add -i vmk2 -T=witness
Upon successful execution of the command, vSAN Witness traffic should be tagged for vmk2 in the UI as shown below.

Static routes need to be manually configured on these hosts. This is because the default gateway is on the management network, and if the preferred site hosts tried to communicate to the secondary site hosts, the traffic would be routed via the default gateway and thus via the management network. Since the management network and the vSAN network are entirely isolated, there would be no route.
L3 routing between vSAN data sites and Witness host requires an additional static route. While default gateway is used for the Management Network on vmk0, vmk2 has no knowledge of subnet 192.168.203.0, which needs to be added manually.

Commands to Add Static Routes
The following command is used to add static routes is as follows:
esxcli network ip route ipv4 add -g LOCAL-GATEWAY -n REMOTE-NETWORK
To add a static route from a preferred host to the witness host in this POC:
esxcli network ip route ipv4 add -g 192.168.205.162 -n 192.168.203.0/24
Note: Prior to vSAN version 6.6, multicast is required between the data sites but not to the witness site. If L3 is used between the data sites, multicast routing is also required. With the advent of vSAN 6.6, multicast is no longer needed.
Witness Site details
The witness site only contains a single host for the Stretched Cluster, and the only VM objects stored on this host are “witness” objects. No data components are stored on the witness host. In this POC, we are using the witness appliance, which is an “ESXi host running in a VM”. If you wish to use the witness appliance, it should be downloaded from VMware. This is because it is preconfigured with various settings, and comes with a preinstalled license. Note that this download requires a login to My VMware.
With the release of vSAN 7U1 witnesses can now be shared between sites for 2 node deployments, and each witness appliance supports up to 64 clusters. Before vSAN 7.0U1 it was a 1-1 ratio for witness and cluster. Deployment of the witness is a simple deployment of an OVF:
After deployment you need to add the witness as a new host into your datacenter; it cannot be added to a cluster. Once the host has been added you are ready to configure vSAN on your cluster.
The first time you configure vSAN with a witness host you will claim the disks used by the witness, when adding additional clusters this step is skipped.
Alternatively, customers can use a physical ESXi host for the witness.
While two VMkernel adapters can be deployed on the Witness Appliance (vmk0 for Management and vmk1 for vSAN traffic), it is also supported to tag both vSAN and Management traffic on a single VMkernel adapter (vmk0), as we use in this case, vSAN traffic would need to be disabled on vmk1, since only one vmk has vSAN traffic enabled.
Note: In our POC example we add a manual route for completeness and it is not required if the default gateway can reach the Witness separation subnet on the host data sites.
Once again, static routes should be manually configured on vSAN vmk0 to route to “Preferred site” and “Secondary Site" Witness Traffic (VLAN 205). The image below shows the witness host routing table with static routes to remote sites.

Commands to Add Static Routes
The following command to add static routes is as follows:
esxcli network ip route ipv4 add -g LOCAL-GATEWAY -n REMOTE-NETWORK
To add a static route from the witness host to hosts on the preferred and secondary sites in this POC:
esxcli network ip route ipv4 add -g 192.168.203.162 -n 192.168.205.0/24
Note: Witness Appliance is a nested ESXi host and requires the same treatment as a standard ESXi host (i.e, patch updates). Keep all ESXi hosts in a vSAN cluster at the same update level, including the Witness appliance.
To confirm if the new static route and gateway function properly to reach the Witness host subnet 192.168.203.0/24 via vmk2, navigate to vSAN Health service and verify that all tests show “green” status. 
Witness Traffic Separation is established, and this type of traffic can communicate between VLAN 205 and VLAN 203. Only VLAN 201 serves vSAN data IO traffic across both data sites.
vSphere HA Settings
vSphere HA plays a critical part in Stretched Cluster. HA is required to restart virtual machines on other hosts and even the other site depending on the different failures that may occur in the cluster. The following section covers the recommended settings for vSphere HA when configuring it in a Stretched Cluster environment.
Response to Host Isolation
The recommendation is to “Power off and restart VMs” on isolation, as shown below. In cases where the virtual machine can no longer access the majority of its object components, it may not be possible to shut down the guest OS running in the virtual machine. Therefore, the “Power off and restart VMs” option is recommended.
Admission Control
If a full site fails, the desire is to have all virtual machines run on the remaining site. To allow a single data site to run all virtual machines if the other data site fails, the recommendation is to set Admission Control to 50% for CPU and Memory as shown below.
Advanced Settings
The default isolation address uses the default gateway of the management network. This will not be useful in a vSAN Stretched Cluster, when the vSAN network is broken. Therefore, the default isolation response address should be turned off. This is done via the advanced setting das.usedefaultisolationaddress to false.
To deal with failures occurring on the vSAN network, VMware recommends setting at least one isolation address, which is local to each of the data sites. In this POC, we only use Stretched L2 on VLAN 201, which is reachable from the hosts on the preferred and secondary sites. Use advanced settings das.isolationaddress0 to set the isolation address for the IP gateway address to reach the witness host.

- Since 6.5 there is no need for VM anti-affinity rules or VM to host affinity rules in HA
These advanced settings are added in the Advanced Options > Configuration Parameter section of the vSphere HA UI. The other advanced settings get filled in automatically based on additional configuration steps. There is no need to add them manually.
VM Host Affinity Groups
The next step is to configure VM/Host affinity groups. This allows administrators to automatically place a virtual machine on a particular site when it is powered on. In the event of a failure, the virtual machine will remain on the same site, but placed on a different host. The virtual machine will be restarted on the remote site only when there is a catastrophic failure or a significant resource shortage.
To configure VM/Host affinity groups, the first step is to add hosts to the host groups. In this example, the Host Groups are named Preferred and Secondary, as shown below.
The next step is to add the virtual machines to the host groups. Note that these virtual machines must be created in advance.
Note that these VM/Host affinity rules are “should” rules and not “must” rules. “Should” rules mean that every attempt will be made to adhere to the affinity rules. However, if this is not possible (due lack of resources), the other site will be used for hosting the virtual machine.
Also, note that the vSphere HA rule setting is set to “should”. This means that if there is a catastrophic failure on the site to which the VM has an affinity, HA will restart the virtual machine on the other site. If this was a “must” rule, HA would not start the VM on the other site.
The same settings are necessary on both the primary VM/Host group and the secondary VM/Host group.
DRS Settings
In this POC, the partially automated mode has been chosen. However, this could be set to Fully Automated if customers wish but note that it should be changed back to partially automated when a full site failure occurs. This is to avoid failback of VMs occurring while rebuild activity is still taking place. More on this later.
vSAN Stretched Cluster Local Failure Protection
In vSAN 6.6, we build on resiliency by including local failure protection, which provides storage redundancy within each site and across sites. Local failure protection is achieved by implementing local RAID-1 mirroring or RAID-5/6 erasure coding within each site. This means that we can protect the objects against failures within a site, for example, if there is a host failure on site 1, vSAN can self-heal within site 1 without having to go to site 2 if properly configured.
Local Failure Protection in vSAN 6.6 is configured and managed through a storage policy in the vSphere Web Client. The figure below shows rules in a storage policy that is part of an all-flash stretched cluster configuration. The "Site disaster tolerance" is set to Dual site mirroring (stretched cluster), which instructs vSAN to mirror data across the two main sites of the stretched cluster. The "Failures to tolerate" specifies how data is protected within the site. In the example storage policy below, 1 failiure - RAID-5 (Erasure Coding) is used, which can tolerate the loss of a host within the site.
Local failure protection within a stretched cluster further improves the resiliency of the cluster to minimize unplanned downtime. This feature also reduces or eliminates cross-site traffic in cases where components need to be resynchronized or rebuilt. vSAN lowers the total cost of ownership of a stretched cluster solution as there is no need to purchase additional hardware or software to achieve this level of resiliency.
vSAN Stretched Cluster Site Affinity
New in vSAN 6.6 flexibility improvements of storage policy-based management for stretched clusters have been made by introducing the “Affinity” rule. You can specify a single site to locate VM objects in cases where cross-site redundancy is not necessary. Common examples include applications that have built-in replication or redundancy such as Microsoft Active Directory and Oracle Real Application Clusters (RAC). This capability reduces costs by minimizing the storage and network resources used by these workloads.
Site affinity is easy to configure and manage using storage policy-based management. A storage policy is created and the Affinity rule is added to specify the site where a VM’s objects will be stored using one of these "Failures to tolerate" options: None - keep data on Preferred (stretched cluster) or None - keep data on Non-preferred (stretched cluster) .
vSAN Stretched Cluster Preferred Site Override
Preferred and secondary sites are defined during cluster creation. If it is desired to switch the roles between the two data sites, you can navigate to [vSAN cluster] > Configure > vSAN > Fault Domains, select the "Secondary" site in the right pane and click the highlighted button as shown below to switch the data site roles.
Stretched Cluster with WTS Failover Scenarios
In this section, we will look at how to inject various network failures in a vSAN Stretched Cluster configuration. We will see how the failure manifests itself in the cluster, focusing on the vSAN health check and the alarms/events as reported in the vSphere client.
Network failover scenarios for Stretched Cluster with or without Witness Traffic separation and ROBO with/without direct connect are the same because the Witness traffic is always connected via L3.
Scenario #1: Network Failure between Secondary Site and Witness host

Trigger the Event
To make the secondary host lose access to the witness site, remove the static route on the ESXi host, which provides the IP path to the secondary site.
On secondary host(s), remove the static route to the witness host. For example:
esxcli network ip route ipv4 remove -g 192.168.201.162 -n 192.168.203.0/24
Cluster Behavior on Failure
In such a failure scenario, when the witness is isolated from one of the data sites, it implies that it cannot communicate to both the master node AND the backup node. In stretched clusters, the master node and the backup node are placed on different fault domains [sites]. This is the case in this failure scenario. Therefore, the witness becomes isolated, and the nodes on the preferred and secondary sites remain in the cluster. Let's see how this bubbles up in the UI.
To begin with, the Cluster Summary view shows one configuration issue related to "Witness host found".
This same event is visible in the [vSAN Cluster] > Monitor > Issues and Alarms > All Issues view.
Note that this event may take some time to trigger. Next, looking at the health check alarms, a number of them get triggered.
On navigating to the [vSAN Cluster] > Monitor > vSAN > Health view, there are a lot of checks showing errors.
One final place to examine is virtual machines. Navigate to [vSAN cluster] > Monitor > vSAN > Virtual Objects > View Placement Details. It should show the witness absent from the secondary site perspective. However, virtual machines should still be running and fully accessible.
Returning to the health check, selecting Data > vSAN object health, you can see the error 'Reduced availability with no rebuild - delay timer'
Conclusion
The loss of the witness does not impact the running virtual machines on the secondary site. There is still a quorum of components available per object, available from the data sites. Since there is only a single witness host/site, and only three fault domains, there is no rebuilding/resyncing of objects.
Repair the Failure
Add back the static routes that were removed earlier and rerun the health check tests. Verify that all tests are passing before proceeding. Remember to test one thing at a time.
Scenario #2: Network Failure between Preferred Site and Witness host

Trigger the Event
To make the preferred site lose access to the witness site, one can simply remove the static route on the witness host that provides a path to the preferred site.
On preferred host(s), remove the static route to the witness host. For example:
esxcli network ip route ipv4 remove –g 192.168.201.162 –n 192.168.203.0/24
Cluster Behavior on Failure
As per the previous test, this results in the same partitioning as before. The witness becomes isolated, and the nodes in both data sites remain in the cluster. It may take some time for alarms to trigger when this event occurs. However, the events are similar to those seen previously.
One can also see various health checks fail, and their associated alarms being raised.
Just like the previous test, the witness component goes absent.

This health check behavior appears whenever components go ‘absent’ and vSAN is waiting for the 60-minute clomd timer to expire before starting any rebuilds. If an administrator clicks on “Repair Objects Immediately”, the objects switch state and now the objects are no longer waiting on the timer and will start to rebuild immediately under general circumstances. However, in this POC, with only three fault domains and no place to rebuild witness components, there is no syncing/rebuilding.
Conclusion
Just like the previous test, a witness failure has no impact on the running virtual machines on the preferred site. There is still a quorum of components available per object, as the data sites can still communicate. Since there is only a single witness host/site, and only three fault domains, there is no rebuilding/resyncing of objects.
Repair the Failure
Add back the static routes that were removed earlier and rerun the health check tests. Verify that all tests are passing before proceeding. Remember to test one thing at a time.
Scenario #3: Network Failure from both Data sites to Witness host

Trigger the Event
To introduce a network failure between the preferred and secondary data sites and the witness site, we remove the static route on each preferred/secondary host to the Witness host. The same behavior can be achieved by shutting down the Witness Host temporarily.
On Preferred / Secondary host(s), remove the static route to the witness host. For example:
esxcli network ip route ipv4 remove -g 192.168.201.162 -n 192.168.203.0/24
Cluster Behavior on Failure
The events observed are for the most part identical to those observed in failure scenarios #1 and #2.
Conclusion
When the vSAN network fails between the witness site and both the data sites (as in the witness site fully losing its WAN access), it does not impact the running virtual machines. There is still a quorum of components available per object, available from the data sites. However, as explained previously, since there is only a single witness host/site, and only three fault domains, there is no rebuilding/resyncing of objects.
Repair the Failure
Add back the static routes that were removed earlier and rerun the health check tests. Verify that all tests are passing. Remember to test one thing at a time.
Scenario #4: Network Failure (Data and Witness Traffic) in Secondary site

Trigger the Event
To introduce a network failure on the secondary data site we require to disable network flow on vSAN vmk1. as both vSAN data and witness traffic are served over this single VMkernel port.
Initially we created two Port groups but only place host 23/24 named "VLAN201-vSAN-Secondary", host 21/22 on the preferred site using "VLAN201-vSAN-Preferred".
1) On secondary host(s), remove the static route to the witness host. For example:
esxcli network ip route ipv4 remove –g 192.168.201.162 –n 192.168.203.0/24
2) During failure scenario, using the DVS (can be also standard vSwitch) capability, place the "active" Uplink 1 to "Unused" via "Teaming and failover" policy in the Portgroup "VLAN201-vSAN-Secondary":
Cluster Behavior on Failure
To begin with, the Cluster Summary view shows the "HA host status" error which is expected in vSAN as in our case vmk1 is used for HA.
All VMs from the secondary data site will be restarted via HA on the Preferred data site
vSAN Health Service will show errors, such as "vSAN cluster partition" which is expected as one full site was failed.
Verify on each host or via [vSAN cluster] -> VMs if all VMs were restarted on the preferred site. Adding the "Host" column will show if the VMs are now started on the preferred site.
Conclusion
When the vSAN network fails in one of the data sites, it does not impact the running virtual machines on the available data site because the quorum exists. VMs on the not available data site will be restarted via HA on the available data site. However, as explained previously, since there is only a single witness host/site, and only three fault domains, there is no rebuilding/resyncing of objects.
Note: DRS is set to "Partial Automatic" and if the "Uplink 1" is changed from "Unused" back to "Active" the VMs won't automatically be restarted on the secondary site again. DRS in "Fully Automated" mode will move the VMs via vMotion back to their recommended site as configured earlier via VM/Host Groups and Rules.
Repair the Failure
Change the Uplink 1 from "Unused" back to "Active" on the DVS Portgroup and verify that all tests are passing. Remember to test one thing at a time.
Scenario #5: Network Failure (Data and Witness Traffic) in Preferred site

Trigger the Event
To introduce a network failure on the preferred data site we require to disable network flow on vSAN vmk. as both vSAN data and witness traffic are serviced over this single vmk kernel port.
Initially, we created two Port groups but only place host .23/.24 named "VLAN201-vSAN-Secondary", host .21/.22 on the preferred site using "VLAN201-vSAN-Preferred".
1) On preferred host(s), remove the static route to the witness host. For example:
esxcli network ip route ipv4 remove –g 192.168.201.162 –n 192.168.203.0/24
2) During failure scenario, using the DVS (can be also standard vSwitch) capability, place the "active" Uplink 1 to "Unused" via "Teaming and failover" policy in the Portgroup "VLAN201-vSAN-Preferred":
Cluster Behavior on Failure
To begin with, the Cluster Summary view shows the "HA host status" error which is expected in vSAN as in our case vmk1 is used for HA. Quorum is formed on the Secondary site with the
vSAN Health Service will show errors, such as "vSAN cluster partition" which is expected as one full site was failed.
Verify on each host or via [vSAN cluster] -> VMs if all VMs were restarted on the secondary site. Adding the "Host" column to show if the VMs are now started on the secondary site.
Conclusion
When the vSAN network fails in one of the data sites, it does not impact the running virtual machines on the available data site because the quorum exists. VMs on the not available data site will be restarted via HA on the available data site. However, as explained previously, since there is only a single witness host/site, and only three fault domains, there is no rebuilding/resyncing of objects.
Note: DRS is set to "Partial Automatic" and if the "Uplink 1" is changed from "Unused" back to "Active" the VMs won't automatically be restarted on the secondary site again. DRS in "Fully Automated" mode will move the VMs via vMotion back to their recommended site as configured earlier via VM/Host Groups and Rules.
Repair the Failure
Change the Uplink 1 from "Unused" back to "Active" on the DVS Portgroup and verify that all tests are passing. Remember to test one thing at a time.
Scenario #6: Network Failure between both Data Sites, Witness host accessible via WTS

Trigger the Event
Link failure between preferred and secondary data sites simulates a datacenter link failure while Witness Traffic remains up and running (i.e. router/firewall are still accessible to reach the Witness host).
To trigger the failure scenario, we can either disable the network link between both data centers physically or use the DVS traffic filter function in the POC. In this scenario, we require to have each link active and the static route(s) need to be intact.
Note: This IP filter functionality only exists in DVS. The use of IP filter is only practical with few hosts as separate rules need to be created between each source and destination hosts.
Create filter rule by using "ADD" for each host per site and in our 2+2+1 setup, four filter rules we create as followed, to simulate an IP flow disconnect between preferred and secondary sites:
Note: Verify the settings as highlighted above, especially the protocol is set to "any" to ensure no traffic of any kind is flowing between host .21/22 and .23/24.
Enable the newly created DVS filters:
Cluster Behavior on Failure
The events observed are similar and through the create IP filter policies we discover a cluster partition, which is expected. HA will restart all VMs from the secondary site to the preferred site.
VMs are restarted by HA on preferred site:
Conclusion
In the failure scenario, if the data link between data centers is disrupted, HA will start the VMs on the preferred site. There is still a quorum of components available per object, available from the data sites. However, as explained previously, since there is only a single witness host/site, and only three fault domains, there is no rebuilding/resyncing of objects.
Repair the Failure
Disable the DVS filter rules and rerun the health check tests. Verify that all tests are passing. Remember to test one thing at a time.
vSAN Space Efficiency Features
Compression
Beginning with vSphere 7U1, vSAN now supports “Compression Only”. Compression is applied directly at the cluster-level and implemented per disk group. The compression algorithm will take a 4K block and try to compress it to 2KB or less. If this is successful, the compressed block is then written to the capacity tier. If the compression algorithm cannot compress the block by this amount, the full 4KB will be written to the capacity tier.
Deduplication and Compression
In addition to just compressing the data, further savings may be achieved with deduplication. When data is destaged from the cache to capacity tier, vSAN will check to see if a match for that block exists. If true, vSAN does not write an additional copy of the block, and metadata is updated. However, if the block does not exist, vSAN will attempt to compress the block.
To demonstrate the effects of Deduplication and Compression, this exercise shows the capacity after deploying a set of identical virtual machines. Before starting this exercise, ensure that the Deduplication and Compression service is enabled on the cluster. Note that when enabling the Deduplication and Compression service, vSAN will go through a rolling update process: vSAN will evacuate data from each disk group in turn and the disk group will be reconfigured with the features enabled. Depending on the number of disk groups on each host and the amount of data, this can be a lengthy process.
To enable Deduplication and Compression complete the following steps:
Navigate to [vSAN Cluster] > Configure > vSAN > Services, then select the top EDIT button that corresponds to the Deduplication and compression service:

Toggle Compression only or Deduplication and Compression and select APPLY:

Once the process of enabling Compression Only or Deduplication and Compression is complete, we can upload HCIbench, which can then be used to create 32 identical VMs. Before deploying the VMs, we can see the capacity used by navigating to [vSAN Cluster] > Monitor > Capacity:

We can see here that we have around 2TB of savings with a ratio of 1.9x.
For the next part of the exercise, we will use HCIbench to create the 32 VMs, each with 2x100GB VMDKs. For the first test, we will zero the disks on the VMs and observe the results:


As expected, because the disks are zeroed, the data is highly compressible. Our compression ratio is not an impressive 4.36x.
Next, we create an FIO profile with 100% writes over the whole VMDK, with 50% random data:

Again, as expected, as we now have 50% random data on the disks, the deduplication and compression savings reduce to 3.2x:

In our final test, we use 100% random data. Additionally, we set the object space reservation to 100%:

We create a new FIO profile, as above, but now with 100% random data:

As expected, the savings we now have are much reduced - down to 1.12x:

RAID-5/RAID-6 Erasure Coding
With erasure coding, instead of the 2x or 3x overhead (FTT = 1 or 2) with traditional RAID-1, RAID-5 requires only 33% additional storage, and RAID-6 requires only 50% additional overhead.
To support RAID-5 and RAID-6, the following host requirements must be met:
- RAID-5: minimum of four hosts, with a 3+1 configuration (3 data blocks and 1 parity block per stripe).
- RAID-6: minimum of six hosts, with a 4+2 configuration (4 data blocks and 2 parity blocks per stripe).
RAID-5/6 Erasure Coding levels are made available via Storage Policy-Based Management (SPBM). In the following exercise, we will enable RAID-5 by creating a new storage policy and applying that storage policy to a virtual machine.
Open the VM Storage Policies window in vCenter: Menu > Policies and Profiles > VM Storage Policies:

Next, navigate to 'VM Storage Policies' and 'Create VM Storage Policy':

Select the appropriate vCenter Server and create a name:

Ensure 'Enable rules for "vSAN" storage' is checked:

Select 'standard cluster' from the 'Site disaster tolerance' drop-down:

We see that the vSAN datastore is compatible with this policy:

Finally, review and click 'Finish':

Next, we apply this storage policy to an existing VM. Navigate to the VM, select 'Configure' and 'Edit VM storage policies':

Here, we can either apply the policy to all of the VM disks at once, or per-disk. We select 'Configure per disk' and update Hard disk 1 to use the newly created RAID-5 policy:

After this has been set, vSAN will move the data components as per the policy. Once this has been completed, the VM's disks will show as compliant to the policy:

Navigating to monitor > Physical disk placement shows the components for Hard disk 1 are now spread over four hosts (as compared to three hosts with Hard disk 2):

Trim/Unmap
vSAN supports space reclamation on VMDKs using trim commands issued from guest VMs. To enable this feature, a cluster-wide setting for enabling unmap (via RVC or PowerCLI) is set. Once unmap is enabled on the cluster, guest VMs can issue commands (such as fstrim) to free any previously deleted data.
To demonstrate this, firstly we observe how much space is in use currently, by navigating to [vSAN Cluster] > [Monitor] > [Capacity]. Note that around 931GB of space is currently in use, with around 493GB of VM data

Next, we create or copy a large file on our guest VM. In this case a Windows 2016 VM is used and a large (~76GB) file has been created:

As expected, our space utilization increases by around 76GBx2 (as this is a RAID-1 object). Thus, 76GBx2 + 493GB gives us around 644GB, as we see below:

We now delete the file:

Looking back at the capacity view, we can see that the space consumed is still the same:

To enable unmap on the cluster, we can either use RVC or PowerCLI.
PowerCLI method:
After logging into vCenter, run the following command, replacing <cluster> with the name of the cluster:
$ Get-Cluster -name <cluster> | Set-VsanClusterConfiguration -GuestTrimUnmap $true
RVC method:
First, login to vCenter via RVC:
# rvc administrator@vsphere.local@localhost
We then navigate to the path <datacenter>/computers:
/localhost> cd /localhost/VSAN-DC/computers
Unmap support can then be enabled using the 'vsan.unamp_support' command:
/localhost/VSAN-DC/computers> vsan.unmap_support VSAN-Cluster -e
2020-04-07 19:13:07 +0000: Enabling unmap support on cluster
VSAN-Cluster: success
Now, to claim back the space, we execute a trim command from our guest VM (It should be noted that the guest will automatically run a trim reclaim, for the purposes of this demonstration, we have turned this feature off):

Looking back at vCenter, we see that the used space has been freed:

VSAN Encryption
vSAN encryption overview, requirements, enabling encryption and expected behavior
vSAN Data-at-Rest Encryption Requirements
Encryption for data at rest became available on vSAN 6.6. This feature does not require self-encrypting drives (SEDs)* and utilizes an AES 256 cipher. Encryption is supported on both all-flash and hybrid configurations of vSAN.
*Self-encrypting drives (SEDs) are not required. Some drives on the vSAN Compatibility Guide may have SED capabilities, but the use of those SED capabilities are not supported.
vSAN datastore encryption is enabled and configured at the datastore level. In other words, every object on the vSAN datastore is encrypted when this feature is enabled. Data is encrypted when it is written to persistent media in both the cache and capacity tiers of a vSAN datastore. Encryption occurs just above the device driver layer of the storage stack, which means it is compatible with all vSAN features such as deduplication and compression, RAID-5/6 erasure coding, and stretched cluster configurations among others. All vSphere features including VMware vSphere vMotion®, VMware vSphere Distributed Resource Scheduler™ (DRS), VMware vSphere High Availability (HA), and VMware vSphere Replication™ are supported. A Key Management Server (KMS) is required to enable and use vSAN encryption. Nearly all KMIP-compliant KMS vendors are compatible, with specific testing completed for vendors such as HyTrust®, Gemalto® (previously Safenet), Thales e-Security®, CloudLink®, and Vormetric®. These solutions are commonly deployed in clusters of hardware appliances or virtual appliances for redundancy and high availability.
Requirements for vSAN Encryption:
- Deploy KMS cluster/server of your choice
- Add/trust KMS server to vCenter UI
- vSAN encryption requires on-disk format version 5
- If the current on-disk format is below version 5, a rolling on-disk upgrade will need to be completed prior to enabling encryption
- When vSAN encryption is enabled, all disks are reformatted
- This is achieved in a rolling manner
Adding KMS to vCenter
KMS for vSAN
Given the multitude of KMS vendors, the setup and configuration of a KMS server/cluster is not part of this document; however, it is a pre-requisite prior to enabling vSAN encryption.
The initial configuration of the KMS server is done in the VMware vCenter Server® user interface of the vSphere Client. The KMS cluster is added to the vCenter Server and a trust relationship is established. The process for doing this is vendor-specific, so please consult your KMS vendor documentation prior to adding the KMS cluster to vCenter.
To add the KMS cluster to vCenter in the vSphere Client, click on the vCenter server, click on Configure > Key Management Servers > ADD. Enter the information for your specific KMS cluster/server.
 Figure 1. Add KMS cluster to vCenter
Once the KMS cluster/server has been added, you will need to establish trust with the KMS server. Follow the instructions from your KMS vendor as they differ from vendor to vendor.
 Figure 2. Establish trust with KMS
After the KMS has been properly configured, you will see that the connections status and the certificate have green checks, meaning we are ready to move forward with enabling vSAN encryption.

Figure 3. Successful connection and certificate status.
Native Key Provider
New in vSAN 7.0 Update 2, a new capability has been added to add a Native Key Provider. You can think of this as an internal KMS server.
Adding the Native Key Provider is achieved in a similar manner as adding an external KMS.
Click on vCenter Appliance from vCenter UI > Configure > Key Providers > Add > Add Native Key Provider

During the naming of the Key Provider, you are presented with the recommended option to only use the key provider with TPM protected ESXi Hosts.

Once the Native Key Provider has been added to vCenter, you have the option to Back up the Key Provider which you should do in order to have a copy of the keys.

When enabling vSAN Encryption, the added Native Key Provider will be available to select. You can add external KMS servers and Native Key Provider to vCenter and use them in different clusters.
For a POC, utilizing the Native Key Provider is a quick and easy way to test the vSAN Encryption services. If you require to have redundancy across KMS servers possibly located in different locations, you may want to consider utilizing external KMS in a cluster configuration.

Enabling vSAN Encryption
Prior to enabling vSAN encryption, all the following pre-requisites must be met:
- Deploy KMS cluster/server of your choice
- Add/trust KMS server to vCenter UI
- vSAN encryption requires on-disk format version 5
- When vSAN encryption is enabled all disks are reformatted
To enable vSAN encryption, click on [vSAN cluster] > Configure > vSAN > Services, and click EDIT next to the "Encryption" service. Here we have the option to erase all disks before use. This will increase the time it will take to do the rolling format of the devices, but it will provide better protection.
Note: vSAN encryption does work with Deduplication and Compression.
 Figure 1. Enabling vSAN encryption
After you click APPLY, vSAN will remove one disk group at a time, format each device, and recreate the disk group once the format has completed. It will then move on to the next disk group until all disk groups are recreated, and all devices formatted and encrypted. During this period, data will be evacuated from the disk groups, so you will see components resyncing.
 Figure 2. Disk group removal, disk format, disk group creation
Note: This process can take quite some time depending on the amount of data that needs to be migrated during the rolling reformat. If you know encryption at rest is a requirement, go ahead and enable encryption while enabling vSAN.
Disabling vSAN Encryption
Disabling vSAN encryption follows a similar procedure as its enablement. Since the encryption is done at the disk group level, a disk reformat will also be conducted while disabling encryption.
Keep in mind that vSAN will conduct a rolling reformat of the devices by evacuating the disk groups first, deleting the disk group and re-creating the disk group without encryption, at which point it will be ready to host data. The same process is conducted on all remainder disk groups until the vSAN datastore is no longer encrypted.
Since the disk groups are evacuated, all data will be moved within the disk groups, so it may take a considerable amount of time depending on the amount of data present on the vSAN datastore.
vSAN Encryption Rekey
You have the capability of generating new keys for encryption. There are 2 modes for rekeying. One of them is a high level rekey where the data encryption key is wrapped by a new key-encryption key. The other level is a complete re-encryption of all data by selecting the option Also re-encrypt all data on the storage using the new keys. This second rekey (deep rekey) may take significant time to complete as all the data will have to be re-written, and may decrease performance.
Note: It is not possible to specify a different KMS server when selecting to generate new keys during a deep rekey; however, this option is available during a shallow rekey.

vSAN Data-in-Transit Encryption
Beginning in vSAN 7U1, we now support Data-in-Transit encryption. Data-in-Transit Encryption can be enabled independently or together with Data-at-Rest encryption to fully protect vSAN data. Data-in-Transit encryption uses FIPS 140-2 validated VMware VMkernel Cryptographic module. Both Data and metadata are encrypted. Unlike Data-at-Rest encryption, Data-in-Transit encryption does not require an external KMS. Keys are managed internally. If using HCI Mesh mounts or exports you cannot use Data-in-Transit encryption.
New in vSAN 7.0 Update 1, traffic between data nodes and shared witness can be encrypted by leveraging Data In Transit Encryption by simply turning this service on.
When a shared witness node is part of multiple vSAN clusters, Data in Transit Encryption feature will be allowed to be enabled only when all nodes in all clusters of shared-witness node have been upgraded to 7.0 U2 version.
Enabling Data-in-Transit Encryption
Enabling Data-in-Transit encryption is easy to do. Select your cluster, then click Configure, and then under vSAN select Services, then click Edit. Tick Data-in-Transit encryption and select your Rekey Interval. The default for rekey interval is one day. Click Apply.
Native KMS Integration In vSphere
Native KMS integration was introduced in vSphere 7.0u2 and no external key management server is required. ESXi Host require to support TPM 2.0 and function be enabled in BIOS.
Choose “Add Native Key Provider”


Integrated Key provider reduces the requirement for external 3rd party key management servers. One of the most important steps are creating backups of all keys and store them accordingly some place safe external.

Set a secure password and store the password in a safe place, example physical fault.

Note: Multiple Native KMS providers can be added in order to further secure each vSAN cluster separately.
Further information and advanced setups, please visit our vSphere documentation (link) and Video blog (link).
vSAN File Service
Native file services integrated within vSAN simplifies storage management, as it helps reduce the dependency on external solutions.
Enabling file services in vSAN is similar to enabling other cluster-level features such as iSCSI services, deduplication and compression, and encryption. File shares can be presented to both virtual machines as well as containers. The entire life cycle of provisioning and managing file services can be seamlessly performed through the vCenter UI.

Use Cases
The addition of vSAN File Service enables customers to use vSAN capacity for NFS and SMB workloads without the need to install or manage a dedicated file service appliance. Customers can enable vSAN FS and use spare vSAN capacity to host file share workloads. Initial use cases will be for simple files like logs and application binaries.
Cloud Native Use Cases
File services in its first instance is designed to support Cloud-Native workloads. Cloud-Native workloads built on micro-services architecture require data access to be concurrent. Multiple micro-services read and update the same data repository at the same time from different nodes. Updates should be serialized, with no blocking, locking, or exclusivity. This approach differs from the current offering for Cloud-Native storage on vSAN. In the current model, vSAN backed VMDKs are presented to VMs and mounted into a single container.
Hence, File storage is a critical need for Cloud-Native Applications, and most of them based on the latest NFS v4.1 protocol. Workloads such as web servers, application servers like Apache, Nginx, and Tomcat require shared file access in order to support a distributed application. Rather than replicating this data to every instance, a single NFS share can be mounted into all containers running these workloads. NFS v3/v4.1 are supported.
vSAN 7U1 now supports SMB v2.1/v3, Kerberos for NFS, and Active Directory for SMB. Also, vSAN File Services now supports 32 hosts per cluster.
The addition of SMB services and Active Directory integration allows customers to explore the following use cases.
- File share servicing users and groups in remote locations (e.g. Remote/branch offices etc.) where dedicated Windows servers are not available.
- VDI instances redirecting user/home directory to a file share location.
In this section we will focus on enabling vSAN File Service, creating and mounting shares, viewing file share properties, and failure scenarios.
Pre-Requisites
Before enabling file services, you will need the following information:
- A unique IP address for each host
- DNS (forward and reverse lookup)
- Subnet Mask
- Gateway
In addition, you will need the following information for the cluster:
- File Services Domain – A unique namespace for the cluster that will be used across shares
- DNS Servers – Multiple DNS entries can be added for redundancy
- DNS Suffix
- Active Directory Domain information
- Active Directory UserID and Password
Enabling File Services
To enable file service, begin by selecting configure from the cluster level.
Select Services withing the vSAN section. In the list of services, we see that File Services is currently disabled. Begin by clicking Enable.

The Introduction screen introduces file services and provides a checklist of requirements for enabling file services. After verifying all the required information is available click NEXT.

File Service is implemented as a set of File Server Agents managed by the vSphere ESX Agent Manager. Each agent is a lightweight virtual appliance running Photon OS and Docker. Agents behave as NFS servers and provide access to file shares.
From the File services agent screen, we have the option to automatically download the agent. If an internet connection is unavailable a manual approach is also provided. For this example, the automatic approach is used.
Select the Automatic approach button, make sure the Trust the certificate box is checked and click NEXT.

The next step is to provide domain information. In this example, we define a domain name for file service as vsan-fs. Ensure appropriate inputs are provided for the file service name, DNS server, and the DNS suffix.
In the Directory service section select Active directory. Active directory is used for SMB shares and NFS 4.1 shares with Kerberos authentication. Once the directory services have been selected, enter the Active directory domain as well as AD username and password are required for SMB services. Once all boxes have been completed, click NEXT.

From the network screen, select the VM Network on which the file service agents will be deployed. File shares are accessed from this network as well. After selecting the network enter subnet mask and gateway information. Once the correct information is populated click NEXT.

On the IP Pool screen fill out the IP address pool to be used by the file server agents. As a best practice add an IP address for each host in the cluster. In this example, four IP addresses are used. Each IP address should be associated with a DNS name. The wizard has an option to auto-fill IP addresses if a range of contiguous addresses is used. In addition to entering IP addresses, a primary IP address is selected. The primary IP address is used for accessing NFS v4.1 shares. On the back end, the connection will be redirected to a different agent using NFSv4 referrals. Once the IP addresses are entered there is an option to Lookup DNS names to populate and validate DNS entries for the associated IP addresses.

From the review screen, review the information for correctness and click FINISH to start the deployment.

During the deployment phase, several tasks will be displayed in the recent tasks pane. Once the tasks are completed, we can see newly created File Services Agents by expanding the ESX Agents. In this example there one agent is deployed for each host in the vSAN cluster.
Creating an NFS File Share
Once file services are enabled a new menu appears in Configuration > vSAN called File Share Services.
From the File Service Shares screen click ADD to start the File Share wizard. In the wizard, we provide a name for the file share. In this example, we are creating a file share called app-share. Beginning in vSAN 7U1 we have the option to use NFS or SMB (After configuring Active Directory Authentication).
The storage policy is also applied to the file share. Any vSAN storage policy can be chosen to allow the association of availability and performance characteristics to be applied to file shares. Storage space quotas can also be applied to file shares.
In this example, 90 GB is set as a warning threshold and 100 GB is set as a hard quota for the share. Once the general information is populated click NEXT.

The next step specifies which networks can access the share. Options to make the share wide open (accessible from any network) or a range of networks can be applied. Read or Read/Write permissions to file shares. The root squash checkbox applies a technique used in NFS which ‘squashes’ permissions of any root user who mounts and uses the file share. In this example, no network restrictions are applied to the share. Click NEXT once the appropriate access control selections are made.

Once the file share has been created is will be displayed in the File Services Shares as shown below.
After the share has been created any quota, labels or network permissions can be made by selecting the file share and selecting EDIT.
Creating an SMB File Share
Creating an SMB file share is similar to creating an NFS file share. From the File Service Shares screen click ADD to start the File Share wizard. In the wizard, we provide a name for the file share. In this example, we are creating an SMB share called group-share. When creating an SMB share, we have the option to enable SMB protocol encryption by selecting Protocol encryption.
As with NFS shares quotas and warning thresholds can be set. In this example we are setting a hard quota of 100GB.
Once the required information has been filled in click Next.

Once the file shares have been created, they are visible from the file share list. Information such as file share name, protocol and quota/actual usage is available from the list. Existing shares can be edited by selecting the share and choosing edit.

Mounting an NFS File Share
Once the file share is created, we can mount the file share. For this example, we are using a Photon VM. To mount the share, we can copy the connection string from the File Share Services UI by selecting the file share and selecting COPY URL. In this case, we are selecting NFS v4.1.

From the Photon VM use the copied URL to connect to the share.
mount 10.159.23.90:/app-share /mnt/app-share
After the share is mounted, mount | grep app-share command can be used to display details of the mounted share. It this case we can see the share is connected using NFS v4.1.
type nfs4 (rw,relatime,vers=4.1,rsize=1048576,wsize=1048576,namlen=255,hard,proto=tcp,timeo=600,retrans=2,sec=sys,clientaddr=10.159.24.19,local_lock=none,addr=10.159.23.90)
Mounting an SMB File Share
To mount the SMB file share, choose the file share from the list and select copy URL. Once the URL is copied it can be pasted into windows explorer to access the share.
Quotas and Health Events
During file share creation, quotas and hard limits can be set. In this sample file share, a warning threshold of 90 GB was specified and a hard limit of 100GB was set. As part of this test copy some data to the file share to fill the space required to trigger the quota. Once the warning threshold is exceeded the Usage over the Quota field in the UI will turn red.

Once the hard quota is reached writes to the share will fail with a disk quota exceeded error as shown below.
cp: error writing 'file13.txt': Disk quota exceeded
If the quota is reached an alarm in Skyline Health is also triggered. The details of the alarm can be viewed by expanding the File Services section.

Once data has been removed from the Share Health alert is cleared and the File Service health reports as normal.
Failure Scenarios
Storage policies apply to file service objects just as they do other virtual disk objects. Health and placement details of file shares are shown in the Virtual Objects view.

By clicking VIEW PLACEMENT DETAILS the layout of the underlying vSAN object can be viewed. This view shows component status, and on which hosts components of the share reside. 
To test host failure, we will power off one of the hosts containing an active copy of the file share data. Once the host is powered off, we see that the component of the corresponding host is displayed as absent. 
Now that the host has been shut down, you can validate from any of the client virtual machines through a file browser or logs to verify that file share is still accessible.
File Services Snapshots
vSAN 7 Update 2 now includes a new snapshotting mechanism allowing for point-in-time recovery of files. Snapshots for file shares can be created through the UI. Recovery of files is available through API allowing backup partners to extend current backup platforms to protect vSAN file shares.
File Services Support for Stretched Clusters and 2-Node Topologies
File services can now be used in vSAN stretched clusters and 2-node topologies. The site affinity setting for file hares defines where the presentation layer resides. Site affinity for file shares is defined by the storage policy associated with the individual file shares. The storage policy and site affinity settings to be applied to the file share are defined as part of the creation process.
The image below is an example of the site affinity setting available when creating a file share in a stretched cluster.

Cloud-Native Storage
Overview
Cloud-Native Storage (CNS), introduced in vSphere 6.7 Update 3, offers a platform for stateful cloud-native applications to persist state on vSphere backed storage. The platform allows users to deploy and manage containerized applications using cloud-native constructs such as Kubernetes persistent volume claims and maps these to native vSphere constructs such as storage policies. CNS integrates with vSphere workflows and offers the ability for administrators to perform tasks such as defining storage policies that could be mapped to storage classes, list/search and monitor health and capacity for persistent volumes (PV). vSphere 6.7 Update 3 supports PVs backed by block volumes on vSAN as well as VMFS and NFS datastores. However, some of the monitoring and policy-based management support may be limited to vSAN deployments only. With the release of vSAN 7.0, PVs can also be backed by the new vSAN File Service (NFS).

Cloud Native Storage Prerequisites
While Cloud Native Storage is a vSphere built-in feature that is enabled out-of-the-box starting in vSphere 6.7 Update 3, it is required to install the Container Storage Interface (CSI) driver in Kubernetes to take advantage of the CNS feature. CSI is a standardized API for container orchestrators to manage storage plugins. CNS support requires minimum version of Kubernetes v1.14 release. Configuration procedure of CSI driver in Kubernetes is beyond the scope of this guide. To learn more about the installation of the CSI driver, refer to the vSphere CSI driver documentation.
Deploy a Persistent Volume for Container (Block Type)
Assuming your Kubernetes cluster has been deployed in the vSAN cluster and the CSI driver has been installed, you are ready to check out the Cloud Native Storage functionality.
First, we need to create a yaml file like below to define a storage class in Kubernetes. Notice the storage class name is “cns-test-sc” and it is associated with the vSAN Default Storage Policy. Note also that the “provisioner” attribute specifies that the storage objects are to be created using the CSI driver for vSphere block service.
kind: StorageClassapiVersion: storage.k8s.io/v1metadata: name: cns-test-sc provisioner: block.vsphere.csi.vmware.com
parameters: StoragePolicyName: "vSAN Default Storage Policy"
Apply the storage class by executing the following command on your Kubernetes master node:
kubectl apply -f cns-test-sc.yaml
Run the command below to confirm the storage class has been created.
kubectl get storageclass cns-test-sc
NAME PROVISIONER AGE
cns-test-sc block.vsphere.csi.vmware.com 20s
Next, we need to create another yaml file like below to define a Persistent Volume Claim (PVC). For the illustration purpose of this POC, we simply create a persistent volume without attaching it to an application. Notice “storageClassName” references to the storage class that was created earlier. There are two labels assigned to this PVC: app and release. We will see later how they get propagated to CNS in the vSphere Client UI.
apiVersion: v1kind: PersistentVolumeClaimmetadata: name: cns-test-pvc labels: app: cns-test release: cns-test
spec: storageClassName: cns-test-sc accessModes: - ReadWriteOnce resources: requests: storage: 2Gi
Create the PVC by executing the following command on your Kubernetes master node:
kubectl apply -f cns-test-pvc.yaml
Run the command below to confirm the PVC has been created and its status is listed as “Bound”.
kubectl get pvc cns-test-pvc
NAME STATUS VOLUME CAPACITY ACCESS MODES STORAGECLASS AGE
cns-test-pvc Bound pvc-ebc2e95c-b98f-11e9-808d-005056bd960e 2Gi RWO cns-test-sc 15s
To examine what container volume has been created in vSphere Client UI, navigate to [vSAN cluster] > Monitor > Cloud Native Storage > Container Volumes. You should see a container volume with a name that matches the output from the “get pvc” command. The two labels (app and release) correspond to those that are specified in the PVC yaml file. These labels allow Kubernetes admin and vSphere admin to refer to a common set of volume attributes that makes troubleshooting easier. If there are many container volumes created in the cluster, you could select the filter icon for the “Label” column and search the container volumes by multiple label names that quickly narrow down the list of volumes that needs to be investigated.
Deploy a Persistent Volume for Container (File Type)
Assuming your Kubernetes cluster has been deployed in the vSAN cluster and the CSI driver (version 2.0 or above is required to support ReadWriteMany access mode) has been installed, and vSAN file service is enabled, you are ready to check out the Cloud Native Storage functionality for File.
First, we need to create a yaml file like below to define a storage class in Kubernetes. Notice the storage class name is “vsan-file” and it is associated with the vSAN Default Storage Policy. Note also that the “fstype” attribute specifies that the storage objects are to be created using the CSI driver for vSAN file service.
kind: StorageClassapiVersion: storage.k8s.io/v1metadata: name: vsan-file provisioner: csi.vsphere.vmware.com
parameters: storagePolicyName: "vSAN Default Storage Policy" csi.storage.k8s.io/fstype: nfs4
Apply the storage class by executing the following command on your Kubernetes master node:
kubectl apply -f file-sc.yaml
Run the command below to confirm the storage class has been created.
kubectl get storageclass vsan-file
NAME PROVISIONER AGE
vsan-file csi.vsphere.vmware.com 20s
Next, we need to create another yaml file like below to define a Persistent Volume Claim (PVC). For the illustration purpose of this POC, we simply create a persistent volume without attaching it to an application. Notice “storageClassName” references to the storage class that was created earlier. There are two labels assigned to this PVC: app and release. We will see later how they get propagated to CNS in the vSphere Client UI.
apiVersion: v1kind: PersistentVolumeClaimmetadata: name: file-pvc
spec: accessModes: - ReadWriteMany resources: requests: storage: 50Gi storageClassName: vsan-file
Create the PVC by executing the following command on your Kubernetes master node:
kubectl apply -f file-pvc.yaml
Run the command below to confirm the PVC has been created, its status is listed as “Bound”, and access mode is set for "RWX" to allow multiple pods to read from and write to the PV simultaneously.
kubectl get pvc file-pvc
To examine what container volume has been created in vSphere Client UI, navigate to [vSAN cluster] > Monitor > Cloud Native Storage > Container Volumes. You should see a container volume with a name that matches the output from the “get pvc” command. 
To drill down into a particular volume under investigation, you could select the icon![]() and obtain more information such as Kubernetes cluster name, PVC name, namespace, and other storage properties from vSphere perspective.
and obtain more information such as Kubernetes cluster name, PVC name, namespace, and other storage properties from vSphere perspective.

If you want to investigate the overall usage of all container volumes in the cluster, navigate to [vSAN cluster] > Monitor > vSAN > Capacity. The Capacity view breaks down the storage usage at a granular level of container volumes that are either attached or not attached to a VM.

This concludes the Cloud Native Storage section of the POC. You may delete the PVC “file-pvc” from Kubernetes and verify that its container volume is removed from the vSphere Client UI.