
vSAN Proof of Concept: vSAN Management, Monitoring & Hardware Testing
Introduction
The vSAN Management, Monitoring & Hardware Testing guide represents one of a series of vSAN Proof of Concept Guides covering a variety of vSAN related topics. The other guides being:
- vSAN Proof of Concept: vSAN Architecture Overview & Setup
- vSAN Proof of Concept: vSAN Features
- vSAN Proof of Concept: vSAN Performances Testing
- vSAN Proof of Concept: vSAN Stretched Cluster & Two-Node Overview & Testing
This guide is designed to stand largely separate from the other documents. That said, the assumption is that the reader has working knowledge of vSAN cluster creation and Storage Policy Management. Especially since the steps documented herein often assume a vSAN Cluster already exists in your test environment. If you require a refresher, please review the vSAN Proof of Concept: vSAN Architecture Overview & Setup guide
The particular focus of this guide is discussion and walkthrough of specific vSAN features such as:
- Management Tasks (e.g., maintenance mode, disk removal, host scale-out)
- Monitoring Tasks
- Testing Hardware Failures
This document primarily focuses on vSAN Express Storage Architecture™ (ESA) cluster environments. vSAN Original Storage Architecture™ (OSA) environments are covered where they differ from vSAN ESA.
vSAN Management Tasks
Maintenance Mode
In this section we shall look at management tasks, such as the behavior when placing a host into maintenance mode and the evacuation of disks from a host. We will also look at how to turn on and off the identifying LEDs on a disk drive.
There are several options available when placing a host into maintenance mode. The first step is to identify a host that has a running VM:
Ensure that there is at least one VM running on the vSAN cluster. Then select the summary tab of the VM to see which host it is running on:

Then, navigate to [VM] > Monitor > vSAN > Physical disk placement to show which hosts the data components reside on. Clicking on ‘Group components by host placement’ shows this more clearly:

We can see that the VMware ESXi™ (ESXi) host 10.159.130.220 hosts both the running VM and several data components. This is the host that we shall place into maintenance mode.
Navigate to the host Summary view, select Actions, then select Maintenance Mode from the drop-down menu, then select the option Enter Maintenance Mode:

On the Enter Maintenance Mode pop-up, we are presented with options for vSAN data migration. Here, click on ‘Go to pre-check’. This will enable us to safely test the various scenarios without affecting the system:

The pre-check can also be accessed by navigating to [vSAN Cluster] > Monitor > Data Migration Pre-Check
We can see that there are three options available to enable maintenance mode when vSAN is present
- Full data migration: Move all the data away from the affected resource before maintenance
- Ensure accessibility: First check for any issues before resources become (temporarily) unavailable (No data is moved)
- No data migration: Perform no checks nor move any data.
On the next screen, we can pick one of the options to test the scenario. For maintenance operations where the host is temporarily out of service, the recommendation is to select ‘ensure accessibility’. This will ensure that there are sufficient resources available to service the VM (albeit in a compromised state) for the duration of the vSAN cluster services timer.
Once on the Data Migration Pre-Check screen, confirm ‘Ensure Accessibility’ is selected from the ‘vSAN Data Migration’ drop-down, then select Pre-Check:


As the host owns several data object components, when the host is offline, those components will be unavailable. Here we compromise moving data objects for a relatively quick maintenance operation.
Perhaps unsurprisingly, if we chose ‘full data migration’ as the scenario (where all the components will be moved away from the host before enabling maintenance mode) then the components are fully protected:

Changing the maintenance mode option back to ‘ensure accessibility’, we can select ‘enter maintenance mode’ to observe what happens:

We receive a warning regarding migrating running VMs. If DRS is set to ‘fully automated’, the virtual machines should be automatically migrated.

After the host has entered maintenance mode, we can now examine the state of the components. As expected, since the host is offline, some components are marked as ‘absent’. The VM and its data remains accessible.

We introduced the enhanced data durability feature for planned maintenance when using RAID 5/6. In a vSAN Express Storage Architecture (ESA) cluster, when a host enters maintenance mode using the “Ensure Accessibility” option, it will allow vSAN to write all incremental updates to another host in addition to the hosts holding the object data in a stripe with parity. This helps ensure the durability of the changed data if additional hosts participating in the storage of that object fail while the host in maintenance mode remains offline. Durability components also allow vSAN to merge the updated data more quickly into the stripe with parity, allowing clusters to regain the prescribed level of resilience more quickly during these maintenance activities.
This data durability enhancement significantly speeds up the time required to patch, or perform other maintenance on a vSAN cluster, especially at scale.
For more details on durability components, visit:
- https://core.vmware.com/blog/durability-components-raid-56-using-vsan-esa-vsan-8-u1
- https://blogs.vmware.com/virtualblocks/2020/09/23/enhanced-durability-during-maintenance-mode-operations/
- https://blogs.vmware.com/virtualblocks/2021/03/18/enhanced-data-durability-vsan-7-update-2/
To take the host out of maintenance mode, navigate to the ESXi host. From the actions menu select Maintenance Mode > Exit Maintenance Mode:
After exiting maintenance mode, the “Absent” component becomes "Active" once more (if the host exited maintenance mode before the 60-minute vSAN cluster services timer expires):

We shall now place the host into maintenance mode once more, but this time we will choose ‘full data migration’. As the name suggests, this will move all data components from the affected host to the remaining hosts in the cluster (thus ensuring full availability during the maintenance operation).
Note that this is only possible when there are enough resources in the cluster to cater for the affected components: there must be enough hosts remaining to fulfill the storage policy requirements, along with enough space left on the hosts.
When we run the pre-check again, we can see that around 2GB data will be moved, and that the VM will be fully protected (health status is fully green):

As expected, all the components of our VM remain active and healthy. We see that some components have been moved to other hosts:

Now, if we try to place another host into maintenance mode, there will be a warning shown. Safeguards are in place when multiple hosts are requested to enter maintenance mode at the same time (along with similar scenarios where recent operations have caused resync activity). This ensures that there are no multiple unintended outages that may cause vSAN objects to become inaccessible.

If we look at the pre-check (for the full data migration scenario) for this additional host, we can see that this produces errors. The second host cannot enter maintenance mode with the current storage policy and resources available:

Ensure that you exit maintenance mode of all the hosts to restore the cluster to a fully functional state.
Remove a Disk
Here, we demonstrate how to remove a disk in vSAN.
Navigate to [vSAN Cluster] > Configure > vSAN > Disk Management. Select a host and then click on ‘View Host Objects’ to confirm that there are VM objects on the host

Below we can see that there is indeed VM data on the host 10.159.21.11. Once confirmed, click on BACK TO HOST LIST:

Then click on View Disks on the host with VM data:

Depending on the architecture of vSAN deployed (OSA or ESA), disk groups or a disk pool will be shown.
vSAN ESA Cluster
Here, we can select any disk we’d like to remove.

Just like with host maintenance, we can choose between the three options:
- Full data migration: Move all the data away from the affected resource before maintenance
- Ensure accessibility: First check for any issues before resources become (temporarily) unavailable (No data is moved)
- No data migration: Perform no checks nor move any data
As before, with the ‘ensure accessibility’ scenario, we can see that some objects will become non-compliant with the storage policy. We can, however, remove or unmount the disk without affecting the running VM.

Clicking on remove or unmount will bring up a confirmation window:


Removing or unmounting the disk group will cause the VM data components to go into the ‘absent’ state.
Remember to re-add back any disks or disk groups removed.
vSAN OSA Cluster
Here, we are presented with the disk groups on the host (same navigation as what was used for the vSAN ESA cluster section):

Expand one of the disk groups. Select a capacity disk and click on Go To Pre-Check:

Just like with host maintenance, we can choose between the three options:
- Full data migration: Move all the data away from the affected resource before maintenance
- Ensure accessibility: First check for any issues before resources become (temporarily) unavailable (No data is moved)
- No data migration: Perform no checks nor move any data
As before, with the ‘ensure accessibility’ scenario, we can see that some objects will become non-compliant with the storage policy. We can, however, remove the disk without affecting the running VM:

Clicking on remove will bring up a confirmation window:

Removing the disk group will cause the VM data components to go into the ‘absent’ state.
We can also do the same with the whole disk group. Navigate back to Configure > Disk Management and select the host again and View Disks. This time, click on the ellipses (three dots) to the left of Disk group. This will bring up a list of options:

Click on Go To Pre-Check. Again, we run the ‘ensure accessibility’ scenario and see that we can remove the whole disk group without affecting the VM runtime (rendering the storage policy non-compliant).

Again, clicking on unmount, recreate, or remove will bring up a confirmation dialog:


Removing or unmounting the disk group will cause the VM data components to go into the ‘absent’ state.
Remember to re-add back any disks or disk groups removed.
Turning On/Off Disk LEDs
vSAN supports toggling disk locator LEDs natively for LSI controllers and some NVMe devices. Other controllers are supported via an installed utility (such as hpssacli when using HP controllers) on each host. Refer to vendor documentation for information on how to locate and install this utility. For Intel NVMe devices specifically, see https://kb.vmware.com/s/article/2151871
To toggle a locator LED, select a disk and click on the ellipses (three dots) above the table:

This will launch a VMware vCenter Server® (vCenter) task. In this instance, ‘turn on disk locator LEDs’. To see if the task was successful, go to the ‘monitor’ tab and check the ‘events’ view. If there is no error, the task was successful. Obviously, a physical inspection of the drive will show the state of the LED.
VMware vSphere® Lifecycle Management™ (vLCM)
Lifecycle management is performed via vLCM. This builds on the previous generation VMware vSphere® Update Manager™ (VUM) with many new features. vLCM operates at the cluster level using a ‘desired state’ model, which will attempt to reconcile the system to the settings prescribed and remediate if there is a drift (with adherence to the VMware Compatibility Guide). This reduces the effort to monitor compliance for individual components and helps maintain a consistent state for the entire cluster. Moreover, vLCM provides both the lifecycle management for the hypervisor and the full stack of drivers and firmware.
VUM was deprecated from vSphere 8.0. See the following support article for more information: https://kb.vmware.com/s/article/89519
Using vLCM to set the desired image for a vSAN cluster
There are prerequisites to using vLCM:
- All hosts are at version 7.0 or higher
- Hosts need to be from the same vendor
- Hosts need to have a local store (should not be stateless)
- Use this link for a full list - https://docs.vmware.com/en/VMware-vSphere/8.0/vsphere-lifecycle-manager/GUID-0295A915-3963-47AD-AA79-C275226B866F.html
A vLCM desired state image consists of a base ESXi image (required), plus any vendor and firmware and driver addons:
- Base Image: The desired ESXi version that can be pulled from VMware software depot or manually uploaded
- Vendor Addons: Packages of vendor specified components such as firmware and drivers
With VMware vSphere® (vSphere) 8.0, when creating a cluster, the option to manage hosts with a single image is pre-selected:

For an existing cluster created without using this option, navigate to [vSAN Cluster] > Updates and click on Manage With A Single Image:

Here, we can either choose to setup an image with pre-existing versions and addons, or import an image spec via a JSON file or URL:

For further details of setting up and using vLCM, visit: https://core.vmware.com/resource/introducing-vsphere-lifecycle-management-vlcm
vLCM using Hardware Support Manager (HSM)
In the previous section, an image was created to be used by vLCM to continuously check against and reach the desired state. However, this step only covers the configuration of the ESXi image. To fully take advantage of vLCM, repositories can be configured to obtain firmware and drivers, among others, by leveraging the Hardware Support Manager provided by the vendor.
VMware maintains a compatibility list of HSMs here: https://www.vmware.com/resources/compatibility/search.php?deviceCategory=hsm
In this example, Dell OpenManage Integration for VMware vCenter (OMIVV) will be mentioned. Deploying and configuring HSM will not be covered in this guide, as this varies by vendor.
Overview of steps within HSM prior to vLCM integration (steps may vary)
- Deploy HSM appliance and register plugin with vCenter
- Configure host credentials through a cluster profile
- Configure repository profile (where vLCM will get firmware and drivers)
First navigate to [vSAN Cluster] > Updates, then Edit:

Then, click on Select next to Firmware and Drivers Addon:

Select the desired HSM, then select firmware and driver addon (previously created profile in HSM), and then save the image settings.

Image compliance check will initiate and the option to remediate will be available

Scale Out vSAN
Add a Host into the Cluster via Quickstart
The walkthrough assumes that the vSAN ESA cluster was initially deployed via Quickstart. For more information on deploying a vSAN ESA Cluster via Quickstart, please refer to the vSAN Proof of Concept: vSAN Architecture Overview & Setup guide.
Prerequisites:
- Host identical to the current hosts in the vSAN ESA cluster
- ESXi installed on the target matches that of the vSAN ESA cluster
Note: The steps below apply to vSAN ESA HCI, vSAN Max™ and vSAN OSA clusters respectively.
First navigate to [vSAN Cluster} > Quickstart. On the Quickstart screen you will see the current state of the vSAN cluster. In this case it has three hosts. Click Add:

The Add Hosts pop-up wizard appears. Walkthrough the wizard adding your host(s). In this example, we are adding a single additional host:

After you select Next above, the Security Alert may appear. If so, accept the thumbprint(s) for the target host(s) and click OK:

Review the Host Summary, then click Next:

Assuming the target host(s) are the same make and model as the current hosts in the cluster (VMware recommended best practice), you will not need to import a new image. Ensure ‘Don’t import an image’ is selected and click Next:

Review and click Finish:

This starts the host add processes that can be monitored via the Recent Tasks section of the vSphere Client. Once the process finishes you will see the updated Quickstart screen below. Notice that the under ‘Add Hosts’ it now shows four total hosts with one not configured. Click Continue under ‘Configure Hosts’ to complete host configuration:

The Configure Cluster pop-up wizard appears. The wizard walks through the data to configure VMware vSphere® vMotion® (vMotion) and Storage networks; claim disks, and fault domains as necessary for your new host(s). In this example, we are using static IPv4 IPs for vMotion and Storage traffic, however DHCP and IPv6 configurations are possible:


On the Claim Disks screen, the administrator can
- Allow vSAN to automatically claim disks (with the ‘I want vSAN to manage the disks’ toggle)
or - Select the disks manually
In this example, we chose manual selection.
Additionally, the system will automatically compare the target disks to the VMware HCL and will present a warning if it detects an issue. As you can see below:

In this example, only one fault domain was configured. If the vSAN cluster has more than one fault domain, new host assignment to the fault domains occurs here:

Confirm the configuration and click Finish:

This starts the host configuration processes that can be monitored via the Recent Tasks section of the vSphere Client. The process automatically
- Configures vMotion and Storage networking
- Adds/configures the disks on the new host(s) into the vSAN array
- Configures the fault domain(s)
Once the process finishes you will see the updated Quickstart screen below. Notice that the ‘Add Hosts’ and ‘Configure Hosts’ sections have green checks and that it shows 4 hosts configured:

At this point, it would be good practice to re-run the health check tests, under [vSAN Cluster] > Monitor > vSAN > Skyline Health and address any issues seen. In particular, verify that the ‘vSAN cluster partition’ test is healthy:

In this example we quickly added a host and completely configured it within a vSAN cluster. The additional resources are now available.
Manually Adding a Host to a vSAN Cluster
Note: If Quickstart was used (as per the earlier section) then this section can be skipped.
Manual vSAN enablement is available for those that do not wish to use the Quickstart process.
For this scenario, please follow the instructions on the VMware Docs page linked below.
- Manually create VMkernel adapters - https://docs.vmware.com/en/VMware-vSphere/8.0/vsphere-networking/GUID-8244BA51-BD0F-424E-A00E-DDEC21CF280A.html
- Adding a Host to a vSAN Cluster - https://docs.vmware.com/en/VMware-vSphere/8.0/vsan-administration/GUID-EA47DC82-4678-4430-AEF7-1D77FB9C77DB.html
- Claim Disks for vSAN - https://docs.vmware.com/en/VMware-vSphere/8.0/vsan-administration/GUID-F926CACE-1A97-44A3-9887-029B6B76549B.html#GUID-F926CACE-1A97-44A3-9887-029B6B76549B
Monitoring vSAN
To effectively monitor vSAN, there are several elements that need consideration. Below we will look at the overall health and capacity views; resynchronization and rebalance operations and performance metrics available in vCenter.
Overall vSAN Health
For a quick summary of the health of a vSAN cluster, vSAN Skyline Health provides a consolidated list of health checks. These checks are grouped into several categories, such as hardware compatibility, physical disk health and networking.
Navigate to [vSAN Cluster] > Monitor > vSAN > Skyline Health. This will show the holistic health state of the cluster, along with any alerts. On multiple issues (whereupon many alerts are generated) the system will try to list the primary issue affecting the cluster:

Selecting the issue and clicking on Troubleshooting will show a new screen with detailed information about the problem.


Clicking on ‘Ask VMware’ will open a knowledgebase article on how to fix the issue:
More information about this is available here:
- https://docs.vmware.com/en/VMware-vSphere/8.0/vsan-monitoring-troubleshooting/GUID-B0A8BF17-E3FB-421A-AC1A-8C1EC27294D5.html
- https://core.vmware.com/blog/health-and-performance-monitoring-enhancements-vsan-8-u2
vSAN Capacity
vSAN storage capacity usage may be examined by navigating to [vSAN Cluster] > Monitor > vSAN > Capacity.
This view provides a summary of current vSAN capacity usage and displays historical capacity usage information when Capacity History is selected. From the default view, a breakdown of capacity usage per object type is presented. In addition, a capacity analysis tool that facilitates effective free space remaining with respect to individual storage policies is available.

The vSAN Capacity UI distinguishes between the different vSphere replication objects within the capacity view.
Prior to vSAN 7u1, VMware recommended reserving 25-30% of total capacity for use as “slack space”. This space is utilized during operations that temporarily consume additional storage space, such as host rebuilds, maintenance mode, or when VMs change storage policies.
Slack space is replaced by “capacity reservation,” which is an improved methodology for calculating the amount of capacity set aside for vSAN operations. It yields significant gains in capacity savings (up to 18% in some cases). Additionally, the UI makes it simple to understand what amount of capacity is being reserved for temporary operations associated with normal usage, versus for host rebuilds (one host of capacity reserved for maintenance and host failure events).
This feature should be enabled during normal vSAN operations. To enable this new feature, click Reservations and Alerts and toggle the Operations Reserve and the Host Rebuild Reserve options. With ‘customize alerts’ custom thresholds can be set:

When Operations Reserve and Host Rebuild Reserve are enabled, “soft” thresholds are implemented that will attempt to prevent over-consumption of vSAN datastore capacity. In addition to triggering warnings/alerts in vSphere when capacity utilization is in danger of consuming space set aside as reserved, once the capacity threshold is met, operations such as provisioning new VMs, virtual disks, FCDs, clones, iSCSI targets, snapshots, file shares, or other new objects consuming vSAN datastore capacity will not be allowed.
Note, I/O activity for existing VMs and objects will continue even if the threshold is exceeded, ensuring that current workloads remain available and functioning as expected.
As VMs will continue to be able to write to provisioned space, it is important that administrators monitor for capacity threshold alerts and take action to free up (or add) capacity to the vSAN cluster before capacity consumption significantly exceeds the set thresholds.
Additionally, the vSAN Capacity UI provides an estimate of the capacity required if thin-provisioned objects were fully provisioned has been added to the monitoring summary at vSAN Datastore > Monitor > vSAN > Capacity:

Resync Operations
Another very useful view is the [vSAN Cluster] > Monitor > vSAN > Resyncing Objects view. This will display any resyncing or rebalancing operation that might be taking place on the cluster. For example, if there was a device failure, resyncing or rebuilding activity could be observed here. Resync can also happen if a device was removed or a host failed, and the CLOMd (Cluster Logical Object Manager daemon) timer expired. Resyncing objects dashboard provides details of the resync status, amount of data in transit, and estimated time to completion.
With regards to rebalancing, vSAN attempts to keep all physical devices at less than 80% capacity. If any physical device capacity passes this threshold, vSAN will move components from this device to other devices in the cluster to rebalance the physical storage.
In an ideal state, no resync activity should be observed, as shown below.

Resyncing activity usually indicates:
- Failure of a device or host in the cluster
- Device has been removed from the cluster
- Physical disk has greater than 80% of its capacity consumed
- Policy change has been implemented which necessitates a rebuilding of a VM’s object layout (In this case, a new object layout is created, synchronized with the source object, and then discards the source object)
vSphere replication object types are visible within the Virtual Objects view, allowing administrators to clearly distinguish replica data from other data types.

Performance Monitoring
Performance monitoring service can be used for verification of performance as well as quick troubleshooting of performance-related issues. Performance charts are available for many different levels.
- Cluster
- Hosts
- Virtual Machines and Virtual Disks
- Disk groups
- Physical disks
A detailed list of performance graphs and descriptions can be found here:
- https://kb.vmware.com/s/article/2144493 (part 1)
- https://kb.vmware.com/s/article/91976 (part 2)
- https://kb.vmware.com/s/article/91977 (part 3)
The performance service should be enabled by default when a vSAN cluster is created in vCenter. In case it is not, enable the performance monitoring service by navigating to [vSAN Cluster] > Configure > vSAN > Services and clicking on Edit:

Once the service has been enabled performance statistics can be viewed from the performance menus in vCenter. In the following example, we will examine IOPS, throughput, and latency from the Virtual Machine level and the vSAN Backend level.
vSAN Cluster Performance Graphs
To access cluster-level performance graphs, navigate to [Cluster] > Monitor > Performance. Choose an appropriate time frame and click Show Results:

Access the vSAN Backend performance metrics, select the BACKEND tab from the menu at the top:

If vSAN File Shares are configured, FILE SHARE tab becomes available to show information on file share performance, (for more information on vSAN File Shares, refer to the vSAN Proof of Concept: vSAN Features guide):

It is easier to compare performance across VMs. From the cluster level, click Monitor and then Performance. Now we can look at the cluster level or show specific VMs (Up to 10 at a time). This makes it easy to compare IOPS, Throughput, and Latency for multiple VMs:

We can also look at the ‘top contributors’ to performance (the defined metrics are for read/write latency, read/write IOPS and read/write throughput, from VM, Disk, Host-frontend, and Host-backend).
Here we look at the VM write latency (over a 1-hour period):

The BACKEND tab shows various holistic metrics – in particular any latency spikes or congestion here (for example, due to failing hardware) are easily spotted here:

vSAN Host Performance Graphs
In addition to the cluster level, further performance detail per host can be found by navigating to [Host] > Monitor > vSAN > Performance. This includes metrics for the backend cache, physical adapters, and host network. In particular, the physical adapter view can be useful in troubleshooting network issues:

I/O Insight
To capture a deeper level of metrics, I/O Insight gathers traces from the hosts. Navigate to [Cluster] > Monitor > vSAN > Performance and select the I/O INSIGHT tab. Then click on NEW INSTANCE:

Then select the targets to monitor. Here we have selected all the hosts in the cluster:

Next, select the duration. The default is 10 minutes:

Then review and click Finish to start I/O Insight.

We can then see that the metric gathering has started, and the time remaining:

Once completed, click on the ellipses (three dots) and View Metrics:

The results are filtered by VM. Select a VM of interest to see detailed metrics, such as IO size/ latency distribution, IO randomness and read/write ratio:

I/O Trip Analyzer
I/O trip analyzer is a per-vm tool used to obtain a breakdown of latencies from the vSAN stack. To launch an instance, navigate to [VM] > Monitor > vSAN > I/O Trip Analyzer and click on RUN NEW TEST:

Set the time to analyze (the default is five minutes) and click on ‘RUN’ to start the test. Once the test is complete, click on VIEW RESULT:

This will then show a map of how the virtual disk in the host interacts with the network adapters and physical disks:

Clicking on any of the elements in the I/O Trip Analyzer screen will bring up performance details for that object, for instance:

Advanced Statistics
In day-to-day operations, the graphs above should be sufficient for most. To view advanced and debug information, navigate to [vSAN Cluster] > Monitor > vSAN > Support and click on PERFORMANCE FOR SUPPORT:

The metrics here are extensive; a variety of performance stats are available for review.
Advanced Performance Monitoring using vsantop
The vsantop utility monitors vSAN performance metrics within an individual ESXi host. Traditionally with ESXi, an embedded utility called esxtop was used to view real-time performance metrics. This utility assisted in ascertaining the resource utilization and performance of the system.
Like esxtop, vsantop collects and persists statistical data in a RAM disk. Based on the configured interval rate, the metrics are displayed on the secure shell console (this interval is configurable, dependent on the amount of detail required). The workflow is illustrated below for a better understanding:
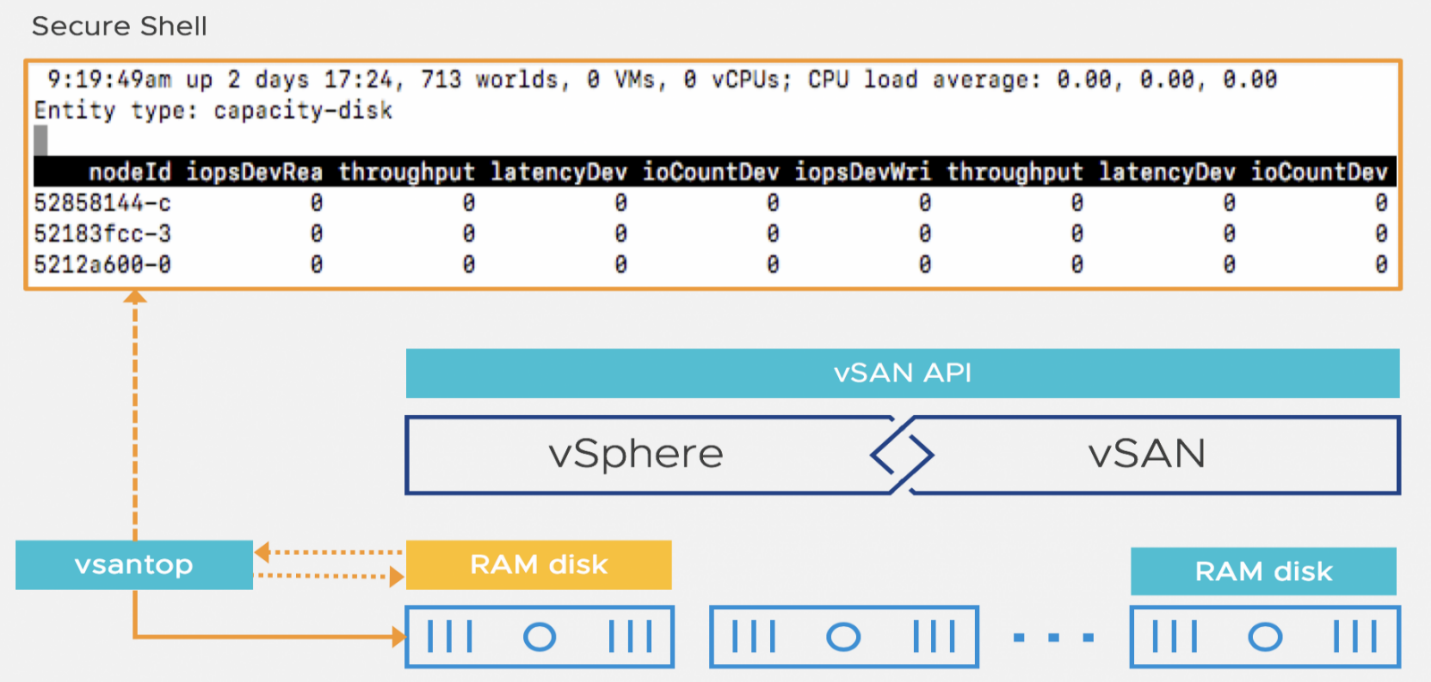
To initiate a vsantop session, open an SSH session to a host and run ‘vsantop’. The default view shows the cluster manager (CMMDS) output. To select another field, type the letter ‘E’ (for entity), which will bring up a menu to choose other views (note, it may take a while for data to populate):
For example, here we can see the vSAN ESA disk layer statistics:


For more information on vsantop, visit: https://core.vmware.com/resource/getting-started-vsantop
Monitoring vSAN through Integrated VMware Aria® Operations™ in vCenter
Overview
Further metrics and detail can be seen through VMware Aria Operations dashboards. There are a variety of ways to integrate Aria Operations with your vCenter instance.
This guide focuses on deploying a new Aria Operations instance directly from the vCenter GUI.
If you have an existing Aria Operations instance or you do not want the vCenter GUI integration, use these options:
- Integrating with an existing Aria Operations install
- Ensure your vCenter instance is configured in Aria Operations - https://docs.vmware.com/en/VMware-Aria-Operations/8.14/Configuring-Operations/GUID-315C57B6-A383-4DBA-A8D0-FEF6CC56F0B4.html
- Ensure you vSAN deployment is configured in Aria Operations - https://docs.vmware.com/en/VMware-Aria-Operations/8.14/Configuring-Operations/GUID-D2031BAE-43EA-47AA-AF53-1D62C86C3EA5.html
- Manually install Aria Operations, then integrate with your vCenter and vSAN deployment
Deploying Aria Operations via vCenter Integration
You can initiate the workflow by navigating to Menu > VMware Aria Operations Configuration. Once on the VMware Aria Operations screen, click Install VMware Aria Operations:

This will call up the Install VMware Aria Operations wizard. Fill out the details as required for the connection to deploy a Aria Operations instance via OVF.
Note: The workflow assumes either Internet access to directly download the appliance or a previous locally downloaded copy. In this example we used a locally downloaded copy:

Continue through the Install VMware Aria Operations wizard, then click Finish:

The Aria Operations OVF will be deployed. During the process you will see the wait screen below:

After the Aria Operations OVF is deployed and started, the configuration wizard will begin. Click Start VMware Aria Operations Onboarding, then Continue Installation:


The final steps are to initialize the New Cluster. This wizard will have you set the admin password for the Aria Ops instance and connection to your vCenter server. Walkthrough the steps below:


Once these screens are completed Aria Operations will finish configuration. To include registering the vCenter and vSAN instances with Aria Operations as well as start data collection and processing.
After the process is complete, you can access the predefined dashboards as shown below, using the Quick Links’ menu. Depending on the size of your environment it may take a few hours for data to process and display on screen:

The following out-of-the-box dashboards are available for monitoring purposes,
- vCenter - Overview
- vCenter - Cluster View
- vCenter - Alerts
- vSAN- Overview
- vSAN - Cluster View
- vSAN - Alerts
For example, in the vSAN cluster view, useful metrics such as disk IOPs and capacity are shown. This allows administrators to quickly assess the state of the cluster:

For further information please review:
- VMware Aria Suite in vSAN Environments - https://core.vmware.com/resource/vrealize-operations-and-log-insight-vsan-environments
- VMware Aria Operations documentation - https://docs.vmware.com/en/vRealize-Operations/index.html
Testing Hardware Failures
Understanding Expected Behaviors
When conducting any failure testing, it is important to consider the expected outcome before the test is conducted. With each test described in this section, you should first read the preceding description to first understand how the test will affect the system.
Note: It is important to test one scenario at a time and restore completely before the next test condition. Only test one thing at time.
As with any system design, a configuration is built to tolerate a certain level of availability and performance. It is important that each test is conducted within the limit of the design systematically. By default, VMs deployed on vSAN inherit the default storage policy, with the ability to tolerate one failure. When a second failure is introduced without resolving the first, the VMs will not be able to tolerate the second failure and may become inaccessible. It is important that you resolve the first failure or test within the system limits to avoid such unexpected outcomes.
VM Behavior when Multiple Failures Encountered
A VM remains accessible when a full mirror copy of the objects are available, as well as greater than 50% of the components that make up the VM (to maintain quorum).
Below, we discuss VM behavior when there are more failures in the cluster than the NumberOfFailuresToTolerate setting in the policy associated with the VM.
VM Powered on and VM Home Namespace Object Goes Inaccessible
If a running VM has its VM Home Namespace object go inaccessible due to failures in the cluster, several different things may happen. Once the VM is powered off, it will be marked "inaccessible" in vCenter. There can also be other effects, such as the VM being renamed to its “.vmx” path rather than VM name, or the VM being marked "orphaned".
VM Powered on and Disk Object is inaccessible
If a running VM has one of its disk objects become inaccessible, the VM may keep running in memory. Typically, the Guest OS will eventually time out due to I/O operations to disk. Operating systems may either crash when this occurs or downgrade the affected filesystems to read-only (the OS behavior and even the VM behavior is not vSAN specific). These effects can also be seen on VMs on traditional storage when the host suffers from an APD (All Paths Down) state.
Once the VM becomes accessible again, the status should resolve, and things go back to normal. Of course, data remains intact during these scenarios.
What happens when a Host Fails?
A host failure can occur in numerous ways, it could be a crash, or it could be a network issue (which is discussed in more detail in the next section). However, it could also be something as innocent as a reboot.
Any components that were part of the failed host are marked as ‘absent’. I/O flow to the object is restored by removing the absent component from the active set of components in the object.
The ‘absent’ state is chosen rather than the ‘degraded’ state because of the likelihood of the failure being transient (i.e. due to a reboot). For instance, a host might be configured to auto-reboot after a crash, or the host’s power was temporarily interrupted. For this reason, a set amount of time is allowed before starting to rebuild objects on other hosts, so as not to waste resources. By default, this timer is set to 60 minutes. If the timer expires, and the host has not rejoined the cluster, a rebuild of components on the remaining hosts in the cluster commences.
Moreover, if a host fails or is rebooted, this event will trigger a ‘host connection and power state’ alarm in vCenter. If vSphere HA is enabled on the cluster, it will also trigger a ‘vSphere HA host status’ alarm and a ‘Host cannot communicate with all other nodes in the vSAN Enabled Cluster’ warning message on all remaining hosts. If any VMs were running on the failed host, they are restarted on another host in the cluster.
Simulating Failure Scenarios Using Pre-Check
It can be useful to run simulations on the loss of a particular host or disk, to see the effects of planned maintenance or hardware failure. The Data Migration Pre-Check feature can be used to check object availability for any given host or disk. These can be run at any time without affecting VM traffic.
Loss of a Host - vSAN ESA
Navigate to: [vSAN Cluster] > Monitor > vSAN > Data Migration Pre-check
From here, you can select the host to run the simulations on:

After a host is selected, the pre-check can be run against three available options, i.e., Full data migration, Ensure accessibility, No data migration:

Select the desired option and click the Pre-Check button. This gives us the results of the simulation. From the results, three sections are shown: Object State, Cluster Capacity and Predicted Health.
The Object State view shows how the individual objects will be affected:

The example pre-check shows a vSAN File Services appliance as inaccessible. vSAN File Services leverages an internal multi-appliance clustering solution. In case of a host going down the file services appliance on said host will be in a down-state. The other file service appliance will continue to support vSAN File Service functionality. When the host comes back-up, the administrator can ensure the local file service appliance is restarted. Once restarted it will automatically return to service.
Cluster Capacity shows how the capacity of the other hosts will be affected. Below we see the effects of the Full data migration' option:

Predicted Health shows how the health of the cluster will be affected:

Loss of a Disk -vSAN ESA
Navigate to [vSAN Cluster] > Configure > vSAN > Disk Management:
From here, select a host. Then click View Disks:

Then select an individual disk and click Go To Pre-Check to run simulation on the selected disk:
If you click on Go To Pre-Check at the higher-level on this screen it will run the analysis at the host level instead:

Once the Pre-Check Data Migration button option is selected, we can run different simulations to see how the objects on the disk are affected. Again, the options are Full data migration, Ensure accessibility (default) and No data migration:

Conducting Failure Testing
Unlike the previous section (where the effects of known failure scenarios are depicted) here we attempt to re-create real world issues to see how the system reacts.
Host Failure
The test will show that in a host failure:
- vSAN-backed VMs will still seamlessly migrate to a new host
- Even with the loss of vSAN Virtual Objects on a particular failed host, vSAN will maintain data integrity
The assumption of this test is that vSphere High Availability (HA) and Distributed Resource Scheduler (DRS) are enabled.
Navigate to [vSAN Cluster] > Summary to verify vSphere HA and DRS status:

Select a host with running VMs. Make note of which VMs are running on the target host for later reference.
To simulate the failure, we reboot the host: this is best achieved with the host’s out-of-band (OOB) management interface, such as an iLO or iDRAC (or as a last resort, via an SSH session).
We can now observe what happens with the protection mechanisms in place.
Once the host reboots, several HA related events should be displayed on the ‘Summary’ tab of the vSAN cluster (you may need to refresh the UI to see these):

Confirm that vSphere HA restarted the VMs, you noted previously, on another host. If there was a vCLS VM or vSAN File Services appliance (if vSAN File Services are configured) on the host, we can ignore them. Those specialized VMs are tied to a specific host and would not be restarted by HA on another host.
Once you have confirmed the VMs are restarted on another host, navigate to [vSAN Cluster] > Monitor > vSAN > Virtual Objects. In this view, we see that some components are temporarily unavailable.

Once the host reboot completes, you will see the virtual objects warnings clear. This may take a few minutes and you may need to refresh the screen:

vSAN will wait for a prescribed time, based on the Object Repair Timer setting, before initiating rebuild operations. Rebuild operations will recreate unavailable virtual objects to another available host in the cluster. If the failed host comes back on-line (or is replaced) later, vSAN will automatically rebalance. The default wait time is 60 minutes.
vSAN Disk Fault Injection Script for Failure Testing
A script to help with storage device failure testing is included with ESXi and is available on all hosts. The script, 'vsanDiskFaultInjection.pyc' can be found in '/usr/lib/vmware/vsan/bin':
[root@localhost:~] python /usr/lib/vmware/vsan/bin/vsanDiskFaultInjection.pyc -h
Usage:
            injectError.py -t -r error_durationSecs -d deviceName
            injectError.py -p -d deviceName
            injectError.py -z -d deviceName
            injectError.py -T -d deviceName
            injectError.py -c -d deviceName
Options:
  -h, --help            show this help message and exit
  -u                    Inject hot unplug
  -t                    Inject unrecoverable read error
  -p                    Inject permanent error
  -z                    Inject health error
  -c                    Clear injected error
  -T                    Inject Transient error
  -r ERRORDURATION      unrecoverable read error duration in seconds
-d DEVICENAME, --deviceName=DEVICENAME Note: This command should only be used in test environments. Using this command to mark devices as failed can have a catastrophic effect on a vSAN cluster.
In some circumstances, transient device errors could cause vSAN objects to be marked as degraded and vSAN may unnecessarily mark a device as failed. vSAN, through Full Rebuild Avoidance (FRA), can differentiate between transient and permanent storage errors, thus avoiding unnecessary object rebuilds.
For the purposes of testing, however, we need to simulate hardware failures and rebuilds. The below procedure outlines toggling this feature on or off.
As the setting is enabled on a per vSAN node basis, to view the current value issue from an ESXi host issue:
esxcli system settings advanced list -o /LSOM/lsomEnableFullRebuildAvoidanceTo disable FRA (required to run the failure tests):
esxcli system settings advanced set -o /LSOM/lsomEnableFullRebuildAvoidance -i 0Once failure testing is complete, re-enable:
esxcli system settings advanced set -o /LSOM/lsomEnableFullRebuildAvoidance -i 1It should be noted that the same tests can be run by simply removing the disk from the host. If physical access to the host is convenient, literally pulling a disk would test exact physical conditions as opposed to emulating it within the software.
Also, note that not all I/O controllers support hot unplugging drives. Check the vSAN Compatibility Guide to see if your controller model supports the hot unplug feature.
vSAN ESA combines cache/capacity functions within each disk in the cluster. There is no separation of caching and capacity functions. A failure of one disk in a vSAN ESA cluster is isolated to only the failed disk. vSAN OSA separate cache and capacity functions on separate disks.
The two tests below leverage a vSAN ESA cluster:
- The results are the same applied to a vSAN OSA capacity disk
- If a vSAN OSA cache disk fails, the underlying capacity disks in that disk group are unavailable as well (regardless of the health of those capacity disks)
Storage Device is Removed Unexpectedly - vSAN ESA
When a storage device is suddenly removed from a vSAN host, all the components residing on the device will go into an ‘absent’ state.
The ‘absent’ state is chosen over ‘degraded’ as vSAN assumes that the device is temporarily unavailable (rather than failed). If the disk is placed back in the server before the cluster services timeout (60 minutes by default), then the state will return to a healthy state without the (expensive) rebuild of data.
Thus:
The device state is marked as ‘absent’ in vCenter
-
If the object has a policy that dictates the ‘failures to tolerate’ of one or greater, the object will still be accessible from another host in the vSAN Cluster (marked with ‘reduced availability with no rebuild - delay timer’)
-
If the same device is available again within the timer delay (60 min. by default), no components will be rebuilt
-
If the timer elapses and the device is still unavailable, components on the removed disk will be built elsewhere in the cluster (if capacity is available), including any newly claimed devices
-
If the VM Storage Policy has the ‘failures to tolerate’ set to zero, the object will be inaccessible
-
To restore the object, the same device must be made available again
In this example, we shall remove a storage device from the host using the 'vsanDiskFaultInjection.pyc' python script rather than physically removing it from the host.
We shall then ‘replace’ the storage device before the object repair timeout delay expires (default 60 minutes), which will mean that no rebuilding activity will occur during this test.
To start, select a running VM. Then navigate to [vSAN Cluster] > Monitor > Virtual Objects and find the VM from the list and select an object. In the example below, we have selected ‘Hard disk 1’:

Select View Placement Details to show which hosts the object has components on. In the below example, the components are in a vSAN ESA cluster:

The column that we are interested in here is the ‘Disk’ identifier and the host it resides on. The component that will be impacted by the test is highlighted in the example. Note it may be easier to see by selecting the column toggle (on the bottom left) and selecting the appropriate information to display. In this case, the ‘Fault Domain’ column filtered out and the remaining columns resized.
Copy the disk ID string and SSH into the host that contains the component. We can then inject a hot unplug event using the python script:
[root@10.156.130.217:~] python /usr/lib/vmware/vsan/bin/vsanDiskFaultInjection.pyc -u -d t10.NVMe____INTEL_SSDPE2KX020T7_____________________0000CBA55FE4D25C
vsish -e set /reliability/vmkstress/ScsiPathInjectError 1
Injecting hot unplug on device t10.NVMe____INTEL_SSDPE2KX020T7_____________________0000CBA55FE4D25C
vsish -e set /storage/scsifw/paths/vmhba7:C0:T0:L0/injectError nvme 0x0000b000000
esxcli storage core adapter rescan --all
In vCenter, we observe the effects of the action. As expected, the component that resided on that disk on host 10.159.130.217 shows up as ‘Absent.:

The ‘Virtual Objects’ page should also show the component state as ‘Reduced availability with no rebuild – delay timer’. Notice that this screen shows all VMs impacted by the failure.

Go back to the SSH session from earlier and run the below command. The command again will perform a quick disk group unmount/remount to clear the simulated disk failure:
[root@10.156.130.217:~] python /usr/lib/vmware/vsan/bin/vsanDiskFaultInjection.pyc -c -d t10.NVMe____INTEL_SSDPE2KX020T7_____________________0000CBA55FE4D25C
vsish -e set /storage/scsifw/paths/vmhba7:C0:T0:L0/injectError nvme 0x00000
vsish -e set /reliability/vmkstress/ScsiPathInjectError 0
esxcli storage core adapter rescan --all
vsish -e set /reliability/vmkstress/ScsiDeviceInjectError 0
Clearing health on device t10.NVMe____INTEL_SSDPE2KX020T7_____________________0000CBA55FE4D25C
esxcli vsan storagepool unmount -d t10.NVMe____INTEL_SSDPE2KX020T7_____________________0000CBA55FE4D25C
esxcli vsan storagepool mount -d t10.NVMe____INTEL_SSDPE2KX020T7_____________________0000CBA55FE4D25C
Return to the Virtual Objects page and observe that the storage device has re-appeared, and the components are healthy.
Storage Device Removed, Not Replaced Before Timeout
Here, we will repeat the test above, but will leave the device ‘unplugged’ for longer than the timeout. We should expect to see vSAN rebuilding the component to another disk to achieve policy compliance. We begin again by identifying the disk on which the component resides:
The default ‘Object Repair Timer’ is 60 minutes. To speed up this test, we will reduce the object repair timer to suit our needs. To do this, navigate to [vSAN Cluster] > Configure > vSAN > Services > Advanced Options > Edit:

Then adjust the timer. Here we set it to five minutes, meaning vSAN will wait a total of five minutes before starting any rebuild activities:

To start the test, run the Python script again, taking note of the date:
[root@10.156.130.217:~] date
Fri Feb  9 18:08:04 UTC 2024
[root@w10.156.130.217:~] python /usr/lib/vmware/vsan/bin/vsanDiskFaultInjection.pyc -u -d t10.NVMe____INTEL_SSDPE2KX020T7_____________________0000CBA55FE4D25C
vsish -e set /reliability/vmkstress/ScsiPathInjectError 1
Injecting hot unplug on device t10.NVMe____INTEL_SSDPE2KX020T7_____________________0000CBA55FE4D25C
vsish -e set /storage/scsifw/paths/vmhba7:C0:T0:L0/injectError nvme 0x0000b000000
esxcli storage core adapter rescan --all
At this point, we can once again see that the state of the component is set to ‘Absent’:
After the ‘Object Repair Timer’ has elapsed, vSAN will rebuild the component onto another disk in the cluster. This may take a few minutes after the timer elapses for the rebuild to complete for all virtual objects impacted by the disk failure:

Go back to the SSH session from earlier and run the below command. The command again will perform a quick diskgroup unmount/remount to clear the simulated disk failure:
[root@10.156.130.217:~] python /usr/lib/vmware/vsan/bin/vsanDiskFaultInjection.pyc -c -d t10.NVMe____INTEL_SSDPE2KX020T7_____________________0000CBA55FE4D25C
vsish -e set /storage/scsifw/paths/vmhba7:C0:T0:L0/injectError nvme 0x00000
vsish -e set /reliability/vmkstress/ScsiPathInjectError 0
esxcli storage core adapter rescan --all
vsish -e set /reliability/vmkstress/ScsiDeviceInjectError 0
Clearing health on device t10.NVMe____INTEL_SSDPE2KX020T7_____________________0000CBA55FE4D25C
esxcli vsan storagepool unmount -d t10.NVMe____INTEL_SSDPE2KX020T7_____________________0000CBA55FE4D25C
esxcli vsan storagepool mount -d t10.NVMe____INTEL_SSDPE2KX020T7_____________________0000CBA55FE4D25C
If the object repair timer was changed, you can reset it back to the default (60 minutes):

Permanent Disk Error on a Device
If a disk drive has an unrecoverable error, vSAN marks the device as ‘degraded’ as the failure is permanent.
- If the object has a policy that dictates the ‘failures to tolerate’ of one or greater, the object will still be accessible from another host in the vSAN Cluster
- The disk state is marked as ‘degraded’ in vCenter
- If the VM Storage Policy has the ‘failures to tolerate’ set to zero, the object will be inaccessible (requires a restore of the VM from a known good backup)
- This applies to any vSAN ESA devices as well as vSAN OSA capacity devices
A vSAN OSA cache device failure follows a similar sequence of events to that of a storage device failure with one major difference; vSAN will mark the entire disk group as ‘degraded’. As the failure is permanent (disk is offline) it is no longer visible.
- If the object has a policy that dictates the ‘failures to tolerate’ of one or greater, the object will still be accessible from another host in the vSAN Cluster
- Disk group and the disks under the disk group states will be marked as ‘degraded’ in vCenter
- If the VM Storage Policy has the ‘failures to tolerate’ set to zero, the object will be inaccessible (requires a restore of the VM from a known good backup)
When Might a Rebuild of Components Not Occur?
There are a couple of reasons why a rebuild of components might not occur. Start by looking at vSAN Health Check UI [vSAN Cluster] > Monitor > vSAN > Skyline Health for any alerts or failures.
Lack of Resources
Verify that there are enough resources to rebuild components before testing with the simulation tests detailed in the previous section.
Of course, if you are testing with a cluster size that cannot satisfy the ‘failures to tolerate’ defined in the hosted storage policies, and a failure is introduced, there will be no rebuilding of objects as the polices cannot be satisfied.
Underlying Failures
Another cause of a rebuild not occurring is due to an underlying failure already present in the cluster. Verify there are none before testing by checking the health status of the cluster.
Air-gapped Network Failures
Air-gapped vSAN network design is built around the idea of redundant, yet completely isolated storage networks. It is used in conjunction with multiple VMkernel interfaces tagged for vSAN traffic, where each VMkernel interface is on different VLANs/subnets. Thus, there is physical and logical network separation. A primary use case is to separate the IO data flow onto redundant data paths. Each path is then independent, and failure of one does not affect the other.
Note: The system will attempt to (round-robin) balance the traffic between the two VMkernel adaptors to tolerate link failure across redundant data paths.
The figure below shows the vmnic uplinks on each host, physically separated by connecting to different switches (and thus networks). The VMkernel ports are logically separated on separate VLANs (in different port groups on the distributed switch). Therefore, each host has a separate, redundant network path:

The table below shows the IP, VLAN and uplink details. Again, note that there is one uplink per VMkernel adapter. Each VMkernel adapter is on a separate VLAN.

Failover Test Scenario using DVS Portgroup Uplink Priority
Before we initiate a path failover, we need to generate some background workload to maintain a steady network flow through the two VMkernel adapters. You may choose your own workload tool or initate a HCIbench workload set.
Using the functionality in DVS, we can simulate a physical switch failure or physical link down by moving an "active" uplink for a port group to "unused" as shown below. This affects all VMkernel ports that are assigned to the port group.

Expected outcome on vSAN IO traffic failover
When a data path is down in air-gapped network topology, failover time is no more than 15 seconds as vSAN proactively monitors failed data path and takes corrective action as soon as a failure is detected.
Monitoring network traffic failover
To verify the traffic failover from one VMkernel interface to another, and capture the timeout window, we open an SSH session to each host and use the esxtop utility. Press "n" to actively monitor host network activities before and after a failure is introduced.
The screenshot below illustrates that the data path through vmk2 is down when the "unused" state is set for the corresponding uplink ("void" status is reported for that physical uplink). Notice that TCP packet flow has suspended on that VMkernel interface (as zeroes are reported under the Mb/s transmit (TX) and receive (RX) columns).

It is expected that vSAN health check reports failed pings on vmk2 as we set uplink 1 to "Unused".

To restore the failed data path after a failover test, modify the affected uplink from "unused" back to "active". Network traffic should be restored through both VMkernel interfaces (though not necessarily load-balanced).
Before testing other scenarios, be sure to remove the second VMkernel interface on each host and perform a vSAN health check and ensure all tests pass.
APPENDIX A: Creating Test VMs
Here we demonstrate how to quickly create a set of identical VMs for testing.
Requirements:
- FreeBSD, Linux or MacOS VM/host environment
- Latest version of govc (download instructions below)
Download govc:
Govc is a lightweight, open-source CLI tool written in Go (and part of the Govmomi/Go library for the vSphere API). Project page: https://github.com/vmware/govmomi/tree/master/govc
To download the latest release, use the command below, or visit the release page: https://github.com/vmware/govmomi/releases
As with the majority of Go projects, it is packaged as a single binary (note that the tar command requires root privileges to copy the binary to the correct location):
curl -L -o - "https://github.com/vmware/govmomi/releases/latest/download/govc_$(uname -s)_$(uname -m).tar.gz" | tar -C /usr/local/bin -xvzf - govcConnecting to vCenter
To authenticate with vCenter, we need to define the username, password and URL, as per the example below:
export GOVC_USERNAME=administrator@vsphere.local
export GOVC_PASSWORD=P@ssw0rd
export GOVC_INSECURE=1
export GOVC_URL=10.156.163.1
Additionally, we will need to specify the default datastore and resource pool (we can define this as the default/top-level cluster, as per blow) for deploying our VMs:
export GOVC_DATASTORE=ESA-vsanDatastore
export GOVC_RESOURCE_POOL='vSAN ESA Cluster/Resources'
Finally test the connection to vCenter by issuing the command below, it should return with details:
govc about
FullName:     VMware vCenter Server 8.0.0 build-20519528
Name:         VMware vCenter Server
Vendor:       VMware, Inc.
Version:      8.0.0
Build:        20519528
...
Configure Test VM
First, specify a location of an OVA file to use. In the example below, we use an Ubuntu 22.04 cloud image:
export vmLocation=https://cloud-images.ubuntu.com/releases/22.04/release/ubuntu-22.04-server-cloudimg-amd64.ovaWe can then add our customizations, etc. by extracting the JSON from the OVA:
govc import.spec $vmLocation > ubuntu-vm.jsonUbuntu uses cloud-init to setup the OS environment. As we will be cloning the deployed VM, we need to define specific user-data (which will be encoded in base-64 and added to the customization JSON). Here we ensure that vSphere specific configuration is not disabled, and we modify the default netplan configuration file to ensure DHCP addresses are assigned by mac address (rather than machine-id).
To simplify the process, the user-data file can be downloaded from the link below:
https://raw.githubusercontent.com/vmware-tanzu-experiments/vsphere-with-tanzu-proof-of-concept-samples/main/VCF/test_vms/user-data
#cloud-config
runcmd:
  - 'echo "disable_vmware_customization: false" >> /etc/cloud/cloud.cfg'
  - echo -n > /etc/machine-id
  - |
    sed -i '' -e 's/match.*/dhcp-identifier: mac/g' -e '/mac/q' /etc/netplan/50-cloud-init.yaml
final_message: "The system is prepped, after $UPTIME seconds"
power_state:
  timeout: 30
  mode: poweroff
If available, use the cloud-init CLI to check the user-data file:
$ cloud-init schema --config-file user-dataNext, we encode the user-data to base64:
base64 -i user-dataNow we can edit the JSON file we extracted earlier. Change the file with the following:
-
Disk provisioning set to ‘thin’
-
Add the public key of the machine we are connecting from
-
Remove the hostname and password data
-
Set the network for the VM (the name of the relevant portgroup in vCenter)
-
Set the name of the VM
-
In the ‘user-data’ section, paste in the base64 encoded data
Note we can avoid hand-editing the JSON by using jq. For example, we can update the user-data field directly in the JSON file:
jq 'select(.Key=="user-data").Value="$(base64 -i user-data)"' ubuntu-vm.jsonSimilarly, adding a public key stored in a user's GitHub profile:
jq 'select(.Key=="public-keys").Value="$(curl -sk https://api.github.com/users/[github user]/keys | jq -r '.[].key')"' ubuntu-v.jsonAn example of this file can be seen here:
https://raw.githubusercontent.com/vmware-tanzu-experiments/vsphere-with-tanzu-proof-of-concept-samples/main/VCF/test_vms/ubuntu-vm.json
{
  "DiskProvisioning": "thin",
  "IPAllocationPolicy": "dhcpPolicy",
  "IPProtocol": "IPv4",
  "PropertyMapping": [
    {
      "Key": "instance-id",
      "Value": "id-ovf"
    },
    {
      "Key": "hostname",
      "Value": ""
    },
    {
      "Key": "seedfrom",
      "Value": ""
    },
    {
      "Key": "public-keys",
      "Value": "ssh-rsa AAAAB3NzaC1yc2EAAAAD..."
    },
    {
      "Key": "user-data",
      "Value": "I2Nsb3VkLWNvbmZpZwpy..."
    },
    {
      "Key": "password",
      "Value": ""
    }
  ],
  "NetworkMapping": [
    {
      "Name": "VM Network",
      "Network": "DSwitch-DHCP"
    }
  ],
  "MarkAsTemplate": false,
  "PowerOn": false,
  "InjectOvfEnv": false,
  "WaitForIP": false,
  "Name": "ubuntu-vm"
}
Once this JSON file has been defined, we can double-check our user-data encoding is still correct:
awk -F '"' '/user-data/{getline; print $4}' ubuntu-vm.json | base64 -dThis should return the user-data as we defined above.
Import OVA to vCenter and Clone
We can then import the OVA into vCenter, specifying our JSON customization file:
govc import.ova -options=ubuntu-vm.json -name=ubuntu-template $vmLocationAfter this has imported, we can update the virtual disk size. Here we set it to 100G:
govc vm.disk.change -vm ubuntu-template -disk.label "Hard disk 1" -size 100GPower on the VM to allow it to run cloud-init (and thus our previously defined commands). Once complete, the VM will shutdown:
govc vm.power -on ubuntu-templateOnce the VM has shutdown, mark it as a template:
govc vm.markastemplate ubuntu-templateFinally, we can clone our template VM as we need to. In the example below, we clone it ten times:
for x in {1..10};do govc vm.clone -vm ubuntu-vm ubuntu-vm$x;doneTo do this for a large number of VMs, in parallel (and output to a log file) we could run:
for x in {1..250};do (govc vm.clone -vm ubuntu-template ubuntu-vm$x >> $(date +%d%m-%H%M)_clone.log 2>&1 &);doneWe can monitor progress by probing the vCenter task-list:
govc tasks -f -lAfter cloning, we can batch-execute commands on all the VMs. For example, the 'ls' command:
govc find -type m -name 'ubuntu-vm*' | xargs -P0 -I '{}' bash -c 'ssh -o "StrictHostKeyChecking=no" ubuntu@$(govc vm.ip {}) ls'APPENDIX B: PCI HOTPLUG
NVMe has helped usher in all-new levels of performance capabilities for storage systems. vSphere 7 introduced hotplug support for NVMe devices. Consult the vSAN HCL to verify supportability and required driver and firmware versions
vSphere 7.0 and above follow the standard hot plug controller process and can be categorized into two processes, surprised and planned PCIe device hot-add.
Surprise Hot-Add
The device is inserted into the hot-plug slot without prior notification: without the attention button or software interface (UI/CLI) mechanism.

Planned Hot-Add

Note: After these steps, the ESXi device manager attaches the devices to the driver and the storage stack, presents the HBA, and the associated disk(s) to the upper layer, for example vSAN/VMFS.
Surprise Hot-Remove
In this case, the drive is removed without any prior notification through attention button or UI/CLI. If the user did not run preparatory steps, data consistency cannot be guaranteed. In the case of failed drives, the scenario is the same as abrupt removal without the preparatory steps, in which case no data consistency can be guaranteed.

Planned Hot-Remove
It is expected that the user runs the preparatory steps to ensure the data consistency, before initiating hot remove operation via the attention button/software interface (UI/CLI). Even in this case, if the user does not run preparatory steps, data consistency cannot be guaranteed.

For more information on PCI hotplug, visit:
- PCIe hotplug: ESX host may crash when PCIe NVMe device(s) surprise hot removed and hot inserted back quickly - https://kb.vmware.com/s/article/78390
- Supported scenarios of NVME hot plug/removal in ESXi (78297) - https://kb.vmware.com/s/article/78297